

Abstract
Tyrosyl radicals play essential roles in biological proton coupled electron transfer (PCET) reactions. Ribonucleotide reductase (RNR) catalyzes the reduction of ribonucleotides and is vital in DNA replication in all organisms. Class Ia RNRs consist of α2 and β2 homodimeric subunits. In class 1a RNR, such as the E. coli enzyme, an essential tyrosyl radical (Y122O•)-diferric cofactor is located in β2. While Y122O• is extremely stable in free β2, Y122O• is highly reactive in the quaternary substrate-α2β2 complex and serves as a radical initiator in catalytic PCET between β2 and α2. In this report, we investigate the structural interactions that control the reactivity of Y122O• in a model system, isolated E. coli β2. Y122O• was reduced with hydroxyurea (HU), a radical scavenger that quenches the radical in a clinically relevant reaction. In the difference FT-IR spectrum, associated with this PCET reaction, amide I (CO) and amide II (CN/NH) bands were observed. Specific 13C-labeling of the tyrosine C1 carbon assigned a component of these bands to the Y122-T123 amide bond. Comparison to density functional calculations on a model dipeptide, tyrosine-threonine, and structural modeling demonstrated that PCET is associated with a Y122 rotation and a 7.2 Å translation of the Y122 phenolic oxygen. To test for the functional consequences of this structural change, a proton inventory defined the origin of the large solvent isotope effect (SIE=16.7±1.0 at 25°C) on this reaction. These data suggest that the one electron, HU-mediated reduction of Y122O• is associated with two, rate-limiting (full or partial) proton transfer reactions. One is attributable to HU oxidation (SIE=11.9, net H atom transfer), and the other is attributable to coupled, hydrogen-bonding changes in the Y122O•-diferric cofactor (SIE=1.4). These results illustrate the importance of redox-linked changes to backbone and ring dihedral angles in high potential PCET and provide evidence for rate-limiting, redox-linked hydrogen-bonding interactions between Y122O• and the iron cluster.
Keywords: tyrosyl radical, proton coupled electron transfer, vibrational spectroscopy, proton inventory, conformational dynamics, density functional theory
Tyrosyl radicals play an essential role in proton coupled electron transfer (PCET). Examples are found in photosynthesis and DNA replication.1–3 Oxidation of tyrosine at pH values less than the phenolic pKa leads to a PCET reaction. The neutral tyrosine radical can then accept an electron and/or a proton and thus facilitate long-distance PCET reactions. Coupling of proton transfer to electron transfer occurs due to the change in the phenolic pKa from ∼10 in the singlet state to –2 in the radical state.4 In this neutral radical, the unpaired spin density is delocalized over the 1’, 3’, and 5’ carbons of the ring and the phenoxyl oxygen.5–6
In all organisms, the building blocks of DNA, deoxyribonucleotides, are generated from ribonucleotides by RNR. The class Ia enzyme consists of two homodimeric subunits, α2 and β2. Catalysis is initiated by the generation of a transient thiyl radical at position 439 (E. coli) in α2.7 A tyrosyl radical in β2, Y122O•, oxidizes C439 by multistep PCET process over a distance of ca. 35 Å.8–12 In the E. coli α2β2/substrate/effector complex, the redox chemistry of Y122O• is rapid and gated by conformational dynamics.13 However, in the isolated ∼87 kDa soluble β2 protein from E. coli, Y122O• is stable for days.
A crystal structure (Figure 1A) of met (Y122OH) β2 places the singlet tyrosine within hydrogen-bonding distance (3.4 Å) of an aspartate (D84), which is an iron ligand.14 Early magnetic resonance and vibrational spectroscopic studies supported the conclusion that Y122O• is not hydrogen-bonded.15–16 An electron paramagnetic resonance (EPR) study of Y122O•, generated in H2O2-soaked met β2 crystals, proposed that the ring translates a small distance from D84 (Figure 1B, pink), when Y122O• is oxidized.14 Pulsed electron-electron double resonance (PELDOR) experiments determined the Y122O•-Y122O• distance as 33 Å, similar to the distance in the crystal structure (singlet state), between the two monomers of the β2 dimer.17–18
Figure 1.

Crystal structure of the 1.4 Å met (Y122OH; PDB# 1MXR) β2 structure.14 Distances are in Ångstroms. Iron atoms are orange spheres. (B) shows the schematic diagram of the proposed Y122O• conformational change presented in ref3 (pink) and this work (green). For comparison, the singlet form is in light gray. The arrow illustrates the amide carbonyl translation, which is required in the model in ref 3, but is not predicted by the model described here. (C) Schematic for generating isotope-edited spectra (see Figures 3 and 6), which reflect bands sensitive to Y122O• reduction and to incorporation of the 13C isotope in the Y-T amide bond.
Previously, we used UV resonance Raman spectroscopy to assign CO (Y7a) and ring (Y8a) vibrations to Y122O•. The frequencies of these bands were downshifted by 17 (1516 → 1499) and 16 (1572 → 1556) cm−1, respectively, when compared to frequencies observed in model compounds.3,19 While changes in hydrogen-bonding could explain spectral shifts to Y7a, Y8a is relatively insensitive to hydrogen-bonding interactions.20 Density functional theory (DFT) calculations on tyrosinate (deprotonated tyrosine) and tyrosyl radical models determined discrete energetic minima, or conformers (see ref 21 for definition), which are defined by the dihedral angles of the ring and backbone and labeled as A/B/C (singlet) and A/B/C/D (radical). Analysis of these conformers suggested that the Y7a and Y8a vibrational frequencies vary as a function of backbone and ring dihedral angles.21 Thus, we proposed a redox-linked conformer change (B→A) to explain the UV Raman results.3
As stated above, EPR studies of Y122O• proposed a translation of the phenolic oxygen ∼4 Å from D84 (Figure 1B, pink), compared to the crystal structure of the singlet state (Figure 1B, gray). When Y122O• was modeled in the B conformer 3 with this distance, a significant movement of its peptide carbonyl (C=O) appeared to be required (Figure 1B, arrow). EPR spectroscopy is relatively insensitive to structural changes at this distance from the phenolic ring and oxygen, where the unpaired spin is delocalized.
To identify conformational changes at this amide carbonyl group, we report here the results of tyrosine amide labeling and reaction-induced FT-IR spectroscopy. FT-IR spectroscopy monitors conformational dynamics in real time and has been employed to study many proteins (see 22–25 and references within). Using the combination of specific isotope labeling and reaction-induced FT-IR spectroscopy, structural changes at a single residue can be identified even in a protein containing hundreds of amino acids (see for example, 26). Y122O• can be reduced with hydroxyurea, and the difference spectrum associated with the reduction reaction can be recorded.27 Previously, specific labeling of the tyrosine ring (2H4Y) assigned bands in this reaction-induced FT-IR spectrum to Y122OH [Y19a (ring) at 1514 cm–1] and Y122O• [Y7a (CO) at 1498 cm–1].27 In addition to contributions from Y122OH/Y122O•, this spectrum also reflects all coupled structural changes that occur when Y122O• is reduced. For example, 13C aspartate labeling identified hydrogen-bonding changes at D84, which are coupled to Y122O• reduction, using this reaction-induced FT-IR technique.28
Amide I vibrational bands are exquisitely sensitive to changes in backbone and ring dihedral angles at the adjacent amide bonds.29–30 Amide I bands are intense in the FT-IR spectrum, but are not enhanced in the 229/244 nm UV Raman spectrum.3,19 Although the description of amide I (C=O) normal modes can be complex due to transition dipole coupling,31 use of reaction-induced or difference techniques can eliminate coupling and reveal perturbations at single or isolated amide groups. This was shown, for example, in the case of light-induced changes in bacteriorhodopsin.32 In the study presented here, the results of amide isotopic labeling are successfully interpreted in terms of density functional calculations on a dipeptide. These calculations provide frequencies and isotope shifts for the lowest energy conformers of tyrosine-threonine dipeptide models and their isotopologues.
In these reaction-induced FT-IR measurements, HU is used to reduce the tyrosyl radical, which is usually stable in isolated E. coli β2. The HU reduction mechanism is of importance, because HU has been used as cancer therapeutic agent for many years.33 The effect of HU on RNR is believed to be clinically relevant, because a mutation in β2 confers resistance.34 Previous work has shown that HU reduces Y122O•, but retains the diferric cluster, by a free radical mechanism.35 The reaction is first order in HU concentration and does not show saturation kinetics, suggesting that there is no defined binding site for HU.35 The efficiency for HU reduction of Y122O• increases by an order of magnitude with the formation of the quaternary complex.36 Thus, it has been proposed that HU may participate in multiple reduction pathways, including a catalytically-relevant PCET pathway.34–38 The HU reaction exhibits a large solvent isotope effect (SIE) of 15 at 20°C.27–28 Such a large isotope effect is of interest and may be consistent with hydrogen tunneling, a conformational change, and/or multiple rate-limiting proton transfer reactions in the tyrosyl radical-diferric cofactor. Here, we performed a proton inventory,39–41 which reports that multiple proton transfers occur in the rate-limiting step of this HU reaction. Taken together, the results support rate limiting conformational and hydrogen-bonding dynamics in the tyrosyl radical-diferric cofactor of isolated β2.
Materials and Methods
Sample Preparation
Overexpression and purification of the recombinant β2 subunit from E. coli BL21(DE3) cells were performed as described previously.27 Global 13C labeling of all β2 carbons was accomplished using 13C-glucose and M9 minimal media.42–43 Incorporation of 1-13C-tyrosine (13CY), 2H4-tyrosine (2H4), or 15N-tyrosine (15N) in β2 was achieved with a defined media.27 The tyrosine isotopologues were purchased from Cambridge Isotope Laboratories (Andover, MA) at 99, 98, and 98 % isotopic enrichments, respectively. With this protocol, the extent of isotope incorporation in all β2 tyrosine (16 per monomer) residues has previously been quantified as 90% using mass spec analysis.44 The incorporation at Y122O• is high, as assessed by cryogenic EPR spectroscopy (see Supporting Information and Figure S1, for details). Typical yields for natural abundance (NA) β2 samples were 20–25 mg protein per g of cells, for 13C-β2 samples were 16 mg protein per g of cells, for 13CY-β2 samples were 22 mg protein per g of cells, for 2H4Y-β2 samples were 8 mg protein per g of cells, and for 15NY-β2 samples were 6 mg protein per g of cells. The β2 concentration was determined using UV-visible spectroscopy and ε280 = 131,000 M−1 cm−1 . The Y122O• yield was determined using the dropline procedure,45 with the absorbances at 416, 411, and 406 nm. β2 is a homodimer and the average Y122O• per dimer for NA β2, 13C-β2, 13CY-β2, 2H4Y-β2, and 15NY-β2 was 1.15, 1.2, 1.3, 1.0, and 0.9, respectively. Prior to FT-IR experiments, the protein samples were exchanged27 into 5 mM Hepes, pD 7.6 (pD values are recorded as the uncorrected meter reading, see refs39,41).
Kinetics and Proton Inventory
HU-mediated Y122O• reduction kinetics were monitored at 20°C (FT-IR conditions) and 25°C (proton inventory) on a Varian Cary 50 (Varian, Walnut Creek, CA) spectrophotometer equipped with a temperature controller. The decays of Y122O• were monitored over 30 min and fit to mono-exponential functions to determine the rate constants.28 The solution conditions were 40 µM β2, pre-exchanged27 in 5 mM Hepes, pL 7.6 buffers at various H2O:D2O mixtures (100:0, 70:30, 60:40, 50:50, 40:60, 30:70, and 0:100). The solvent isotope effect (SIE) was determined by dividing the rate in 100% H2O by the rate in 100% D2O. HU was prepared as a stock (0.5M) in various H2O:D2O mixtures and the reaction concentrations were changed to achieve comparable Y122O• reduction (∼ 85%) over the 30 min reaction course. The methods described in refs39,41 were used to conduct a proton inventory (see Figure 2). The data points in the proton inventory were fit to the Gross-Butler equation, , where n is the mole fraction of D2O, υn is the rate constant at mole-fraction n, υ0 is the rate constant in 100% H2O, øTis the transition-state fractionation factor, and øRis the reactant-state fractionation factor (Table 1 and Table S1).
Figure 2.

Proton inventory for the Y122O• PCET reaction with hydroxyurea, collected at 25°C and in triplicate. The reactions were carried out in 5 mM Hepes, pL 7.6. The experimental data (Table S1) are shown as black dots. The error bars are one standard deviation. The equations used to model the data are derived from the Gross-Butler expression and given in Table 1. The red line simulates a one proton mechanism with the experimentally observed SIE (16.7). The blue line simulates a two proton, transition state mechanism with equivalent solvent isotope effects (4.09). The green line simulates a many proton mechanism, and the gray line simulates a reactant-state mechanism. The black line fits the data and simulates a two proton, transition-state mechanism with non-equivalent solvent isotope effects (1.4 and 11.9).
Table 1.
Simulation Parameters and Model Plots for Proton Inventory
| Plot | υ0(10−2) | υ100(10−2) | øT1 | øT2 | øR | Equationa | |
|---|---|---|---|---|---|---|---|
| One proton | 56.5 | 3.4 | 0.0599 | 1.00 | υn = υ0(1–n + 0.0599n) | ||
| Two protons (equal SIE) |
56.5 | 3.4 | 0.0599 | 1.00 | |||
| Two protons (unequal SIE) |
56.5 | 3.4 | 0.0839 | 0.714 | 1.00 | υn = υ0[(1–n + 0.0839n) (1 – n + 0.714n)] |
|
| Many protons | 56.5 | 3.4 | 0.0599 | 1.00 | υn = υ0(0.0599)n | ||
| Reactant state | 56.5 | 3.4 | 1.00 | 16.7 | υn = υ0(1 – n + 16.7n)–1 | ||
These formulas are derived from the Gross-Butler equation: , where n is the mole fraction of D2O, υn is the rate constant at mole-fraction n, υ0 is the rate constant in 100% H2O, υ100 is the rate constant in 100% D2O, øT is the transition-state fractionation factor, and øR is the reactant-state fractionation factor. The SIE (solvent isotope effect) is defined as kH/kD = øR /øT where kD is the rate constant in D2O, and kH is the rate constant in H2O. Typical øRvalues are in the 0.4–1.3 range and usually held as unity.75 If øR is assumed to be unity, the Gross-Butler expression simplifies to υn = υ0 ∏i(1 – n + nøTi).
FT-IR Spectroscopy
Reaction-induced FT-IR spectra were collected at 20°C on a Nicolet Magna 550 II spectrometer equipped with a temperature-controlled flow cell, as described.27 FT-IR data (120 s, 595 interferograms, mirror velocity 2.5 cm s−1) were collected at 4 cm−1 resolution. Reduction of Y122O• was performed by addition of HU (25 µL; final concentration, 50 mM) to 225 µL of the oxidized (NA, 13C-global, 1-13C-tyrosine, 2H4-tyrosine, 15N-tyrosine labeled) β2 samples. The data were acquired either immediately following (oxidized spectrum) or 8 min (reduced spectrum) following sample injection. As assessed by UV-Vis kinetics,27 this protocol results in 50% Y122O• reduction in all the samples. All data were processed using a Happ-Genzel apodization function, two levels of zero filling, and a Mertz phase correction. Each single beam set was ratioed to an open beam background, which consisted of the CaF2 windows of the flow cell without buffer or sample, and converted to absorption spectra. Individual absorption spectra were then subtracted to generate a reaction-induced difference spectrum (Y122O•–minus–Y122OH), see Figure 3A–C. Isotope-edited spectra (Figure 3D–E and Figure S2, Table 2), were calculated as NA or 12C–minus–13C; prior to subtraction, the difference spectra were corrected for tyrosyl radical content determined from UV spectra (for example, see Figure S3). Individual isotope-edited spectra were generated and these double difference spectra (not shown) consistently reproduced the differential features and frequencies that are displayed in the averaged isotope-edited spectra in Figure 3D and E.
Figure 3.

Reaction-induced FT-IR difference spectra associated with Y122O• reduction by HU, recorded at 20°C. The difference spectra, generated as Y122O•–minus–Y122OH, represent (A) NA, (B) global 13C (all carbons enriched), and (C) 1-13C tyrosine (YT amide linker only) labeled β2. The β2 concentrations were 250 µM in a buffer containing 5 mM Hepes, pD 7.6. HU was prepared at 50 mM concentration in the same buffer. Spectra are averages of (A) 20, (B) 8, and (C) 10 reactions. Isotope-edited FT-IR spectra, generated as 12C-minus- 13C, represent as (D) 12C– minus–13 C global (A-minus-B) and (E) 12C-minus– 13C tyrosine (A-minus-C). (F) represents a control double difference spectrum, which was generated by subtraction of one half of the data in (A) from the other half and division by . This control double difference spectrum is a negative control, which provides an estimate of the signal-to-noise and baseline fluctuations. Vibrational bands (in cm−1 ) discussed in the text are labeled in bold faced. The spectra are displayed with vertical offsets. The y-axis tick marks represent 1 × 10⁻⁴ absorbance units.
Table 2.
Assignments of Redox-Sensitive Amide Vibrational Frequencies in the β2 Subunit, Based on 13C Amide Labeling and DFT calculations
| ν(12CY )a | ν(13CY)a | ∆νa | Assignment |
|---|---|---|---|
| (–) 1662 | N.O.b | (–40)b | YOH Amide I |
| (+) 1653 | (–) 1614 | –39 | YO• Amide I |
| (+) 1547 | (–) 1537 | –10 | YO• Amide II |
| (–) 1537 | (+) 1529 | –8 | YOH Amide II |
Vibrational frequencies in cm−1, from Figures 3E and 6A.
Not observed; expected isotope shift to 1621 cm−1 (∆ = –41) from 13C global labeling in Figure 3B and D.
Computation
Y122OH is followed by a threonine (T123) in the primary sequence of E. coli β2. Density functional theory (DFT) computations were performed on the model dipeptide, YT. The dipeptide was examined in both singlet and radical forms of tyrosine and its isotopologues (NA, 13C1, and 2H4Y). The A/B/C (radical) and A/B (singlet) conformers are illustrated in Table 3 and were defined originally by Range.21 The B3LYP46–47 functional was selected for its broad applicability and proven success with the potential surface topography of radical species.48–49 Additional refinement through a dispersion term, –D2,50 addresses dispersion interactions through a simple sum over atom pairs model. The B3LYP-D2 method was paired with Dunning’s correlation consistent double- ζ basis set augmented with diffuse functions, aug-cc-pVDZ,51–52 and used throughout this study. Dipeptide species were fully optimized for both closed-shell and radical species. Geometry optimizations were subject to tight convergence criteria, with final rms forces of < 5 × 10⁻⁶ Hartrees/Bohr. DFT calculations employed a fine numerical integration grid with 70 radial shells around each (first-row) atom and 590 angular points in each shell for the geometry optimization stages (NWChem “fine” grid); frequency calculations utilized a finer grid with 99 radial shells around each atom to alleviate spurious imaginary vibrations (explicit {99,590} unpruned). Frequency analyses were performed within the harmonic approximation for each of the five stationary structures located. All optimizations and frequency analyses were performed with the NWChem 6.1 computational chemistry package.53
Table 3.
Dihedral Angles, Newman Projections, and Calculated Relative Energies of Model YT and Y-T dipeptides
| Singlet YT | |||||
|---|---|---|---|---|---|
| Conformera | Newmanb | Electronicc | E + EZPEc,d | Enthalpyc,e | Gibbsc,f |
| A ring: 99° bb: 173° |
 |
3.16 | 2.82 | 3.10 | 0.77 |
| B ring: 80° bb: –68° |
 |
0.00 | 0.00 | 0.00 | 0.00 |
| Radical Y•T | |||||
|
A ring: 101° bb: 172° |
 |
3.09 | 2.69 | 2.98 | 0.63 |
|
B ring: 80° bb: –69° |
 |
0.00 | 0.00 | 0.00 | 0.00 |
|
C ring: 89 bb: 61 |
 |
4.69 | 4.22 | 4.48 | 2.84 |
Conformers are defined by dihedral angles: ring (Cα-Cβ-C1□-C2□) and bb, backbone (C1-Cα-Cβ-C1□); in the nomenclature of reference 21, singlet A and B correspond to A′ and B′
Newman projections along the Cα-Cβ bond; the carbonyl carbon labeled with 12C/13C is shown in red.
Relative energies are in kcal/mol.
Zero-point corrected energy, kcal/mol.
Enthalpy at 298 K, kcal/mol.
Gibbs free energy at 298 K, kcal/mol.
Structural Refinement
Structural manipulation and refinement idealization of the 1.4 Å met β2 structure (PDB# 1MXR)14 were performed using PyMol version 1.3 (http://www.pymol.org) and REFMAC5.54
Results
In this study, HU was used as a reductant for Y122O•. The rate of Y122O• reduction was monitored selectively by UV spectrophotometry.27 The method and measured rate constants are presented in the Supporting Information. When comparing the reduction rate in H2O versus D2O (Table S1), the HU reaction exhibited a large SIE (15.1 ± 0.7 at 20°C and 16.7 ± 1.0 at 25°C), which was largely pL independent (at pL 6.6 (5 mM MES), SIE = 16.2 ± 1.4 and at pL 8.6 (5 mM TRIS), SIE = 13.3 ± 0.3; data collected at 20°C).
To understand the origin of this large isotope effect, a proton inventory was conducted (Figure 2). The proton inventory, a plot of reaction rate constant versus the mole fraction of solvent deuterium oxide, determines the number of protons transferred in the rate limiting step of the reaction.40 The rate constants were determined (Table S1) in various H2O:D2O mixtures, and the data were fit with several models, according to the equations and values in Table 1. These models included a single proton transfer (red line), a many proton transfer (green line), and a two proton transfer expression with equivalent SIE values (blue); these models did not fit the data. The data also did not fit a hypercurvature (gray) plot, which represents a reactant state model. However, a two proton model, in which one isotope effect is 11.9 and another is 1.4 (Figure 2, black line), was a satisfactory fit given the standard deviations. It should be noted that other, more complex models may also explain the data and cannot be excluded.
Figure 3A presents the reaction-induced FT-IR spectrum associated with reduction of Y122O• with HU in NA (12C) samples. A subset of vibrational bands in the 1650 cm–1 region may originate from peptide amide bonds that undergo a change in force constant when redox reactions occur at Y122.27 Vibrational bands originating from displacements of this amide bond, amide I (C=O stretch, ∼1650 cm−1) and amide II (CN stretch/NH bend, ∼1550 cm−1), are expected to downshift with incorporation of the 13C isotope into the amide bond. As a control, we show the effects of global 13C labeling (90%) in Figure 3B, which downshifts all vibrational bands that involve carbon displacement. To test the effect of PCET on the Y122-T123 amide bond, β2 samples were prepared using the 13C1 isotopolog of tyrosine (see Figure 3C). Isotope incorporation at β2 tyrosines is expected to be 90%.44
To isolate bands sensitive to C1 tyrosine isotopic labeling, a double difference, isotope-edited spectrum was constructed, 12C–minus–13C (illustrated in Figure 1C). To appear in this spectrum, bands must respond to tyrosyl radical reduction and also be sensitive to incorporation of the 13C isotope. In Figure 3D and E, amide I bands from the NA Y122O• state are positive; amide I vibrational bands from the 13C labeled Y122O• state are negative. Amide bands associated with the singlet state, Y122OH, are reversed in sign: NA negative; 13C labeled positive (see Table 2). As shown in Figure 3E, the tyrosine-specific isotope-edited spectrum exhibits bands in the amide I and II spectral regions. In the amide I region, the 12C bands at (–) 1662 cm−1 in the singlet state and 1653 cm−1 in the radical state are attributed to the Y122-T123 carbonyl. The (–) 1614 cm−1 band originates from the 13C labeled isotopologue in the radical state. An isotope shift of (–) 1662 cm−1 to (+) 1621 cm−1 is expected, based on the global 13C enrichment (Figure 3B and D). This frequency is not observed for the tyrosine specific label (Figure 3E) due to the expected low intensity of the signal from the 13C isotopologue (see ref 28, for example). Recently, we used double tyrosine/aspartate label to show that D84 amide I vibrations also contribute to the difference spectrum and overlap the tyrosine amide I frequencies.28
The observation of 1650 and 1550 cm−1 bands in this 13C YT amide isotope-edited spectrum (Figure 3E) demonstrates that Y122O• PCET reactions alter the force constant of the Y122-T123 amide bond. As a control, we labeled the S121-Y122 linkage with 15N (Figure S2). The amide II region of this isotope-edited spectrum is not responsive to incorporation of this isotope, suggesting that the local conformational change does not affect the S121-Y122 bond, but only the Y122-T123 bond.
We hypothesized that the change in Y122-T123 force constant, observed in the isotope-edited spectrum, is due to a redox-linked rotation of the phenolic ring. To test this idea, electronic structure calculations, incorporating dispersion forces55 were used to predict vibrational frequencies for the singlet and radical state of the dipeptide model depicted in Figure 4. Two conformers, A/A and B/B (singlet/radical), differing by the tyrosine ring and backbone dihedral angles (see Newman projects in Table 3), were considered for each redox state. Conformer C was also considered for the radical state. Conformer D, as described in ref 21, was unstable for our YT model. The B/B conformers are predicted to be the lowest energy conformers of the singlet and radical states, respectively (Tables 3 and 4). Calculations on various models of tyrosine, with one example containing a charged carboxylate as presented in reference 21, suggested that the nature of the model had a significant influence on the energetic ordering of the conformers and on the ring and CO vibrational frequencies (Table 4). Therefore, the calculations reported here were conducted on an improved model, lacking this charged group and containing the amide linkage. The relative zero-point corrected energies (E + EZPV) for A/B and A/B/C conformers for our YT model were calculated as 2.8/0.0 and 2.7/0.0/4.2 kcal/mol (Table 3). Although the electronic energies of B/B conformers are significantly lower, the overall free energies, which include entropic contributions, show that the A and B conformers are comparable in the singlet form and the A and B conformers are comparable in the radical form (Table 3).
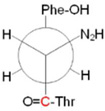
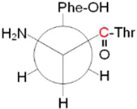
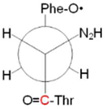
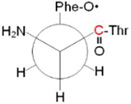
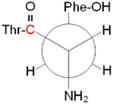
Figure 4.

Structures of the singlet and radical dipeptide (YT) models employed for electronic structure calculations (A), with tyrosine carbons numbered. The carbonyl carbon, enriched with 13C isotope, is designated by the red asterisks. The Newman projections of the relevant conformers are shown in Table 3. (B–F) shows the simulated DFT B3LYP-D/aug-cc-pVDZ) infrared spectra for the singlet (YOH) and radical (YO) forms of the YT dipeptide model. The data were generated for the (B) YOH conformer A, (C) YOH conformer B, (D) YO• conformer A, (E) YO• conformer B, and (F) YO• conformer C. The black and red spectra are predicted for the 12C and 13C isotopologs, respectively. Gaussian lineshapes were generated from the computed frequencies and amplitudes (sticks).
Table 4.
Calculated Vibrational Frequencies and Energies for Tyrosine Models and Conformers
| Singlet | |||||||||
|---|---|---|---|---|---|---|---|---|---|
| Dispersion forces included |
Y7a (CO) | Y8a (ring) | Electronica | Gibbsa | |||||
| A | B | A | B | A | B | A | B | ||
|
bRange (Y-COO–) |
No | 1258 | 1260 | 1654 | 1655 | 0.1 | 0.0 | NRg | NRg |
| cY-COO– | No | 1251 | 1251 | 1651 | 1653 | 0.1 | 0.0 | 0.0 | 1.5 |
| dY-COO– | Yes | 1249 | 1250 | 1650 | 1653 | 1.8 | 0.0 | 1.9 | 0.0 |
| eY-COOH | Yes | 1247 | 1252 | 1652 | 1654 | 2.5 | 0.0 | 1.2 | 0.0 |
| fYT | Yes | 1275 | 1275 | 1656 | 1652 | 3.2 | 0.0 | 0.8 | 0.0 |
| Radical | |||||||||
| Dispersion forces included |
Y7a (CO) | Y8a (ring) | Electronica | Gibbsa | |||||
| A | B | A | B | A | B | A | B | ||
|
bRange (Y-COO–) |
No | 1530 | 1521 | 1614 | 1610 | 0.0 | 2.5 | NRg | NRg |
| acY-COO– | No | 1513 | 1505 | 1610 | 1605 | 0.0 | 2.3 | 0.0 | 2.9 |
| dY-COO– | Yes | 1512 | 1503 | 1608 | 1604 | 0.0 | 0.7 | 0.0 | 1.6 |
| eY-COOH | Yes | 1480 | 1478 | 1602 | 1602 | 2.8 | 0.0 | 2.5 | 0.0 |
| fYT | Yes | 1489 | 1489 | 1598 | 1597 | 3.1 | 0.0 | 0.6 | 0.0 |
Electronic and Gibbs free energies at 298 K in kcal/mol relative to most stable conformer; the estimated error is ± 1 kcal/mol (see for example, refs 76–78).
From reference21, with computed results for Y-COO– with B3LYP/6-31++G(d,p).
From this work, with computed results for Y-COO– at Range21 geometries with B3LYP/aug-cc-pVDZ.
From this work, with computed results for Y-COO– at Range21 geometries with B3LYP-D2/aug-cc-pVDZ including dispersion forces.
From this work, computed results for Y-COOH based on Range geometries with B3LYP-D2/aug-cc-pVDZ including dispersion forces.
From this work, computed results for dipeptide YT with B3LYP-D2/aug-cc-pVDZ including dispersion forces.
NR, Not reported.
The computed vibrational frequencies for the rotameric states in NA and 13C labeled dipeptide models are depicted as simulated FT-IR spectra in Figure 4B–F and listed in Table S2. The atomic displacements for selected normal modes are shown in Table S3. As presented in Figure 4, the amide I and II vibrational bands of the radical and singlet dipeptide model exhibited conformation dependence. The calculated frequencies differed from experimental frequencies by approximately 80 cm–1 and <10 cm–1, respectively. The difference in the quality of theory prediction is attributed to the significant anharmonicity of stretching vibrations versus the harmonic approximation employed for the DFT study, though an influence from the protein environment cannot be excluded.
Simulated reaction-induced FT-IR spectra were constructed for the possibilities, A (radical)→A (singlet), B→B, A→B, B→A, and C→A (Figure 5). These simulated spectra show these five possibilities (compare Figure 5A – E) are distinguishable by the pattern and sign of the bands in the difference spectra. Comparison of experimental (Figure 6A) and simulated data (Figure 5) shows that the pattern of bands in the amide II (1550 cm−1) region matches either B→A or A→A pattern (Figure 5D and A, respectively). The other predicted transitions do not have the same positive-negative differential feature. Of these two explanations, the only possibility with the correct pattern of signs (negative, positive) in the amide I region is D, the B→A transition. Thus, the overall intensity pattern in the amide I and II regions are diagnostic for the B→A redox-linked rotation. The isotope shifts also provide strong support for a redox-linked B radical to A singlet conformer change. This can be observed using the comparison shown in Figure 6, in which the experimental isotope-edited spectrum (Figure 6A) is compared to simulated isotope-edited spectra. As shown, only B-A (Figure 6B) has the correct pattern of signs in the both amide I and II regions (compare to C-A, Figure 6C and B-B, Figure 6D). This comparison assigns the (–) 1662 and (+) 1653 cm−1 bands in Figure 3E and 6A to the Y122-T123 amide I CO vibrational band (Table 2). The significant frequency downshift is due to the conformational change between the radical and singlet states (Table S2).
Figure 5.

Simulated reaction-induced FT-IR spectra for the YT dipeptide model. Difference spectra were calculated as radical YO• minus singlet YOH (Figure 5). The data are computed as (A) A–minus–A, (B) B–minus–B, (C) A–minus–B, (D) B–minus–A, and (E) C–minus–A. The italics refer to radical conformational state; plain text refers to the singlet conformational state.
Figure 6.

Comparison of experimental and simulated isotope-edited, reaction-induced FT-IR spectra. (A) is from experimental FT-IR data of β2 and reproduced from Figure 3E. Simulated (YT model) isotope-edited spectra in (B–E), calculated as 12C–minus–13C, are generated from 12C (Figure 5) and 13C difference spectra for (B) B minus A, (C) A minus A, (D) C minus A, and (E) B minus B. The blue and red shaded areas (with arrows) denote the isotope shifts for the radical (red) and singlet (blue) states. The 13C isotope shifts, designated by ∆, are in cm−1 and denoted with arrows. In (A), the 13C shift of (–) 1662 cm−1 is not resolved, but is expected to have a ∼40 cm−1 downshift (see dashed line), based on the 13C global label (see Figures 3B and D). The italics refer to radical conformational state; plain text refers to the singlet conformational state.
To assess the impact of this conformational change, we used REFMAC554 to refine the 1.4 Å met β2 structure14 (Figure 1A). In the met structure, which represents singlet Y122OH, the tyrosine is in the A conformer (Figure 7A, pink). Further refinement of the X-ray structure14 with REFMAC5 led to no significant change (Figure 7A, silver). To model the radical Y122O• state after the predicted ring and backbone dihedral angle change, the ring position was altered in PyMol and the structure was refined with REFMAC5 (Figure 7A). This procedure suggests that the B to A conformational change translates the phenolic oxygen of Y122O• 7 Å from D84, a diferric cluster ligand (see Figure 7A and Figure S4). This translation will break the hydrogen bond, predicted to link Y122OH and D84 in the met β2 structure14 (Figure 1 and 7A). As observed in Figure 7, this model of the Y122OH to Y122O• PCET reaction preserves the local nonbonding interactions between the tyrosine aromatic ring, amide group, and threonine side chain of the targeted dipeptide (compare Figure 7A and B). We propose that these local interactions are important in defining the vibrational frequencies and isotope shifts of the Y122 amide I mode.
Figure 7.

Comparison of the structures for the singlet and radical states of Y122 in β2 (A) and the YT dipeptide model (B). In (A), structural refinements of the 1.4 Å met β2 (Y122OH) form (top), obtained from X-ray crystal analysis (PDB 1MXR),14and radical (Y122O•) form (bottom). The radical form was modeled as the B conformer, predicted by the model dihedral angles, and is presented in gray. Distances (in Ångstroms) between Y122 and D84 are shown in green. For the singlet (top), the dihedral angles of the A conformer were also structurally refined; deviations from the met crystal structure are highlighted in pink. For Y122O• (bottom), the ring dihedral angles predicted previously from experimental16,63 or calculated64 hyperfine coupling constants are shown in green and purple, respectively. The structures in (B) are derived from DFT calculations on the model dipeptides.
Discussion
Tyrosyl radicals are formed as intermediaries in long distance electron transfer reactions in high potential enzymatic reactions.56 These reactions involve quantum tunneling between the redox active sites. Electron transfer over long distances (>10 Å) requires multistep tunneling or hopping in which the redox active amino acid serves an intermediary electron donor and acceptor. Such electron hopping mechanisms can accelerate the rate of electron transfer processes into biologically relevant time regimes. For example, in photosystem II, YZ is oxidized on the nanosecond by light-induced charge separation and is reduced on the microsecond to millisecond by the Mn4CaO5 cluster.57 Photosystem II contains another redox active tyrosine, YD, with a lower midpoint potential and a much longer lifetime, compared to YZ.2 The factors that control the lifetimes and energetics of these redox intermediaries are not understood.
Y122 in RNR provides an excellent model system for studies of tyrosyl radical reactivity, because formation of the catalytically active quaternary complex has a dramatic effect on Y122O• lifetime in RNR. Here, we identify a potential trigger for changes in stability and reactivity as a redox-linked rotation of the phenolic ring. Our results agree qualitatively with previous EPR studies of Y122O• in single crystals of β2 and with PELDOR experiments on frozen samples, in which it was concluded that the radical Y122O• orientation is different from the orientation of singlet Y122OH.14,18
In our data, labeling of the Y122 amide group downshifts only a portion of the 1650 cm−1 intensity in the reaction-induced FT-IR spectrum. This is due, in part, to an overlapping contribution from the D84 amide group in this region, as assessed by experiments on 4-13C labeled aspartate samples.28 The D84 amide group contributes to the spectrum due to coupling between the C=O and carboxylate side chain, which experience redox-induced frequency shift changes.28 Other residues ligating the iron cluster may also contribute due to redox-coupled hydrogen-bonding or ligation changes. The identity of these groups is of interest and under investigation.
In proteins, transition dipole coupling of peptide carbonyls, which strongly influences the amide I vibration, is responsible for the correlation between the amide I frequency and secondary structure (reviewed in 58–59). The data presented here suggest that the redox-induced perturbation lifts this dipole-mediated coupling and that one of the contributors to the amide I band is the Y122-T123 linkage. The frequencies of the amide I band, assigned here to Y122-T123, are 1662 cm−1 for the singlet and 1653 cm−1 for the radical state. These frequencies are in the range of amide I frequencies typically reported for buried helices (α or 310) in proteins.31 Our calculations predict that radical formation alone has only a small effect on amide vibrational bands. However, shifting from the B/B to A/A conformer is predicted to weaken the amide bond, resulting in a 13–20 cm−1 downshift. The frequency of the amide I bond can also be influenced by through-bond coupling, hydrogen-bonding, and Stark effects.31 The fact that our unsolvated dipeptide model of β2 gave a reasonable prediction of the rotation-induced change in amide frequency is interesting and suggests that local structural effects, such as through space interactions between the amide, aromatic ring, and threonine OH group, play a role in determination of amide vibrational frequencies. We have used the idea that local interactions are determinant in building our model.
The results of these DFT calculations on the dipeptide model show that the B (radical) and B (singlet) conformers are the lowest electronic energy conformations. This is consistent with previous theoretical60 and experimental61 results. Previous DFT calculations,21 at a more approximate level of theory, on tyrosine and tyrosyl radical models containing a deprotonated, anionic carboxylate, placed the B conformer at higher energy, compared to A (Table 3). To explain this difference, we performed calculations on models of tyrosine and tyrosyl radical at various levels of theory. We are therefore able to account for this difference in the ordering of the B/A conformational states as due to the presence of the charged carboxylate in some of the previous tyrosine/tyrosyl radical models. The YT dipeptide model employed here lacks this charged group and is thus an appropriate model for β2. Also, without the charged carboxylate, the previously observed sensitivity of ring and CO vibrational frequencies to conformation is not observed in our theoretical treatment. These results show the importance of electrostatics in the determination of the energies and frequencies of the tyrosyl radical, in agreement with the suggestions of ref 62.
Based on our calculations, the B→A conformational change for Y122O• to Y122OH is predicted to convert the most stable conformational state of the radical to the next highest electronic energy state of the singlet. However, the overall relative free energies (Table 3) for the B/B and A/A conformers are nearly equivalent. Unlike Y122O•, which is not hydrogen-bonded,16 Y122OH is hydrogen-bonded to D84 (Figure 1A and 7A, ref 14). This additional hydrogen bond could provide significant stabilization of the singlet state, and therefore the energetic consequences of the transition are difficult to predict without a more detailed theoretical model of the environment of Y122OH/Y122O•. Thus, the change from B conformer in the radical state to A conformer in the singlet state may be energetically neutral.
In Figure 7A and S4, we modeled the B→A conformer change on the X-ray structure of β2. As the model of the singlet A state, we started with the high resolution structure of the met state, containing Y122OH and a diferric cluster.14 The X-ray coordinates demonstrate that Y122OH is in the A conformational state, as also defined by the FT-IR results reported here. In our model, the B to A conformational change is predicted to increase the distance between Y122 and D84 from 3.4 Å (singlet) to 7.2 Å in the radical state (Figure 7A and S4). Our previous work used the vibrational frequencies of tyrosinate-based models as predictors;3,21 this previous theoretical model did not contain an amide bond. Amide frequencies are expected to be the most sensitive to conformation. Because the interpretation of the FT-IR spectra is now based on ab initio calculations of a dipeptide, these results are an important advance in the interpretation of the spectrum. Note that the current model does not include a significant rearrangement of the Y122 peptide carbonyl group (Figure 1B).
Previous magnetic resonance studies14,18 have also provided evidence for a translation of the phenolic oxygen (see Figure 1B, pink). Our interpretation was informed by this previous work. However, the predicted size of the predicted displacement from D84 in the EPR study is somewhat smaller (∼4 versus 7.2 Å). This small change may not be significant and may be due to the use of cryogenic conditions in the EPR experiments, as compared to the 20°C temperature employed here, which probes dynamics in solution. However, it should be noted that our refined structure (Figure 7A and S4) resulted in a predicted center-of-mass distance between Y122O• pairs (chains A and B) of 32 Å, consistent with the PELDOR analysis.17 Also, it cannot be excluded that structural heterogeneity is the cause of the small difference in distance between that reported here and in the EPR experiments.
In earlier magnetic resonance studies,16,63 the ring-β methylene proton angle was estimated as 30°, although theoretical calculations64 later estimated the value to be smaller. The corresponding ring dihedral angles (Cα-Cβ-C1’-C2’) from these EPR studies are predicted as 60 and 30°, respectively. These values are within the range of possible angles for the radical B conformer, as can be seen from examining the potential energy surfaces presented in ref 21. Therefore, both of these EPR-derived ring-β methylene angles are consistent with our model for Y122O• (see Figure 7). While EPR is sensitive to the angle between the p orbital and the strongly coupled beta methylene protons, EPR is not as sensitive to conformation at the amide bond. Thus, FT-IR and EPR spectroscopies provide a complimentary approach to determine tyrosyl radical conformation and both FT-IR and EPR experiments are in agreement that redox changes at Y122O• alter hydrogen-bonding with the diferric cluster in the isolated β2 subunit.
The reduction of Y122O• by HU is associated with a large solvent isotope effect. The proton inventory provides an explanation of this effect and suggests that two proton transfer reactions are rate limiting in the one electron reduction reaction. To fit the model, one limiting proton transfer was associated with a large isotope effect of 11.9 and the other with a small isotope effect of 1.4. The proton transfer associated with the large isotope effect is attributed to HU oxidation. In x-ray irradiated hydroxyurea, the initial decay rates, assessed with EPR spectroscopy, of the resulting radical pairs exhibited an average temperature-dependent, solvent deuterium isotope effect of 13.65 This decay reaction has been attributed to hydrogen atom transfer,66 from the hydroxyl group of neighboring HU molecules. The β2 proton transfer associated with the small isotope effect (1.4) is attributed to an additional, partial proton transfer (or hydrogen-bonding change), which is coupled with Y122O• reduction by HU. Recently, reaction-induced FT-IR studies, using aspartate isotopic labeling, provided evidence for a redox-linked hydrogen-bonding change at D84, a ligand to the iron cluster.28 Small solvent isotope effects of this magnitude (<3) have previously been attributed to catalytic hydrogen-bonded, proton bridges (see ref 67–69 and refs therein). Therefore, the observation of two coupled proton transfers in the proton inventory is intriguing and suggests rate-limiting, redox-linked hydrogen bonding-changes in the diferric cluster,28 although other explanations cannot be excluded.
Taken together, these results support a redox-linked change in ring and dihedral angle for the phenolic ring of Y122O•, which is accompanied with additional hydrogen-bonding changes at the iron cluster (Figure 1B, green). These dynamics may provide control over the PCET reactions in the Y122O• -diferric cofactor.
Summary
Tyrosyl radicals have extraordinary oxidizing power. Many biological processes harness this high potential reaction to mediate long-distance PCET reactions. Conformational dynamics, which occur on a variety of time scales,70–71 can regulate these reactions and control enzyme catalysis. Here, we provide evidence for redox-linked changes to the conformation of the ribonucleotide reductase β2 tyrosyl radical. These changes are predicted to modulate the hydrogen-bonding network in the Y122O•-diferric cofactor.28 Translation of the phenolic oxygen of Y122O• may be a factor in controlling PCET reactions between the diferric cluster and the tyrosyl radical. This work implies a regulatory role for conformational dynamics coupled to PCET reactions in β2. Redox-coupled protein dynamics may also play a role in photosystem II and other proteins, which contain redox active amino acids. For example, photolysis-induced amide I bands have been observed in tyrosine-containing pentapeptides and dipeptides, even at low temperature.72–73 Further, a reversible redox-linked conformational switch has been modeled in a photosystem II inspired peptide maquette.74 Vibrational spectroscopy, coupled with theoretical approaches and isotopic labeling, provides an incisive method to define these protein dynamics in solution.
Supplementary Material
Acknowledgment
Supported by NIH GM43273 to B.A.B. and NSF CHE-1011360 to C.D.S. The authors thank Prof. Raquel Lieberman for assistance with the structural refinement program, Mr. R. Atlee Watson for assistance with the kinetic measurements, and Prof. JoAnne Stubbe for helpful discussions.
Abbreviations
- DFT
density functional theory
- FT-IR
Fourier transform infrared
- HU
hydroxyurea
- PCET
proton coupled electron transfer
- RNR
ribonucleotide reductase
Footnotes
Supporting Information. Tables S1-S3 and Figures S1-S4. This material is available free of charge via the Internet at http://pubs.acs.org.
References
- 1.Stubbe J, van der Donk WA. Protein Radicals in Enzyme Catalysis. Chem. Rev. 1998;98:705–762. doi: 10.1021/cr9400875. [DOI] [PubMed] [Google Scholar]
- 2.Barry BA. Proton Coupled Electron Transfer and Redox Active Tyrosines in Photosystem II. J. Photochem. Photobiol. B. 2011;104:60–71. doi: 10.1016/j.jphotobiol.2011.01.026. [DOI] [PMC free article] [PubMed] [Google Scholar]
- 3.Barry BA, Chen J, Keough J, Jenson D, Offenbacher A, Pagba C. Proton-Coupled Electron Transfer and Redox-Active Tyrosines: Structure and Function of the Tyrosyl Radicals in Ribonucleotide Reductase and Photosystem II. J. Phys. Chem. Lett. 2012;3:543–554. doi: 10.1021/jz2014117. [DOI] [PMC free article] [PubMed] [Google Scholar]
- 4.Dixon WT, Murphy D. Determination of the Acidity Constants of Some Phenol Radical Cations by Means of Electron Spin Resonance. J. Chem. Soc. Faraday Trans. 2. 1976;72:1221–1230. [Google Scholar]
- 5.Sealy RC, Harman L, West PR, Mason RP. The Electron Spin Resonance Spectrum of the Tyrosyl Radical. J. Am. Chem. Soc. 1985;107:3401–3406. [Google Scholar]
- 6.Barry BA, Babcock GT. Tyrosyl Radicals are Involved in the Photosynthetic Oxygen-Evolving System. Proc. Natl. Acad. Sci. U.S.A. 1987;84:7099–7103. doi: 10.1073/pnas.84.20.7099. [DOI] [PMC free article] [PubMed] [Google Scholar]
- 7.Stubbe J, Riggs-Gelasco P. Harnessing Free Radicals: Formation and Function of the Tyrosyl Radical in Ribonucleotide Reductase. Trends Biochem. Sci. 1998;23:438–443. doi: 10.1016/s0968-0004(98)01296-1. [DOI] [PubMed] [Google Scholar]
- 8.Uhlin U, Eklund H. Structure of Ribonucleotide Reductase Protein R1. Nature. 1994;370:533–539. doi: 10.1038/370533a0. [DOI] [PubMed] [Google Scholar]
- 9.Stubbe J, Nocera DG, Yee C, Chang MS. Radical Initiation in the Class I Ribonucleotide Reductase: Long-Range Proton-Coupled Electron Transfer? Chem. Rev. 2003;103:2167–2201. doi: 10.1021/cr020421u. [DOI] [PubMed] [Google Scholar]
- 10.Seyedsayamdost MR, Yee CS, Reece SY, Nocera DG, Stubbe J. pH Rate Profiles of FnY356-R2s (n = 2, 3, 4) in Escherichia coli Ribonucleotide Reductase: Evidence that Y356 is a Redox-Active Amino Acid along the Radical Propagation Pathway. J. Am. Chem. Soc. 2006;128:1562–1568. doi: 10.1021/ja055927j. [DOI] [PubMed] [Google Scholar]
- 11.Minnihan EC, Seyedsayamdost MR, Uhlin U, Stubbe J. Kinetics of Radical Intermediate Formation and Deoxynucleotide Production in 3-Aminotyrosine-Substituted Escherichia coli Ribonucleotide Reductases. J. Am. Chem. Soc. 2011;133:9430–9440. doi: 10.1021/ja201640n. [DOI] [PMC free article] [PubMed] [Google Scholar]
- 12.Yokoyama K, Smith AA, Corzilius B, Griffin RG, Stubbe J. Equilibrium of Tyrosyl Radicals (Y356•, Y731•, Y730•) in the Radical Propagation Pathway of the Escherichia coli Ribonucleotide Reductase. J. Am. Chem. Soc. 2011;133:18420–18432. doi: 10.1021/ja207455k. [DOI] [PMC free article] [PubMed] [Google Scholar]
- 13.Ge J, Yu G, Ator MA, Stubbe J. Pre-Steady-State and Steady-State Kinetic Analysis of E. coli Class I Ribonucleotide Reductase. Biochemistry. 2003;42:10071–10083. doi: 10.1021/bi034374r. [DOI] [PubMed] [Google Scholar]
- 14.Högbom M, Galander M, Andersson M, Kolberg M, Hofbauer W, Lassmann G, Nordlund P, Lendzian F. Displacement of the Tyrosyl Radical Cofactor in Ribonucleotide Reductase Obtained by Single-Crystal High-Field EPR and 1.4-Å, X-ray Data. Proc. Natl. Acad. Sci. U.S.A. 2003;100:3209–3214. doi: 10.1073/pnas.0536684100. [DOI] [PMC free article] [PubMed] [Google Scholar]
- 15.Backes G, Sahlin M, Sjöberg BM, Loehr TM, Sanders-Loehr J. Raman spectroscopy of Ribonucleotide Reductase. Evidence for a Deprotonated Tyrosyl Radical and Photochemistry of the Binuclear Iron Center. Biochemistry. 1989;28:1923–1929. doi: 10.1021/bi00430a074. [DOI] [PubMed] [Google Scholar]
- 16.Bender CJ, Sahlin M, Babcock GT, Barry BA, Chandrashekar TK, Salowe SP, Stubbe J, Lindström B, Petersson L, Ehrenberg A, Sjöberg B-M. An ENDOR Study of the Tyrosyl Free Radical in Ribonucleotide Reductase from Escherichia coli . J. Am. Chem. Soc. 1989;111:8076–8083. [Google Scholar]
- 17.Bennati M, Weber A, Antonic J, Perlstein DL, Robblee J. Pulsed ELDOR Spectroscopy Measures the Distance between the Two Tyrosyl Radicals in the R2 Subunit of E. coli Ribonucleotide Reductase. J. Am. Chem. Soc. 2003;125:14988–14989. doi: 10.1021/ja0362095. [DOI] [PubMed] [Google Scholar]
- 18.Denysenkov VP, Prisner TF, Stubbe J, Bennati M. High-Field Pulsed Electron-Electron Double Resonance Spectrocopy to Determine the Orientation of the Tyrosyl Radicals in Ribonucleotide Reductase. Proc. Natl. Acad. Sci. U.S.A. 2006;103:13386–13390. doi: 10.1073/pnas.0605851103. [DOI] [PMC free article] [PubMed] [Google Scholar]
- 19.Offenbacher AR, Chen J, Barry BA. Perturbations of Aromatic Amino Acids are Associated with Iron Cluster Assembly in RNR. J. Am. Chem. Soc. 2011;133:6978–6988. doi: 10.1021/ja107918g. [DOI] [PMC free article] [PubMed] [Google Scholar]
- 20.Spanget-Larsen J, Gil M, Gorski A, Blake DM, Waluk J, Radziszewski JG. Vibrations of the Phenoxyl Radical. J. Am. Chem. Soc. 2001;123:11253–11261. doi: 10.1021/ja0113596. [DOI] [PubMed] [Google Scholar]
- 21.Range K, Ayala I, York D, Barry BA. Normal Modes of Redox-Active Tyrosine: Conformation Dependence and Comparison to Experiment. J. Phys. Chem. B. 2006;110:10970–10981. doi: 10.1021/jp061503f. [DOI] [PubMed] [Google Scholar]
- 22.Vogel R, Siebert F. Vibrational Spectroscopy as a Tool for Probing Protein Function. Curr. Opin. Chem. Biol. 2000;4:518–523. doi: 10.1016/s1367-5931(00)00125-3. [DOI] [PubMed] [Google Scholar]
- 23.Nyquist RM, Ataka K, Heberle J. The Molecular Mechanism of Membrane Proteins Probed by Evanescent Infrared Waves. ChemBioChem. 2004;5:431–436. doi: 10.1002/cbic.200300687. [DOI] [PubMed] [Google Scholar]
- 24.Kötting C, Gerwert K. Proteins in Action Monitored by Time-Resolved FTIR Spectroscopy. ChemPhysChem. 2005;6:881–888. doi: 10.1002/cphc.200400504. [DOI] [PubMed] [Google Scholar]
- 25.Siebert F, Hildebrandt P. Vibrational Spectroscopy in Life Science. Wiley-VCH: Weinheim; 2008. [Google Scholar]
- 26.Fahmy K, Wieidlich O, Engelhard M, Sigrist H, Siebert F. Aspartic Acid-212 of Bacteriorhodopsin is Ionized in the M and N Photocycle Intermediates: an FTIR Study of Specifically Carbon-13-Labeled Reconstituted Purple Membranes. Biochemistry. 1993;32:5862–5869. doi: 10.1021/bi00073a020. [DOI] [PubMed] [Google Scholar]
- 27.Offenbacher AR, Vassiliev IR, Seyedsayamdost MR, Stubbe J, Barry BA. Redox-Linked Structural Changes in Ribonucleotide Reductase. J. Am. Chem. Soc. 2009;131:7496–7497. doi: 10.1021/ja901908j. [DOI] [PMC free article] [PubMed] [Google Scholar]
- 28.Offenbacher AR, Minnihan EC, Stubbe J, Barry BA. Redox-Linked Changes to the Hydrogen-Bonding Network of Ribonucleotide Reductase β2. J Am Chem Soc. 2013 doi: 10.1021/ja3032949. [DOI] [PMC free article] [PubMed] [Google Scholar]
- 29.Torii H, Tasumi M. Ab Initio Molecular Orbital Study of the Amide I Vibrational Interactions Between the Peptide Groups in Di- and Tripeptides and Considerations on the Conformation of the Extended Helix. J. Raman Spectrosc. 1998;29:81–86. [Google Scholar]
- 30.Hayashi T, Mukamel S. Vibrational-Exciton Couplings for the Amide I, II, III, and A Modes of Peptides. J. Phys. Chem. B. 2007;111:11032–11046. doi: 10.1021/jp070369b. [DOI] [PubMed] [Google Scholar]
- 31.Barth A, Zscherp C. What Vibrations Tell Us About Proteins. Q. Rev. Biophys. 2002;35:369–430. doi: 10.1017/s0033583502003815. [DOI] [PubMed] [Google Scholar]
- 32.Hauser K, Engelhard M, Friedman N, Sheves M, Siebert F. Interpretation of Amide I Difference Bands Observed during Protein Reactions Using Sited-Directed Isotopically Labeled Bacteriorhodopsin as a Model System. J. Phys. Chem. A. 2002;106:3553–3559. [Google Scholar]
- 33.Saban N, Bujak M. Hydroxyurea and Hydroxamic Acid Derivatives as Antitumor Drugs. Cancer Chemother. Pharmacol. 2009;64:213–221. doi: 10.1007/s00280-009-0991-z. [DOI] [PubMed] [Google Scholar]
- 34.Sneeden JL, Loeb LA. Mutations in the R2 Subunit of Ribonucleotide Reductase That Confer Resitance to Hydroxyurea. J. Biol. Chem. 2004;279:40723–40728. doi: 10.1074/jbc.M402699200. [DOI] [PubMed] [Google Scholar]
- 35.Lassmann G, Thelander L, Gräslund A. EPR Stopped-Flow Studies of the Reaction of the Tyrosyl Radical of Protein R2 from Ribonucleotide Reductase with Hydroxyurea. Biochem. Biophys. Res. Commun. 1992;188:879–887. doi: 10.1016/0006-291x(92)91138-g. [DOI] [PubMed] [Google Scholar]
- 36.Karlsson M, Sahlin M, Sjöberg B-M. Escherichia coli Ribonucleotide Reductase. Radical Susceptibility to Hydroxyurea is Dependent on the Regulatory State of the Enzyme. J. Biol. Chem. 1992;267:12622–12626. [PubMed] [Google Scholar]
- 37.Gerez C, Fontecave M. Reduction of the Small Subunit of Escherichia coli Ribonucleotide Reductase by Hydrazines and Hydroxylamines. Biochemistry. 1992;31:780–786. doi: 10.1021/bi00118a020. [DOI] [PubMed] [Google Scholar]
- 38.Pötsch S, Sahlin M, Langelier Y, Gräslund A. Reduction of the Tyrosyl Radical and the Iron Center in Protein R2 of Ribonucleotide Reductase from Mouse, Herpes Simplex Virus and E. coli by p-Alkoxyphenols. FEBS Lett. 1995;374:95–99. doi: 10.1016/0014-5793(95)01082-p. [DOI] [PubMed] [Google Scholar]
- 39.Schowen KB, Schowen RL. Solvent Isotope Effects on Enzyme Systems. Methods Enzymol. 1982;87:551–606. [PubMed] [Google Scholar]
- 40.Venkatasubban KS, Schowen RL. The Proton Inventory Technique. CRC Crit. Rev. Biochem. 1984;17:1–44. doi: 10.3109/10409238409110268. [DOI] [PubMed] [Google Scholar]
- 41.Jenson DL, Barry BA. Proton-Coupled Electron Transfer in Photosystem II: Proton Inventory of a Redox Active Tyrosine. J. Am. Chem. Soc. 2009;131:10567–10573. doi: 10.1021/ja902896e. [DOI] [PMC free article] [PubMed] [Google Scholar]
- 42.Hutchison RS, Betts SD, Yocum CF, Barry BA. Conformational Changes in the Extrinsic Manganese Stabilizing Protein Can Occur upon Binding to the Photosystem II Reaction Center: An Isotope Editing and FT-IR Study. Biochemistry. 1998;37:5643–5653. doi: 10.1021/bi9724467. [DOI] [PubMed] [Google Scholar]
- 43.Sachs RK, Halverson KM, Barry BA. Specific Isotope Labeling and Photooxidation-Linked Structural Changes in the Manganese-Stabilizing Subunit of Photosystem II. J. Biol. Chem. 2003;278:44222–44229. doi: 10.1074/jbc.M307148200. [DOI] [PubMed] [Google Scholar]
- 44.Seyedsayamdost MR, Reece SY, Nocera DG, Stubbe J. Mono-, Di-, Tri-, and Tetra-Substituted Fluorotyrosines: New Probes for Enzymes that use Tyrosyl Radicals in Catalysis. J. Am. Chem. Soc. 2006;128:1569–1579. doi: 10.1021/ja055926r. [DOI] [PubMed] [Google Scholar]
- 45.Bollinger JM, Jr., Tong WH, Ravi N, Huynh BH, Edmondson DE, Stubbe J. Use of Rapid Kinetics Methods to Study the Assembly of the Differic-Tyrosyl Radical Cofactor of E. coli Ribonucleotide Reductase. Methods Enzymol. 1995;258:278–303. doi: 10.1016/0076-6879(95)58052-2. [DOI] [PubMed] [Google Scholar]
- 46.Becke AD. A New Mixing of Hartree-Fock and Local Density-Functional Theories. J. Chem. Phys. 1993;98:1372–1377. [Google Scholar]
- 47.Stephens PJ, Devlin FJ, Chabalowski CF, Frisch M. J. Ab Initio Calculation of Vibrational Absorption and Circular Dichroism Spectra Using Density Functional Force Fields. J. Phys. Chem. 1994;98:11623–11627. [Google Scholar]
- 48.Byrd EFC, Sherrill CD, Head-Gordon M. The Theoretical Prediction of Molecular Radical Species: A Systematic Study of Equilibrium Geometries and Harmonic Vibrational Frequencies. J. Phys. Chem. A. 2001;105:9736–9747. [Google Scholar]
- 49.Tentscher PR, Arey JS. Geometries and Vibrational Frequencies of Small Radicals: Performance of Coupled Cluster and More Approximate Methods. J. Chem. Theory Comput. 2012;8:2165–2179. doi: 10.1021/ct300194x. [DOI] [PubMed] [Google Scholar]
- 50.Grimme S. Semiempirical GGA-Type Density Functional Constructed with a Long-Range Dispersion Correction. J. Comput. Chem. 2006;27:1787–1799. doi: 10.1002/jcc.20495. [DOI] [PubMed] [Google Scholar]
- 51.Dunning TH. Jr Gaussian Basis Sets for Use in Correlated Molecular Calculations. I. The Atoms Boron through neon and Hydrogen. J. Chem. Phys. 1989;90:1007–1023. [Google Scholar]
- 52.Kendall RA, Dunning TH, Jr., Harrison RJ. Electron Affinities of the First-Row Atoms Revisited. Systematic Basis Sets and Wave Functions. J. Chem. Phys. 1992;96:6796–6806. [Google Scholar]
- 53.Valiev M, Bylaska EJ, Govind N, Kowalski K, Staatsma TP, van Dam HJJ, Wang D, Nieplocha J, Apra E, Windus TL, de Jong WA. NWChem: A Comprehensive and Scalable Open-Source Solution for Large Scale Molecular Simulations. Comput. Phys. Commun. 2010;181:1477–1489. [Google Scholar]
- 54.Murshudov GN, Skubák P, Lebedev AA, Pannu NS, Steiner RA, Nicholls RA, Winn MD, Long F, Vagin AA. REFMAC5 for the Refinement of Macromolecular Crystal Structures. Acta Crystallogr. 2011;D67:355–367. doi: 10.1107/S0907444911001314. [DOI] [PMC free article] [PubMed] [Google Scholar]
- 55.Burns LA, Vázquez-Mayagoitia Á, Sumpter BG, Sherrill CD. Density-Functional Approaches to Noncovalent Interactions: A Comparison of Dispersion Corrections (DFT-D), Exchange-Hole Dipole Moment (XDM) Theory, and Specialized Functions. J. Chem. Phys. 2011;134 doi: 10.1063/1.3545971. 084107:084101-084125. [DOI] [PubMed] [Google Scholar]
- 56.Dempsey JL, Winkler JR, Gray HB. Proton-Coupled Electron Flow in Protein Redox Machines. Chem. Rev. 2010;110:7024–7039. doi: 10.1021/cr100182b. [DOI] [PMC free article] [PubMed] [Google Scholar]
- 57.Dekker JP, Plijter JJ, Ouwehand L, van Gorkom HJ. Kinetics of the Manganese Redox Transitions in the Oxygen-Evolving Apparatus of Photosynthesis. Biochim. Biophys. Acta. 1984;767:176–179. [Google Scholar]
- 58.Jackson M, Mantsch HH. The Use and Misuse of FTIR Spectroscopy in the Determination of Protein Structure. Crit. Rev. Biochem. Mol. Biol. 1995;30:95–120. doi: 10.3109/10409239509085140. [DOI] [PubMed] [Google Scholar]
- 59.Barth A. Infrared Spectroscopy of Proteins. Biochim. Biophys. Acta. 2007;1767:1073–1101. doi: 10.1016/j.bbabio.2007.06.004. [DOI] [PubMed] [Google Scholar]
- 60.Qin Y, Wheeler RA. Similarities and Differences Between Phenoxyl and Tyrosine Phenoxyl Radical Structures, Vibrational Frequencies, and Spin Densities. J. Am. Chem. Soc. 1995;117:6083–6092. [Google Scholar]
- 61.McCracken J, Vassiliev IR, Yang E-C, Range K, Barry BA. ESEEM Studies of Peptide Nitrogen Hyperfine Coupling in Tyrosyl Radicals and Model Peptides. J. Phys. Chem. B. 2007;111:6586–6592. doi: 10.1021/jp071402x. [DOI] [PMC free article] [PubMed] [Google Scholar]
- 62.Tomter AB, Zoppellaro G, Schmitzberger F, Andersen NH, Barra A-L, Engman H, Nordlund P, Andersson KK. HF-EPR, Raman, UV/Vis Light Spectroscopic, and DFT Studies of the Ribonucleotide Reductase R2 Tyrosyl Radical from Epstein-Barr Virus. PLoS One. 2011;6:e25022. doi: 10.1371/journal.pone.0025022. [DOI] [PMC free article] [PubMed] [Google Scholar]
- 63.Sjöberg B-M, Reichard R, Gräslund A, Ehrenberg A. The Tyrosine Free Radical in Ribonucleotide Reductase from Escherichia coli . J. Biol. Chem. 1978;253:6863–6865. [PubMed] [Google Scholar]
- 64.Himo F, Gräslund A, Eriksson LA. Density Functional Calculations on Model Tyrosyl Radicals. Biophys. J. 1997;72:1556–1567. doi: 10.1016/S0006-3495(97)78803-9. [DOI] [PMC free article] [PubMed] [Google Scholar]
- 65.Haven Y, Williams RC, Hamrick PJ, Shields H. Hydrogendeuterium Isotope Effect in the Decay of Radical Pairs in Xray Irradiated Hydroxyurea. J. Chem. Phys. 1974;60:127–132. [Google Scholar]
- 66.Kurita Y, Kashiwagi M. Electron Spin Resonance Study of Radical Pairs Trapped in X-Irradiated Single Crystals of Dimethylglyoxime-O,O-d2, Glyoxime, and Methylglyoxime at Liquid-Nitrogen Temperature. J. Chem. Phys. 1966;44:1727–1728. [Google Scholar]
- 67.Schowen KB, Limbach H-H, Denisov GS, Schowen RL. Hydrogen Bonds and Proton Transfer in General-Catalytic Transition-State Stabilization in Enzyme Catalysis. Biochim. Biophys. Acta. 2000;1458:43–62. doi: 10.1016/s0005-2728(00)00059-1. [DOI] [PubMed] [Google Scholar]
- 68.Hershcovitz YF, Gilboa R, Reiland V, Shoham G, Shoham Y. Catalytic Mechanism of SGAP, a Double-Zinc Amniopeptidase from Streptomyces griseus . FEBS J. 2007;274:3864–3876. doi: 10.1111/j.1742-4658.2007.05912.x. [DOI] [PubMed] [Google Scholar]
- 69.Kondo MY, Okamoto DN, Santos JAN, Juliano MA, Oda K, Pillai B, James MNG, Juliano L, Gouvea IE. Studies on the Catalytic Mechanism of a Glutamic Peptidase. J. Biol. Chem. 2010;285:21437–21445. doi: 10.1074/jbc.M110.122432. [DOI] [PMC free article] [PubMed] [Google Scholar]
- 70.Boehr DD, McElheney D, Dyson HJ, Wright PE. The Dynamic Energy Landscape of Dihydrofolate Reductase Catalysis. Science. 2006;313:1639–1642. doi: 10.1126/science.1130258. [DOI] [PubMed] [Google Scholar]
- 71.Nashine VC, Hammes-Schiffer S, Benkovic SJ. Coupled Motions in Enzyme Catalysis. Curr. Opin. Chem. Biol. 2010;14:644–651. doi: 10.1016/j.cbpa.2010.07.020. [DOI] [PMC free article] [PubMed] [Google Scholar]
- 72.Ayala I, Range K, York D, Barry BA. Spectroscopic Properties of Tyrosyl Radicals in Dipeptides. J. Am. Chem. Soc. 2002;124:5496–5505. doi: 10.1021/ja0164327. [DOI] [PubMed] [Google Scholar]
- 73.Vassiliev IR, Offenbacher AR, Barry BA. Redox-Active Tyrosine Residues in Pentapeptides. J. Phys. Chem. B. 2005;109:23077–23085. doi: 10.1021/jp054159f. [DOI] [PubMed] [Google Scholar]
- 74.Pagba CV, Barry BA. Redox-Induced Conformational Switching in Photosytem-II-Inspired Biomimetic Peptides: A UV Resonance Raman Study. J. Phys. Chem. B. 2012;116:10590–10599. doi: 10.1021/jp303607b. [DOI] [PubMed] [Google Scholar]
- 75.Quinn DM, Sutton LD. Enzyme Mechanism from Isotope Effects. Boca Raton, FL: CRC Press, Inc; 1991. [Google Scholar]
- 76.Tian SX. Conformation Effects on the Electronic Structures of b-Alanine. J. Phys. Chem. A. 2006;110:3961–3966. doi: 10.1021/jp054702s. [DOI] [PubMed] [Google Scholar]
- 77.Dobrowolski JC, Jamróz MH, Kolos R, Rode JE, Sadlej J. IR Low-Temerature Matrix and Ab Initio Study on b-Alanine Conformers. ChemPhysChem. 2008;9:2042–2051. doi: 10.1002/cphc.200800383. [DOI] [PubMed] [Google Scholar]
- 78.Dobrowolski JC, Jamróz MH, Kolos R, Rode JE, Cyrański MK, Sadlej J. IR Low-Temperature Matrix, X-Ray and Ab Initio Study on L-Isoserine Conformations. Phys. Chem. Chem. Phys. 2010;12:10818–10830. doi: 10.1039/c0cp00016g. [DOI] [PubMed] [Google Scholar]
Associated Data
This section collects any data citations, data availability statements, or supplementary materials included in this article.