

Abstract
The medial parietal, posterior cingulate and retrospenial cortices collectively constitute a region of cortex referred to as the posteromedial cortices (PMC). In an effort to shed light on the neuroanatomical organization of the PMC, we undertook a study to identify and analyze the thalamocortical connections of these cortices. Retrograde tracer injections were placed in the posterior cingulate (PCC), retrosplenial (RSC), medial parietal cortices (MPC) and posterior cingulate sulcus (PCS), and the labeling patterns within the thalamus were analyzed. Three afferent projection patterns were observed to the PMC from the thalamus: a PCC/RSC pattern that involved the anterior thalamic nuclei, a MPC pattern that involved the lateral posterior and pulvinar nuclei and a PCS pattern that involved the ventral thalamic nuclei. Additionally, a shared pattern of projections from the anterior intralaminar nuclei (AILN) and posterior thalamic nuclei (PTN) to all cortical regions of the PMC was observed. Our findings suggest that distinct regions within the PMC are supplied by distinctive patterns of thalamic input, but also share common projections from intralaminar and posterior thalamic sources. In addition, we relate our findings to functional abnormalities in aging and dementia, and address a domain-like pattern of thalamocortical labeling of the PMC that is drawn selectively and collectively from multiple thalamic nuclei.
Keywords: thalamus, medial parietal cortex, posterior cingulate cortex, retrosplenial cortex, precuneus, neuroanatomy
Introduction
The posteromedial cortices (PMC) are comprised of several cytoarchitectural regions, namely Brodmann's areas 23 and 31 of the posterior cingulate cortex (PCC), areas 29 and 30 of the retrosplenial cortex (RSC), and area 7m or PGm of the medial parietal cortex (MPC) and their various subdivisions (Pandya and Seltzer, 1982; Vogt, 1993; Vogt et al., 1995; Vogt et al., 2005). Areas PEci and PEc occupy the posterior portion of the cingulate sulcus and the superior medial parietal region, respectively. In both human and non-human primates, these cortical areas have a similar topography (Fig. 1). However, in cynomolgus and rhesus monkeys, the non-human primates examined in this study, the RSC is confined mostly to the upper bank of the callosal sulcus, whereas in the human, this cortical region extends onto the medial surface, dorsal and posterior to the splenium of the corpus callosum (Braak, 1979; Brodmann, 1909). Individual regions within the PMC are known to have varying cortical connections (Cavada and Goldman-Rakic, 1989a; Cavada and Goldman-Rakic, 1989b; Kobayashi and Amaral, 2003; Leichnetz, 2001; Morecraft et al., 2004; Morecraft et al., 1993; Morris et al., 1999; Pandya and Seltzer, 1982; Yukie, 1995) and subcortical connections (Baleydier and Mauguiere, 1985; Baleydier and Mauguiere, 1987; Leichnetz, 2001; Schmahmann and Pandya, 1990; Shibata and Yukie, 2003; Vogt and Pandya, 1987; Vogt et al., 1979; Yeterian and Pandya, 1985; Yeterian and Pandya, 1988; Yeterian and Pandya, 1993; Yeterian and Pandya, 1995; Yeterian and Pandya, 1997). However, this knowledge is drawn largely from investigations with diverse aims and not from experimental designs aimed at specifically exposing the thalamocortical afferents to the PMC in detail.
Figure 1.
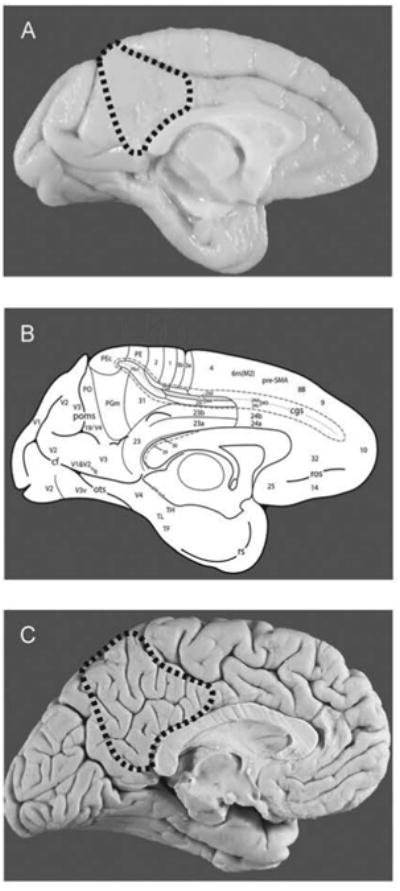
(A) Medial view of macaque brain with PMC outlined with a dashed line. (B) cytoarchitectural map depicting cortical areas of the medial surface (Morecraft et al.). (C) Medial view of human brain with PMC outlined with a dashed line.
Multiple studies have consistently highlighted the PMC as an area of interest in a wide array of neural processes (Andreasen et al., 1995; Cavanna and Trimble, 2006; Damasio, 1999; Gusnard and Raichle, 2001; Lundstrom et al., 2005; Lundstrom et al., 2003; Malouin et al., 2003; Mazoyer et al., 2001; Ogiso et al., 2000; Shannon and Buckner, 2004; Vogt and Laureys, 2005; Wagner et al., 2005), and the PMC has the highest level of glucose metabolism at rest when compared to other areas of the cerebral cortex (Gusnard and Raichle, 2001). These functional aspects of the PMC make this region particularly interesting for studies of aging and dementia. Although it has been known for some time that regional decreases in cerebral blood flow exist in both aging and dementia, recent data suggests that the loss of cerebral metabolism and cortical dysfunction may be localized to specific cortical regions including the PMC(Buckner et al., 2000; Buckner et al., 2005; Lustig et al., 2003; Matsuda, 2001)
To understand the possible functional correlates of the PMC, it is necessary to understand the differential and similar neural connectivity of the encompassed cortical areas. We recently presented a comprehensive report of the neuroanatomical connections of the PMC with the entire brain including cortical and subcortical connections (Parvizi et al., 2006). This current study was designed to specifically address the details of the thalamic inputs to the PMC.
The thalamus is considered to act in concert with the cerebral cortex forming the substrates of cognitive function. Therefore, we reasoned that thalamocortical projections might reveal both unique patterns related to cytoarchitectural differentiation, but commonality as well that might contribute to the functional observations of the PMC. We recognize that these connections may represent only one aspect of a neural system or systems that contribute to the functions attributed to the PMC. Nevertheless, an investigation using contemporary retrograde tracers to examine thalamocortical connectivity represents an important endeavor to further elucidate the extrinsic neural systems directly influencing the PMC. The aim of this investigation was to examine the projections from the thalamus to individual cortical areas of the PMC. This paper analyzes three distinct thalamocortical projection patterns and also addresses the mutual projections found within each pattern.
Materials and Methods
Seven cynomolgus (Macaca fascicularis) and three rhesus (Macaca mulatta) monkeys of both genders, weighing between 2.0 and 6.1 kg were utilized for this study (Table 1). The Institutional Animal Care and Use Committees at The University of Iowa and The University of South Dakota approved all experimental and surgical protocols. These also conformed fully to AAALAC accreditation requirements and to the Society for Neuroscience Policies on the Use of Animals in Neuroscience Research. Some of the cortical and subcortical connections of several of the experimental cases in this study have previously been described (Morecraft et al., 2004; Morecraft et al., 2007; Parvizi et al., 2006). Cases 1, 2, 3, 7 and 8 correspond to Cases M2-FB-23a/b, M3-FB-30/23a, M1-FB-31, M5-FB-7m, and M7-FB-7m, respectively in Parvizi et al. (Parvizi et al., 2006), Case 4 corresponds to Case 7 in Morecraft et al. (Morecraft et al., 2007), and Cases 4, 5 and 6 correspond to Cases 4, 3 and 7, respectively in Morecraft et al. (Morecraft et al., 2004).
Table 1.
Summary table of the individual monkey cases and procedural information.
| Case # | 1 | 2 | 3 | 4 | 5 | 6 | 7 | 8 | 9 | 10 |
|---|---|---|---|---|---|---|---|---|---|---|
| Sex | M | F | F | F | M | F | M | M | M | M |
| Weight | 2.0 kg | 2.0 kg | 4.5 kg | 5.2 kg | 6.1 kg | 4.5 kg | 3.8 kg | 4.6 kg | 4.2 kg | 3.2 kg |
| Hemisphere | R | R | L | L | R | L | R | R | R | L |
| Injection Site | 23a/b | 30/23a | 31 | 23c | PEci | 31/PGm | PGm | PGm | PEc | PEc |
| Tracer Used | FB | FB | FB | FB | FB | DY | FB | FB | FB | FB |
| Amount of Tracer | 0.5 μl | 0.5 μl | 0.8 μl | 0.3 μl | 0.3 μl | 0.3 μl | 0.7 μl | 0.6 μl | 0.7 μl | 0.3 μl |
Surgical Procedures
Each monkey was immobilized with an intramuscular injection of Ketamine (10 mg/kg) before being anesthetized with an intravenous injection of Nembutal (30 mg/kg/hr) or isofluorane inhalation (1.25 - 2% total volume) the latter of which required intubation and assisted mechanical respiration. The target injection sites were identified by proximity to the corpus callosum and in position relative to the visible hemispheric sulcal patterns. All injections were viewed with a surgical microscope to ensure pial penetration between cortical arterioles and veins.
Injections were made with a 31-gauge stainless steel needle attached to a 1μL Hamilton microsyringe. Retrograde tracers, either Fast blue (FB) (Dr. Illing Plastics GMBH, Breuburg, Germany) or Diamidino yellow (DY) (Sigma-Aldrich Corporation, St. Louis, MO) were injected at a cortical depth of approximately 2 mm by pressure injection. Each injection consisted of 0.25 – 0.7 μl of a 3 – 4% in 0.1M phosphate buffered (PB) saline solution of the chosen tracer. Digital pictures were taken to document the cerebral topography in direct relation to the injection site and to assist in accurate reconstruction of the location of the injection during data analysis.
After a survival period of 24 – 27 days, each monkey was anesthetized with Nembutal (50 mg/kg), and perfused transcardially with 1 L 0.9% saline, followed by 2 L of cold 4% paraformaldehyde in 0.1 M PB (pH 7.4). The brain was flushed with 1 L of 10% sucrose in 0.1 M PB, followed by 1 L of 30% sucrose in 0.1M PB. After removal, the brain was placed in 30% sucrose in 0.1 M PB and allowed to equilibrate for 2 – 4 days for cryoprotection at 4° C. The remaining meninges were then removed and the brain was photographed from all angles, including the medial surface, to ascertain sulcal and gyral patterns, the plane of sectioning and surface location of the injection sites when visible.
Tissue Processing
After removal, the brain hemispheres and brainstem were frozen with dry ice and cut in the coronal plane at a thickness of 50 μm using a sliding microtome. The sections were divided into 10 series, which effectively spaced each section used for fluorescent visualization of the afferent connections by 500 μm. These sections were mounted on gelatin-subbed slides, dried overnight, coverslipped with DPX neutral mounting medium (Aldrich Chemicals), and stored in a refrigerator (4° C) in light tight boxes. The remaining series were used for cytoarchitectural and immunohistochemical analyses.
Data Analysis
At the injection site, the outline of the section and anatomical landmarks such as sulci, ventricles, and gray and white matter interface were traced using dark-field illumination that delineates the internal structures. The following guidelines were used to estimate the effective uptake area for each injection site. The site of tracer deposit was defined as the small necrotic zone of tissue at the tip of the cannula penetration where tracer remained during the post-surgical survival period (Conde, 1987). Under fluorescence illumination, the FB deposit appeared yellow or orange, whereas for DY it appeared intensely yellow clearly demarcating these areas from surrounding tissue (Fig. 2). The cortical injection site and region of tracer deposit was verified using adjacent Nissl sections stained with thionin (Fig. 2) as well as homotypical commissural retrograde labeling in the contralateral hemisphere.
Figure 2.

Epi-fluorescent photomicrographs of coronal sections through the injection sites of all 10 cases with adjacent Nissl or Neu-N stains. (A) Case 1 – FB injection involving areas 23a/b, (A′) Nissl stained section of the injection site in Case 1; (B) Case 2 – FB injection involving area 30/23a, (B′) Nissl stained section of the injection site in Case 2; (C) FB injection of Area 31, (C′) Nissl stained section of the injection site in Case 3; (D) Case 4 – FB injection involving area 23c, (D′) Nissl stained section of the injection site in Case 4; (E) Case 5 – FB injection involving area PEci, (E′) Nissl stained section of the injection site in Case 5; (F) Case 6 – DY injection involving area 31, (F′) Nissl stained section of the injection site in Case 6; (G and H) Cases 7 and 8 – FB injections involving area PGm, (G′ and H′), Neu-N and Nissl stained sections of the injection sites in Cases 7 and 8, respectively; (I and J) Cases 9 and 10 – FB injections involving area PEc (I′ and J′), Nissl stained section of the injection sites in Cases 9 and 10. White arrows identify the injection site in epi-fluorescent photographs (A – J), while black arrows represent cytoarchitectonic boundaries in Nissl and Neu-N stained sections (A′ – J′). Scale bar = 2.0 mm.
Retrograde fluorescent material was studied using epi-fluorescent illumination and viewed under a Nikon Optiphot-2 Microscope. The cell bodies of FB labeled cells appear bright and the nuclei of DY labeled cells appear yellow or white when viewed under fluorescent illumination (Fig. 3). Data from all tissue sections were collected with the use of the 2003 updated Neurolucida System (MicroBrightField, Inc., Colchester, VT). This software was loaded onto a Micron Millenia LXA computer connected to a Nikon Optiphot-2 microscope with a motorized stage controller and Optronics DEI 750 digital camera.
Figure 3.

(A) Representative Neurolucida charting of Case 2 (top left) with injection in RSC illustrating retrogradely labeled neurons in the anterior nuclei accompanied by a fluorescent image (top right) showing the dense, continuous patch of fast blue labeled neurons which characterized the projection pattern in this major thalamic region (see white arrows). (B) Representative Neurolucida charting of Case 7 (bottom left) with an injection in area PGm illustrating retrogradely labeled cells dispersed in LP, LD, CL, and MD accompanied by a fluorescent image (bottom right) showing fast blue labeled neurons (see white arrows). Note the domain of labels cells transcends the cytoarchitectural boundaries. The red box in the Neurolucida chartings represents the area depicted in each fluorescent image. The white dotted line identifies thalamic nuclear boundaries.
In each thalamic section, the outline of the thalamus, distinct thalamic nuclei, as well as anatomical landmarks such as ventricles, were charted using dark-field illumination. After anatomical outlining, fluorescence illumination was used to determine the location of labeled cells within each nuclei of the thalamus (Fig. 3) and they were marked for the descriptive purpose of this report. Every tissue section through the thalamus was charted in this manner and representative sections were chosen to illustrate the topographical distribution of labeling patterns. Line drawings were made to demonstrate labeling patterns (Figures 4 – 13) using Adobe Photoshop 7.0 and Adobe Illustrator CS (Abode Systems International).
Figure 4.

Diagram illustrating Case 1 placement of retrograde tracer (black oval) in area 23a/b on (A) medial surface and (B) coronal section. (C – H) represent Neurolucida chartings of coronal sections through the thalamus from anterior to posterior demonstrating the distribution of labeled neurons. Note the dorsal pattern of labeling observed throughout the thalamus from AV to dorsal Pul. The numbers in parentheses, shown here and in Figures 5 – 13, correlate to the approximate coronal level reported by Olszewski (1952).
Figure 13.

Diagram illustrating Case 10 placement of retrograde tracer (black oval) in area PEc on (A) medial surface and (B) coronal section. (C – H) represent Neurolucida chartings of coronal sections through the thalamus from anterior to posterior demonstrating the distribution of labeled neurons. Note the lack of labeling in the anterior nuclei and the heavy labeling observed in the posterior nuclei.
Cytoarchitectural Analysis
Initially, each cortical injection site was approximated using sulcal patterns and various brain atlases and later verified using adjacent Nissl sections stained with thionin. Cytoarchitectural classifications of the cortical areas within the PMC have previously been established (Brodmann, 1909; Cavada and Goldman-Rakic, 1989a; Kobayashi and Amaral, 2003; Morecraft et al., 2004; Pandya and Seltzer, 1982; Vogt, 1976; Vogt and Pandya, 1987; von Bonin and Bailey, 1947). In addition to basic cytoarchitectural analyses, adjacent sections stained for calcium-binding proteins aided in unique phenotypic identification of cortical injections sites (Nimchinsky et al., 1997). Briefly, each cortical area was identified using the following morphological characteristics:
Posterior Cingulate Cortex
Area 23 is positioned between the cingulate and callosal sulci occupying a large portion of the posterior portion of the crown of the cingulate gyrus (Vogt et al., 1995). There are several current perspectives on the organization of this brain region, and for this project, we adopted the view of area 23 being formed by four major subdivisions. They include areas 23a, 23b, 23c and 23d, which extend dorsally from the ventral part of the cingulate gyrus into the lower bank and fundus of the cingulate sulcus, respectively. Area 23a is proisocortex with a thin layer IIIc and medium sized pyramidal cells in layer Va and is primarily separated from 23b by a less conspicuous layer II with a subtle transition to layer III. Area 23b has a more discernable layer II with conspicuous large pyramidal neurons in layer IIIc and Va. Area 23c occupies the ventral bank of the cingulate sulcus and is distinguished from area 23b by a denser layer IV and thinning of deep layer VI. Area 23d lines the fundus of the sulcus and its laminar definition is less distinct than adjacent areas where infragranular layer V thickness diminishes significantly.
Area 31 is located on the medial surface between parietal area PGm and area 23. Area 31 is often positioned between the cingulate and splenial sulci at the coronal level above the splenium. It occupies the zone between the PCC and MPC and has well-differentiated layers II, III and IV (Vogt et al., 2005). For example, it has a particularly broad layer III with large, scattered pyramidal neurons in layer IIIc (Morecraft et al., 2004) which distinguishes this area from area PGm.
Retrosplenial cortex
Areas 29 and 30 are identified by their position on the upper bank of the callosal sulcus, lateral and medial, respectively. A transition from allocortex of the indusiem griseum to proisocortex of area 30 occurs within the retrosplenial cortices (Kobayashi and Amaral, 2000; Sanides, 1972; Vogt, 1976). Area 29 is periallocortex and has an undifferentiated layer III that is difficult to distinguish from layers II and IV, and is divided into medial and lateral segments (Ding et al., 2003; Vogt, 1976; Vogt et al., 1995). In contrast, layer III can be distinguished from layer IV in dysgranular area 30, although distinction from layer II is poorly defined. Area 30 abuts area 23a of the PCC; the transition is recognized by the subtle differentiation of layer II, and the presence of medium sized pyramidal neurons in layer Va in 23a.
Medial parietal cortex
Medial areas PEc, PEci, and PGm, are easily distinguished from PCC and RSC by their indisputable isocortical cytoarchitecture. Area PEc is the caudal division of area PE extending over the dorsal apex of the hemisphere onto its medial surface. This area has a poorly differentiated layer II, large pyramidal neurons in layer IIIc, and medium sized pyramidal cells in layer Va (Pandya and Seltzer, 1982). Area PEci is the extension of area PE into the caudal cingulate sulcus and is distinguished by less conspicuous pyramidal neurons in layer IIIc when compared to other parietal areas (Pandya and Seltzer, 1982), and a noticeable thinning of cortex throughout the extent of the cingulate sulcus. Area PGm occupies a large part of the medial surface of the parietal lobe, and hence, much of what is known as the precuneus. It has conspicuous layers II and IV and a noticeable thinning of cortex as a whole. It is identified by larger pyramidal neurons in layer III and well-developed layers V and VI (Pandya and Seltzer, 1982), characteristic features of parietal cortex.
Delineation of Thalamic Nuclei
Thalamic nuclei were defined using a combination of Jones (1985), Olszewski (1952) and Paxinos et al., (2000). The anterior thalamic nuclei refer to, anterior dorsal (AD), anterior medial (AM), anterior ventral (AV) and lateral dorsal (LD) nuclei. The anterior intralaminar nuclei (AILN) include central medial (CeM), central lateral (CL), superior central lateral (CSL), which courses superior to the mediodorsal nucleus (MD) and the paracentral (PC) nuclei,. The ventral anterior (VA), ventral lateral (VL), dorsal caudal segment of VL (VLc), and the caudal and oral segments of the lateral ventral posterior (VPLc and VPLo) nuclei form the ventral thalamus. MD and reuniens nuclei (Re) comprise the medial group of thalamic nuclei; MD is further subdivided into a caudal densocellular division (MDdc) and a lateral parvocellular division (MDpc). Posterior nuclei include the lateral posterior nucleus (LP) and the anterior, medial, and lateral divisions of the pulvinar (Pul.A, Pul.L, and Pul.M). Finally, the limitans-suprageniculate (Li/SG) and posterior (Po) nuclei collectively comprise the posterior thalamic complex (PTC).
Results
Thalamocortical connections from 10 cases of injections of FB or DY within the PMC were studied (Table 1). Cases were selected based on accuracy and precision of the injections and robust thalamic labeling. The injection depth in all cases presented was approximately 2mm, involving layers II – VI. Results are presented here in a progression from ventral and caudal PCC to dorsal and rostral MPC. Percentages listed in Table 2 and following each nucleus in the test, represent the estimated percentage of labeled cells within each nucleus as compared to the entire thalamus.
Table 2.
Summary of labeled cells in observed in the thalamus. Relative percentages of labeled cells are listed for each nucleus and for each group of nuclei (in bold). “----” represents no observed labeling. Note the relative percentage differences of observed labeling in the anterior nuclei in Cases 1 – 3, in the ventral nuclei in Cases 4 and 5 and in the posterior nuclei in Cases 6 – 10.
| Projection Pattern | PCC/RSC Pattern | PCS Pattern | MPC Pattern | ||||||||
|---|---|---|---|---|---|---|---|---|---|---|---|
| Case Number | 1 | 2 | 3 | 4 | 5 | 6 | 7 | 8 | 9 | 10 | |
| Injection Site | 23a/b | 30/23a | 31 | 23c | PEci | 31/PGm | PGm | PGm | PEc | PEc | |
| Anterior Nuclei | AD | ---- | 1.3% | ---- | ---- | ---- | ---- | ---- | ---- | ---- | ---- |
| AM | 3.2% | 10.6% | 1.4% | ---- | ---- | ---- | ---- | ---- | ---- | ---- | |
| AV | 8.4% | 16.1% | 4.4% | ---- | ---- | ---- | ---- | ---- | ---- | ---- | |
| LD | 5.7% | 21.9% | 5.4% | 2.5% | 1.7% | 2.5% | ---- | 2.3% | 0.9% | 1.0% | |
| Total | 17.2% | 50.0% | 11.2% | 2.5% | 1.7% | 2.5% | 0.0% | 2.3% | 0.9% | 1.0% | |
| Anterior Intralaminar Nuclei | CeM | 12.0% | 9.3% | 5.9% | 2.9% | 5.2% | 1.0% | 11.8% | 8.8% | 6.2% | 6.6% |
| CL | 7.2% | 4.0% | 2.5% | 2.8% | 1.7% | 5.5% | 0.7% | 5.9% | 4.8% | 2.8% | |
| CSL | 5.0% | ---- | 1.7% | ---- | 1.7% | ---- | ---- | 2.9% | 4.1% | ---- | |
| PC | 6.8% | 9.5% | 3.7% | 5.0% | 3.9% | 2.4% | 6.3% | 2.4% | 5.8% | 5.1% | |
| Total | 31.0% | 22.7% | 13.7% | 10.8% | 12.5% | 8.9% | 18.8% | 20.1% | 20.9% | 14.5% | |
| Ventral Nuclei | VA | ---- | ---- | 0.4% | 10.9% | 5.2% | ---- | ---- | ---- | ---- | ---- |
| VL | ---- | ---- | ---- | 9.9% | 5.0% | ---- | ---- | ---- | ---- | ---- | |
| VLc | 3.8% | 2.4% | 7.3% | 9.4% | 4.8% | 5.6% | 5.9% | 9.4% | 10.0% | 10.8% | |
| VPLc | ---- | ---- | ---- | 0.8% | 2.9% | ---- | ---- | ---- | ---- | ---- | |
| VPLo | ---- | ---- | ---- | 3.9% | 4.6% | ---- | ---- | ---- | ---- | ---- | |
| Total | 3.8% | 2.4% | 7.7% | 34.8% | 22.5% | 5.6% | 5.9% | 9.4% | 10.0% | 10.8% | |
| Medial Nuclei | MDdc | 7.2% | 3.2% | 1.7% | 2.7% | 4.9% | 8.2% | 3.1% | 8.0% | 3.3% | 2.2% |
| MDpc | 2.7% | ---- | 5.0% | 7.0% | 0.9% | 2.1% | ---- | 4.0% | ---- | ---- | |
| Re | 3.8% | ---- | ---- | ---- | 0.7% | ---- | ---- | 0.5% | ---- | ---- | |
| Total | 13.8% | 3.2% | 6.6% | 9.8% | 6.5% | 10.3% | 3.1% | 12.6% | 3.3% | 2.2% | |
| Posterior Nuclei | LP | 6.1% | 0.8% | 30.5% | 11.8% | 10.7% | 21.9% | 19.5% | 20.1% | 22.9% | 18.7% |
| Pul.A | 2.1% | 0.6% | 5.7% | 11.3% | 3.9% | 11.8% | 9.5% | 10.7% | 12.8% | 11.8% | |
| Pul.M | 13.6% | 7.9% | 7.4% | 9.1% | 8.5% | 8.2% | 5.9% | 8.0% | 10.6% | 12.2% | |
| Pul.L | 4.3% | 6.9% | 11.0% | 1.6% | 24.7% | 22.2% | 31.7% | 6.7% | 12.9% | 20.8% | |
| Total | 26.1% | 16.2% | 54.6% | 33.8% | 47.9% | 64.1% | 66.6% | 45.5% | 59.2% | 63.4% | |
| Posterior Thalamic Nuclei | Li/SG | 6.8% | 4.0% | 3.8% | 5.7% | 5.6% | 5.1% | 2.8% | 4.8% | 3.2% | 5.8% |
| Po | 1.4% | 1.6% | 2.4% | 2.7% | 3.4% | 3.5% | 2.8% | 5.4% | 2.5% | 2.3% | |
| Total | 8.1% | 5.6% | 6.1% | 8.4% | 9.0% | 8.7% | 5.6% | 10.2% | 5.7% | 8.1% | |
| Thalamus Total | 100% | 100% | 100% | 100% | 100% | 100% | 100% | 100% | 100% | 100% | |
Case 1 (IM 152)
In Case 1, a FB injection was located in the right posterior cingulate gyrus involving area 23. The site of tracer deposit was judged as confined to area 23a with slight infringement into area 23b (Fig. 4 A, B).
In the anterior portions of the thalamus, labeling was found in the anterior group of nuclei, including AM (3.2%), AV (8.4%) and LD (5.7%); however, AD contained no labeled neurons (Fig. 4 C – E). Retrograde labeling was also noted in AILN, including CeM (12.0%), CL (7.2%), CSL (5.0%) and PC (6.8%) (Fig. 4 C – E). The labeling in the anterior nuclei was near the border with the internal medullary lamina, thus making the labeling in AILN and the anterior nuclei a seemingly non-interrupted strip (Fig. 4 C). Anterior nuclear labeling was restricted to AV in more caudal sections, however, labeling in AILN continued through most of the anteroposterior extent of the thalamus including the more caudally positioned CSL (Fig. 4 F). Additionally, a few labeled cells were noted in Re (3.8%) (Fig. 4 D) and the most dorsal segments of VLc (3.8%) (Fig. 4 E, F).
In posterior portions of the thalamus, labeling was observed in the dorsal portion of LP (6.1%) (Fig. 4 G), Pul.A (2.1%), the dorsal and ventral portions of Pul.L (4.3%), and Pul.M (13.6%) (Fig. 4 H). MDpc (2.7%) (Fig. 4 G) and caudal segments of MDdc (7.2%) (Fig. 4 H) also contained labeled neurons. Labeling was present in PTC; including dense labeling in Li/SG (6.8%) and Po (1.4%) forming a dense strip of labeled cells along the thalamo-mesencephalic junction (Fig. 4 H). Overall, labeling in this case was evident in: the anterior nuclei, excluding AD, AILN, LP, dorsal portions of PTC and Pul (Fig. 4).
Case 2 (IM 153)
In Case 2, a FB injection was confined to cortex immediately posterior and dorsal to the splenium of the corpus callosum. The tracer deposit for this case was judged to involve primarily area 30 with a smaller portion of the uptake zone located in posterior area 23 (Fig. 5 A, B). Area 29, also of the RSC, was not within the injection uptake site.
Figure 5.

Diagram illustrating Case 2 placement of retrograde tracer (black oval) in area 30/23a on (A) medial surface and (B) coronal section. (C – H) represent Neurolucida chartings of coronal sections through the thalamus from anterior to posterior demonstrating the distribution of labeled neurons. Note the dorsal pattern of labeling observed throughout the thalamus from AV to dorsal Pul and the high density of labeling in the anterior nuclei.
Retrograde labeling was noted in all nuclei of the anterior thalamic group, including AD (1.3%), AM (10.6%), AV (16.1%) and LD (21.9%) (Fig. 5 C – G). In anterior portions of the thalamus, labeled cells formed a dense cluster encompassing many neurons of these nuclei (Fig. 5 C). Also, AILN, including CeM (9.3%), CL (4.0%) and PC (9.5%) contained labeled neurons (Fig. 5 C – G). Again, a dense labeling pattern existed between the AILN and the anterior nuclei that seemed to form a bridge between these structural subsectors, similar to Case 1. However, unlike Case 1 the majority of labeling was in the anterior nuclei. The labeling in AILN did not continue posteriorly as in Case 1, as it ceased when the anterior complex ended. Also, no labeled cells were found in CSL. A few labeled cells were scattered throughout VLc (2.4%) (Fig. 5 E, F).
Very few cells were found in LP (0.8%). A few labeled cells were identified in Pul.A (0.6%) and the superior segments of Pul.L (6.9%) and Pul.M (7.9%) (Fig. 5 H), although this cell group appeared to be continuous with labeling in LD. MDdc (3.2%) contained a few labeled cells in the very posterior and dorsal segments (Fig. 5 H). As in Case 1, PTC was intensely labeled on the thalamo-mesencephalic border, including labeling in both Li/SG (4.0%) and Po (1.6%) (Fig. 5 H). Overall, the pattern of labeling in this case was primarily restricted to the anterior and dorsal segments of the thalamus (Fig. 5).
Case 3 (IM 150)
Case 3 had a FB injection into the posterior aspect of the PCC, located between the ascending branch of the cingulate sulcus and the splenial sulcus (Fig. 6 A, B). Cytoarchitectural analysis placed the injection in area 31.
Figure 6.

Diagram illustrating Case 3 placement of retrograde tracer (black oval) in area 31 on (A) medial surface and (B) coronal section. (C – H) represent Neurolucida chartings of coronal sections through the thalamus from anterior to posterior demonstrating the distribution of labeled neurons. Note the dorsal pattern of labeling and the high density of labeling in posterior nuclei LP and Pul.
Labeled cells were observed in the anterior thalamic nuclei, including AM (1.4%), AV (4.4%) and LD (5.4%), but not AD (Fig. 6 C – F). These cells seemed to be located in specific regions of the nuclei and not distributed throughout their entirety as seen in Case 2. Labeling was present in AILN including CeM (5.9%), CL (2.5%), CSL (1.7%) and PC (3.7%) (Fig. 6 C – F). As in cases 1 and 2, it was difficult to distinguish clear borders between the anterior nuclei and AILN, as the labeled cells occupied both cytoarchitecturally determined nuclear territories, as well as the anatomical territory between the two. Labeling was also observed in the dorsal region of VLc (7.3%) (Fig. 6 E, F) and a small number of cells were found in VA (0.4%).
The retrograde labeling in VLc was continuous with labeled cells in LP (30.5%) and Pul.A (5.7%) forming a massive projection site in the dorsal posterior thalamic region (Fig. 6 F, G). This injection also yielded a unique pattern of labeling throughout the posterior part of the thalamus. Labeling in MD encompassed both MDdc (1.7%) and MDpc (5.0%) (Fig. 6 F – H). Furthermore, Pul.L (11.0%) and Pul.M (7.4%) displayed a number of labeled cells and labeling was also observed in PTC, i.e. Li/SG (3.8%) and Po (2.4%) (Fig. 6 G, H).
Case 4 (SDM 27)
In Case 4, a FB injection was placed in area 23c along the ventral bank of the cingulate sulcus. The estimated tracer deposit zone was approximately 2mm from the medial face of the interhemispheric fissure within the cingulate sulcus (Fig. 7 A, B).
Figure 7.

Diagram illustrating Case 4 placement of retrograde tracer (black oval) in area 23c on (A) medial surface and (B) coronal section. (C – H) represent Neurolucida chartings of coronal sections through the thalamus from anterior to posterior demonstrating the distribution of labeled neurons. Note the lateral pattern of labeling observed in VA, VL, and VPL.
No labeled neurons were observed within the confines of the anterior thalamic nuclei, with the exception of a few scattered cells in LD (2.5%) (Fig. 7 F). Labeled neurons were observed in AILN including CeM (2.9%), CL (2.8%) and PC (5.0%) (Fig. 7 C, D, and F). These cells were widely spaced and very sparse unlike the previous two cases. A new pattern of labeling revealed labeled neurons in the lateral segments of the VA (10.9%) and VL (9.9%) forming a crescent-shaped band that outlined the lateral boundaries of the nuclei in close proximity to the external medullary lamina (Fig. 7 C, D). A small cluster of labeled cells was also observed in the inferolateral segment of VPLo (3.9%) (Fig. 7 F) and a small number of cells were observed in VPLc (0.8%). Labeling was also observed in the dorsal region of VLc (9.4%).
LP (11.8%), MDdc (2.7%), MDpc (7.0%), Pul.A (11.3%) and Pul.L (1.6%) all had labeled cells (Fig. 7 F – H). PTC had a somewhat different pattern of labeling in that these cells formed a strip at the thalamo-mesencephalic border, occupying most of Li/SG (5.7%) and Po (2.7%). However, in contrast to Cases 1 and 2, the field of labeled cells expanded to include posterior segments of Pul.M (9.1%) (Fig. 7 H). In addition, this case demonstrated heavier labeling in posterior regions, LP, Pul.A and Pul.M, than seen in previous cases and as emphasized above, there was a noticeable absence of labeling from AM and AV (Fig. 7).
Case 5 (SDM 30)
In Case 5, a FB injection was placed on the ventral bank of the extreme caudal tip of the cingulate sulcus, corresponding to the rostral portion of PEci. The region of tracer deposit was restricted to the lower bank of the sulcus (Fig. 8 A, B). The pattern of labeling was very similar to that seen in Case 4 in which the injection was located in area 23c.
Figure 8.

Diagram illustrating Case 5 placement of retrograde tracer (black oval) in area PEci on (A) medial surface and (B) coronal section. (C – H) represent Neurolucida chartings of coronal sections through the thalamus from anterior to posterior demonstrating the distribution of labeled neurons. Note the lateral pattern of labeling that appears in VA, VL and VPL similar to the pattern observed in Case 4, figure 7.
No labeled cells were observed in the anterior thalamic nuclei, except for a few cells in the inferomedial LD (1.7%). Labeling was observed in AILN, including CeM (5.2%), CL (1.7%), CSL (1.7%) and PC (3.9%) (Fig. 8 C – F). As in Case 4, labeled cells were observed in the anterolateral segments of VA (5.2%) and VL (5.0%) nuclei forming a line that outlined the lateral subsector near the boundary of the external medullary lamina (Fig. 8 C, D). Labeled cells were also found in VLc (4.8%) and the superior and inferolateral portions of VPLc (2.9%) and VPLo (4.6%) (Fig. 8 D – F). A few cells were observed in Re (0.7%) (Fig. 8 C).
More posteriorly, labeled neurons in MDdc (4.9%) appeared to interdigitate with labeled cells in extreme posterior parts of CL due to the indistinct boundary between these two nuclei. These cells, together with labeled cells within CSL, and LD formed an ostensibly singular cluster of labeled cells (Fig. 8 E, F). A few labeled cells were also observed in MDpc (0.9%) (Fig. 8 G). Labeled cells were found in both LP (10.7%) and Pul.A (3.9%) (Fig. 8 E, F). Pul.L (24.7%) and Pul.M (8.5%) demonstrated a unique labeling pattern; the cells formed a tier-like configuration within the pulvinar nuclei in which there was an absence of labeling between the tiers (Fig. 8 G). A large number of labeled cells occupied the PTC, occupying both Li/SG (5.6%) and Po (3.4%). Again, these cells formed a strip that spread over the surface on the interface between the diencephalon and mesencephalon (Fig. 8 G).
Case 6 (SDM 29)
In Case 6, a DY injection was placed approximately 2mm inferior to the ascending ramus of the cingulate sulcus involving primarily dorsal area 31 with some tracer uptake in rostral PGm (Fig. 9 A, B). In most DY injections, the site of tracer deposit is more focused than that of FB (Conde, 1987), however, in this case, the deposit and uptake zone was comparable to FB injections.
Figure 9.

Diagram illustrating Case 6 placement of retrograde tracer (black oval) in area 31/PGm on (A) medial surface and (B) coronal section. (C – H) represent Neurolucida chartings of coronal sections through the thalamus from anterior to posterior demonstrating the distribution of labeled neurons. Note the lack of labeling in the anterior nuclei except LD.
No labeled cells were observed in the anterior thalamic nuclei, except some labeled cells were found in the inferolateral portion of LD (2.5%) (Fig. 9 D, E). As in other cases, labeling was observed in AILN, including CeM (1.0%), CL (5.5%) and PC (2.4%) (Fig. 9 C, F), although the density of cells was much less than noted in other injections used in this study, and no labeled cells were found in CSL. Labeled cells were noted in VLc (5.6%) (Fig. 9 D, E).
The labeled cells in LD and adjacent VLc formed a small, continuous cluster that crossed the architectonically delineated thalamic boundaries (Fig. 9 E). MDdc (8.2%) and MDpc (2.1%) showed a sparse pattern of labeling (Fig. 9 F, G). A heavy cluster of labeling in Pul.L (22.2%) and Pul.M (8.2%) seemed continuous with the labeled cells in LP (21.9%) (Fig. 9 F, G). As seen in all other cases, labeling was observed in PTC (Fig. 9 G), Li/SG (5.1%) and Po (3.5%). The overall results of this experiment showed that labeling was present in the AILN, LD, LP, MD, PTC and Pul (Fig. 9).
Case 7 (IM 155)
In Case 7, a FB injection was placed approximately 2 mm below the most posterior segment of the ascending ramus of the cingulate sulcus and slightly posterior to the injection location in Case 6, encompassing rostral PGm (Fig. 10 A, B). Labeling was similar to that seen in Case 6, with one major exception. In Case 7, no labeled cells were observed in LD as they were in Case 6.
Figure 10.

Diagram illustrating Case 7 placement of retrograde tracer (black oval) in area PGm on (A) medial surface and (B) coronal section. (C – H) represent Neurolucida chartings of coronal sections through the thalamus from anterior to posterior demonstrating the distribution of labeled neurons. Note the lack of labeling in the anterior nuclei with more considerable labeling in the posterior nuclei.
In anterior segments of the thalamus, no labeling was seen in any of the anterior thalamic nuclei, in contrast to Case 6, which had labeling in LD. AILN labeling was confined to the anterior regions of CeM (11.8%), CL (0.7%) and PC (6.3%) (Fig. 10 C, D) and no labeling was seen at more posterior levels. Occasional labeling was observed in the dorsal region of VLc (5.9%) (Fig. 10 D – F).
Very light labeling was observed in MDdc (3.1%) (Fig. 10 G). Labeled cells were observed in LP (19.5%) and Pul.A (9.5%) (Fig. 10 F, G), and a pattern of labeling like previous cases was seen in the PTC, in both Li/SG (2.8%) and Po (2.8%) (Fig. 10 H). Labeled cells were scattered throughout both Pul.L (31.7%) and Pul.M (5.9%) (Fig. 10 H). The injection site in Case 7 was slightly posterior to Case 6 and the absence of labeling in LD in this case highlights the connectional idiosyncrasies that exist for adjacent cortical areas.
Case 8 (IM 160)
In Case 8, FB was injected approximately 4mm below the ascending ramus of the cingulate sulcus in dorsal PGm. This injection was similar to Case 7, only slightly inferior (Fig. 11 A, B).
Figure 11.

Diagram illustrating Case 8 placement of retrograde tracer (black oval) in area PGm on (A) medial surface and (B) coronal section. (C – H) represent Neurolucida chartings of coronal sections through the thalamus from anterior to posterior demonstrating the distribution of labeled neurons. Note the lack of labeling in the anterior nuclei and the robust labeling in the posterior nuclei that crosses cytoarchitectural boundaries.
Anteriorly, no labeled cells were seen in any of the anterior nuclei, with the exception of a few labeled cells in the inferomedial (Fig. 11 E) and inferolateral portions of LD (2.3%) (Fig. 11 F). Labeled cells were present in AILN including, CeM (8.8%), CL (5.9%), CSL (2.9%) and PC (2.4%) (Fig. 11 C – G). As in Case 7, labeled cells were observed in the dorsal portion of VLc (9.4%) (Fig. 11 E, F). Also, a few labeled cells were observed in Re (0.5%), directly inferior to the labeled cell in CeM (Fig. 11 D).
A dense distribution of labeling occupied LP (20.1%) and Pul.A (10.7%) , which formed an arch in the posterior and dorsal part of the thalamus (Fig. 11 G). Labeled neurons were also located in MDdc (8.0%) and MDpc (4.0%), which formed a continuous population with the labeled cells in LP (Fig. 11 G, F). Labeled cells were present in PTC forming a projection pattern similar to that seen in all other cases (Fig. 11 H), Li/SG (4.8%) and Po (5.4%). Pul.L (6.7%) and Pul.M (8.0%) displayed a number of labeled cells that occupied both divisions of the nuclei (Fig. 11 H). Overall, the pattern of labeling in Case 8 was very similar to Case 7, different only in the relative amount of labeled cells observed in individual nuclei and a few labeled cells observed in the inferolateral portion of LD in Case 8.
Case 9 (IM 162)
In Case 9, FB was injected into the rostral segment of PEc on the dorsomedial surface. This cytoarchitectural region courses onto the dorsolateral crest of the hemisphere extending slightly in the lateral posterior parietal region. The zone of tracer deposit in this case was localized to a cortical territory posterior to the termination of the cingulate sulcus on the medial surface, approximately 2mm inferior to the dorsal convexity (Fig. 12 A, B).
Figure 12.

Diagram illustrating Case 9 placement of retrograde tracer (black oval) in area PEc on (A) medial surface and (B) coronal section. (C – H) represent Neurolucida chartings of coronal sections through the thalamus from anterior to posterior demonstrating the distribution of labeled neurons. Note the absence of labeling in the anterior nuclei and heavy labeling in the posterior nuclei.
There were no labeled cells in any of the anterior thalamic nuclei, except for a few cells in ventral LD (0.9%) (Fig. 12 E). As in other cases, labeled cells were observed in AILN, consisting of the CeM (6.2%), CL (4.8%) and PC (5.8%) (Fig. 12 C – G). In this case, there were many labeled cells in CSL (4.1%) as well (Fig. 12 E, F). A large number of cells were also observed in VLc (10.0%) (Fig. 12 E, F).
MDdc (3.3%) and LP (22.9%) contained labeled cells, and a few labeled cells were noted on the border of the ventrolateral portion of LD (Fig. 12 E – G). This cluster of cells appeared continuous with the labeled cells observed in VLc. Labeling was found in Pul.A (12.8%), Pul.L (12.9%), and Pul.M (10.6%) (Fig. 12 G, H). There were labeled cells present in PTC with a number of cells in Li/SG (3.2%) and Po (2.5%) (Fig. 12 H).
Case 10 (IM 163)
In Case 10, FB was injected into the very caudal segments of PEc on the dorsal surface (Fig. 13 A, B). This injection site was posterior and lateral to the injection site of Case 9 but the tracer deposit zone was still within cytoarchitectural area PEc as this cortical area occupies most of the caudal parietal lobe on both the medial and lateral surfaces. The thalamocortical inputs were similar to those seen in Case 9, with a few slight differences.
No labeling was observed in the anterior thalamic nuclei, with the exception of a few labeled cells that lined the ventral border of LD (1.0%) (Fig. 13 F). The AILN including CeM (6.6%), CL (2.8%) and PC (5.1%), contained labeled cells (Fig. 13 C – E). Labeled cells were observed in VLc (10.8%) (Fig. 13 E, F).
Labeling in MDdc (2.2%) was sparse and confined to the posterior centrolateral region (Fig. 13 H). Labeling was also noted in the PTC, both Li/SG (5.8%) and Po (2.3%) (Fig. 13 H). Labeling in LP (18.7%), Pul.A (11.8%), Pul.L (20.8%), and Pul.M (12.2%) was comparable to Case 9 in both location and number of labeled cells (Fig. 13 F – H). The pattern observed in Case 10 was very similar to Case 9, differing only in relative number of labeled cells in individual nuclei.
General Summary of Results
In each case, the pattern of connections demonstrated distinctive thalamocortical input to the different cytoarchitectural areas of the PMC. Comparatively, PCC and RSC received more projections from the anterior thalamic nuclei, including AV and AM, whereas MPC received input predominately from more posterior nuclei, such as LP and Pul. Cortex within the posterior region of the cingulate sulcus, including areas 23c and PEci, received input from anterolateral segments of VA, VL and VPL. Despite the differences in thalamic projections to all cortical areas analyzed, a common pattern of projections also existed; namely, all cortical areas investigated within the PMC received input from the AILN, LP, MDdc, dorsal Pul and PTC (Table 2), although the relative density and percentage of retrogradely labeled cells varied with each case.
Discussion
The extrinsic neural connectivity of the PMC has remained largely under-explored due to its surgical inaccessibility and the presumption of connectional and functional commonality to neighboring cingulate and parietal association cortices. A major aim of this investigation was to examine the thalamocortical input to the different subregions forming the PMC with the working hypothesis that connectional patterns may parallel the diverse cytoarchitectural and functional correlates affiliated with this brain region. Although the thalamocortical connections represent only part of a larger neural network, we believe that these projections reveal systematic differences within the PMC that may assist in interpreting functional observations in previous as well as future studies. These differences, as well as observed connectional commonalities, form the core of the discussion that follows.
Thalamocortical Projections to the PMC
The thalamocortical connections evaluated in this study reveal three distinct patterns of connectivity to the PMC: a PCC/RSC pattern, a MPC pattern, and a PCS, each of which is characterized by a distinct set of afferents from the thalamus. In addition, area 31 of the MPC demonstrates labeling characteristics of both the PCC/RSC and MPC patterns and is unique in this respect as it appears to represent, based on connectional grounds, a transitional region interposed between the two systems.
Posterior Cingulate and Retrosplenial Thalamocortical Inputs
Cases 1 and 2 represent connections of the PCC and RSC, respectively. The PCC receives robust projections from anterior nuclei, AM, AV, and LD, but not AD. In addition, PCC receives input from posterior association nuclei, LP and Pul, as well as lesser input from VLc and Re. In comparison, the RSC receives projections from essentially the same thalamic areas with the addition of projections from AD and CSL and the absence of projections from Re. Both PCC and RSC receive afferents from PC, CeM and CL of the AILN, MDdc and PTC.
Our results confirm previous findings of thalamocortical projections to the PCC (Rose and Woolsey, 1948; Vogt et al., 1979) and RSC (Shibata and Yukie, 2003), with the additional observation of projections from the PTC, which have not been described. Our observations also show that the RSC receives input from the anterior thalamic nuclei AM and AV, which is in contrast to Rose and Woolsey (1948). Finally, we could not confirm the finding of a projection from AD to the PCC as previously reported (Vogt et al., 1979). It is possible that the differences between our observations and these previous reports could be due a number of factors including injection site size, injection location, choice of neuronal tracer, tissue processing applications and possibly, species differences in the case of Rose and Woolsey's (1948) report.
The most notable feature in our RSC/PCC cases is that the overall pattern of labeling was very similar, with variation in the percentage of labeled cells observed in each case. In the rostral thalamus of both cases, nearly identical networks of dense patches of labeled cells were found in the anterior nuclei and AILN (Figs. 4 and 5). However, the projections from the anterior nuclei to the RSC comprised approximately 50% of the total thalamic input, whereas the anterior nuclei projections to the PCC, although still substantial, were much less at 17.2%. In the caudal thalamus, labeled cells lined the dorsal Pul along the third ventricle and the ventral PTC, with slight differences in the percentages of labeled cells within each nucleus. Despite the similarity in the thalamocortical labeling pattern, the PCC and RSC are usually described as participating in differential functional systems. The PCC is thought to contribute to a number of cognitive functions such as attention (Mesulam, 1981; Vogt et al., 1992b) and reward evaluation (McCoy et al., 2003), whereas the RSC processes information related to spatial navigation (Maguire, 2001), memory (Vogt et al., 1992b) and possibly in integrating emotional information with episodic memory (Maddock, 1999).
The similarity in thalamocortical connectivity of the PCC and RSC presented herein would not necessarily support the notion of differential functional systems for these two cortical areas as both cortical areas were found to receive very similar thalamic afferents. This suggests that the source of observed differences in function of the PCC and RSC may be due to afferents other than the thalamus, such as corticocortical or other subcortical inputs (Kobayashi and Amaral, 2003; Morecraft et al., 2004; Morecraft and Tanji, In press; Morris et al., 1999). For example, corticocortical connections including the rich inputs from the prefrontal region to the PCC (Morecraft et al., 2004) and those from the entorhinal cortex to the RSC (Morris et al., 1999) may contribute to some of the observed functional diversity. However, the slight connectional differences, like input from AD to the RSC and not to the PCC, may also contribute to some observed functional differences.
Posterior Cingulate Sulcus Thalamocortical Inputs
Two injections, Case 4 and Case 5, were placed within the posterior cingulate sulcus. In Case 4, the injection site was in area 23c and in Case 5 the injection site was located in the neighboring, more caudal part of area PEci. Although both areas are located on the lower bank of the posterior cingulate sulcus, they are cytoarchitecturally distinct (Morecraft et al., 2004). These caudal cortical areas, which are buried within the depths of the cingulate sulcus, are also part of the caudal cingulate motor area or M4 (i.e., area 23c) (Morecraft et al., 1996; Morecraft and Van Hoesen, 1998) and the supplementary sensory area (i.e. area PEci) (Bowker and Coulter, 1981; Murray and Coulter, 1981).
The common thalamocortical relationship found in these two cases, which effectively dissociates these areas using connectional criteria from other areas of the PMC, is a unique pattern of projections from VA, VL and VPL, which are classically recognized sensorimotor nuclei. Cases 4 and 5 demonstrated labeling within the lateral segments of VA, VL, and primarily the anterior region of VPL forming a strip of labeled cells that outline their lateral boundaries near the external medullary lamina. This pattern was different from all other cases examined in this study.
Traditionally, VA and VL are considered peri-rolandic sensorimotor nuclei of the thalamus because they heavily innervate the sensorimotor areas of the cerebral cortex (Jones, 1985). Moreover, VPLo is a component in thalamic motor processing and VPLc is a somatosensory nucleus of the thalamus (Jones, 1985). The location of labeled cells in our cases further supports the idea that cortical regions within the cingulate sulcus are structurally equipped to be sensorimotor-related processing centers (Morecraft et al., 2004; Morecraft and Van Hoesen, 2003) and demarcates unique locations within the thalamus for input to the caudal cingulate motor area (i.e., M4, area 23c). The labeling pattern observed in VA and VL continued into VPL, classically designated as the primary sensory nucleus of the thalamus (Jones, 1985). The projections from VPL to area PEci (Case 5) would support the designation of area PEci as a supplementary sensory area (Murray and Coulter, 1981).
Based on the thalamocortical data, and in conjunction with cortical-cortical data (Morecraft et al., 2004; Morecraft and Van Hoesen, 1992), it appears that areas 23c and PEci are indeed are part of a sensorimotor neural network. This assertion is also supported by unit recording studies in non-human primates (Murray and Coulter, 1981; Shima et al., 1991) and the fact that this region of cortex also projects to the spinal cord (Dum and Strick, 1991; Hutchins et al., 1988; Luppino et al., 1994; Morecraft et al., 1997; Murray and Coulter, 1981; Nudo and Masterton, 1990).
Finally, the pattern of labeling observed in these two cases demonstrates that the cortex located on the lower bank of the caudal cingulate sulcus is systematically distinct from the systems of the PCC/RSC described above and the MPC described below.
Medial Parietal Thalamocortical Inputs
Cases 6, 7 and 8 represent injections of MPC area PGm and Cases 9 and 10 represent injections involving the caudal dorsal medial area PEc. Predominantly, we found MPC regions to receive robust input from posterior association nuclei, LP and dorsal Pul, representing over 45% of the total thalamic input in each case. Both areas of the MPC received input from VLc as well. No labeled cells were found in the anterior nuclei, with the exception of a small percentage of labeled cells observed in LD, in contrast to earlier findings (Schmahmann and Pandya, 1990) in which the anterior nuclei were labeled. The absence of labeled cells in the anterior nuclei and ventral nuclei in our cases indicates that cortical areas of the MPC are part of a distinct functional system that differs from the PCC/RSC and PCS thalamic afferentation patterns described above. Similar to thalamic projections to PCC/RSC, the MPC receive afferents from the AILN, MDdc, and PTC.
Previous anatomical studies of the posterior parietal cortex have shown that this cortex has extensive connections with the posterior portions of the thalamus, including LP and Pul (Robertson, 1976; Robertson, 1977; Schmahmann and Pandya, 1990). However, those studies focused mostly on the region of the superior lateral parietal cortices (LPC). The LPC receives projections from more medial nuclei, such as medial VP (VPM), and from different regions within common nuclei, such as ventral portion of Pul.A (Schmahmann and Pandya, 1990). Neither PEc, nor PGm receives projections from VPM or the ventral portion of the Pul.
Our results, along with those published previously (Cipolloni and Pandya, 1999; Morecraft et al., 2004) show thalamocortical connectional differences between the LPC and MPC. However, the results presented here fail to show that within MPC there are distinct thalamocortical input differences between PEc and PGm. In comparison, the overall location and patterns of thalamic labeling with injections to PEc and PGm are very similar as both areas receive robust projections from dorsolateral segments of posterior nuclei, such as LP and Pul, while not receiving any input from the anterior nuclei.
Cortical connection studies of areas medial PEc (Marconi et al., 2001; Petrides and Pandya, 1984) and PGm (Cavada and Goldman-Rakic, 1989b; Leichnetz, 2001; Pandya and Seltzer, 1982; Parvizi et al., 2006; Petrides and Pandya, 1984) reveal that they have differential cortical connectivity, and functional imaging studies suggest that they are also involved in discrete functions. Area PEc is traditionally associated with coordination of eye and hand movements during reaching motions (Caminiti et al., 1999; Marconi et al., 2001; Wenderoth et al., 2005), whereas PGm has been the subject of studies correlated to more cognitive functions, such as motor imagery and navigation (Malouin et al., 2003; Ogiso et al., 2000; Sato et al., 2006) memory retrieval (Lundstrom et al., 2005; Lundstrom et al., 2003) and generation of self (Gusnard and Raichle, 2001).
From a functional standpoint, as described above, these two cortical areas seem to be involved in different neural systems, but the thalamic input to these areas is very similar. This suggests, similar to the PCC/RSC, that the different activity-dependent neural systems may be more reliant on other connections such as cortical-cortical connectivity than thalamic inputs. However, our results do show distinctly that cortical areas of the MPC have a differential thalamic input pattern from both the PCC/RSC and LPC (Schmahmann and Pandya, 1990) indicative of distinguished neural systems.
Area 31 Thalamocortical Inputs
Case 3 represents an injection of area 31 and Case 6 represents an injection at the cytoarchitectural interface between areas 31 and PGm. The thalamic pattern of labeling exhibited in Case 6 was very similar to Case 3, but lacks considerable labeling in the anterior nuclei, with the exception of labeled cells in LD. Interestingly, anterior thalamic labeling in the lateral part of the anterior nuclei in Case 3 was similar in topography to Case 1 which has an injection in the dorsocaudal region of area 23. However, the thalamic projections from the anterior nuclei to the inferior part of area 31 in Case 3 was much weaker than the projections found to end in area 23 as evidenced in Case 1. Collectively, these cases show a gradational trend which suggests the anterior thalamic projections to PMC gradually diminish in the dorsal direction.
The labeling in LD of the anterior thalamic group of nuclei demonstrates another example indicating that area 31, although similar to PGm in some respects, has related connectional characteristics of the PCC as well. Therefore, the thalamocortical input pattern to area 31 possesses components from both the PCC/RSC and MPC systems and does not have a unique pattern of thalamocortical input that is unshared by all 3 regions. In general, PCC/RSC receives projections from primarily anterior nuclei; MPC receives input from predominately LP and Pul, and area 31 receives input similarly from all of these thalamic regions. Additionally, area 31 Cases 3 and 5 receive afferents from AILN, MDdc and the PTC as discussed below.
Area 31 is considered the most posterior portion of the PCC because of its anatomical proximity to area 23 (Vogt, 1993; Vogt et al., 1995) and its specific chemoarchitectonic features (Vogt et al., 2005). However, area 31 can also be viewed as an interface between PCC and MPC based on the gradual change in cytoarchitecture that occurs toward the isocortical parietal cortex and our findings on thalamocortical projections. As noted earlier, area 31 receives substantial input from the anterior nuclei like PCC/RSC, but also receives robust input from the posterior nuclei LP and Pul. The LP and Pul projections to area 31 are more robust than those to PCC/RSC demonstrating that the LP and Pul projections gradually increase in the dorsal direction.
Summary of Thalamocortical PMC Projections
A major aim of this study was to investigate projections from the thalamus to the multiple cortical areas found the PMC. The results reveal a diverse and extensive relationship between the thalamus and regions of the PMC characterized by differences in thalamic projections that delineate cytoarchitectonic areas within the PMC. Our investigation of the different cytoarchitectural regions of the PMC yields three distinct patterns of input from the thalamus: a PCC/RSC system, a MPC system, and a caudal cingulate sensorimotor area system. In addition to these differential patterns, we note that thalamocortical input to area 31 includes properties of both the PCC/RSC systems and the MPC systems, suggesting that area 31 may be a functional as well as cytoarchitectural interface between the PCC/RSC and MPC and may integrate information from both systems. However, it should be noted that the connections of area 31 could be related to its location between area 23 and PGm.
Common Thalamocortical Inputs
As described in our studies, each region within the PMC receives a distinct pattern of thalamic input that distinguishes that system from other sub-systems of the PMC. However, each of the thalamocortical systems of the PMC also receives input from several common thalamic regions including AILN, MDdc, LP, PTC and Pul. In addition to the PC, CL, CeM and CSL projections of the AILN, those arising from the posterior segments of MD and PTC may also be considered as an extended part of the AILN group. The similarity of projections shared in all cases binds the cortical areas within the PMC in a connectional and perhaps functional fashion. From a functional perspective, the shared inputs from the AILN may be involved in the maintenance of general arousal often attributed to this region (Mesulam, 1981). Indeed some consider these posterior cell groups to be part of the same intralaminar arrangement (Jones, 1985). In all cases presented here, cortical regions receive projections from the AILN, which, in addition to midline nuclei, are thought to be involved in modulating cortical arousal (Jones and Leavitt, 1974; Lorente de No, 1938; Morison and Dempsey, 1942). Specific input to the AILN from the brainstem (Krout et al., 2002; Van der Werf et al., 2002) has led to the notion that the AILN participate in the processes of arousal and awareness by influencing cortical activity (Groenewegen and Berendse, 1994; Kinomura et al., 1996; Van der Werf et al., 2002). The AILN, or lateral group of intralaminar nuclei in the rat,
Our study also showed that all cortical areas of the PMC received input from posterior association nuclei LP and Pul. The labeling in LP was consistent and robust, whereas the labeled cells within segments of Pul appeared to gradually increase as the injection site moved more dorsal and posterior within the PMC. The patterns observed in these posterior thalamic nuclei are consistent with the idea that LP and Pul are associated with the parietal (Robertson, 1977; Schmahmann and Pandya, 1990) and neighboring cortex and modulating inherent functions.
Domain-like Labeling Patterns in the Dorsal Thalamus
We described recently a continuous bar-like pattern of anterograde projections from the PCC, RSC, and area 31 to the dorsal thalamus (Parvizi et al., 2006). These anterograde projections were found to be continuous and aligned in a horizontal bar-like manner extending from the posterior to the anterior tip of the thalamus uninterruptedly traversing the dorsal nuclei AV, AD, AM, LD, VL, VA, LP, and lateral aspect of the pulvinar. It is interesting to note that the same longitudinal bar-like pattern extending from the posterior to the anterior tip of the thalamus is not seen after retrograde injections in the PMC. However, a consistent observation in our study was the finding of retrogradely labeled cells in the dorsal thalamus that cross the boundaries of multiple adjacent thalamic nuclei (Figs. 4 - 13), as if the cortical areas of the PMC are receiving thalamic afferents from a domain of thalamus. This is different than the band-like pattern originally attributed to thalamo-frontal connections by (Kievit and Kuypers, 1977)), and is most apparent in cases that involved area 23, RSC, and area 31. Cases involving the MPC, showed a similar pattern, albeit in a more lateral location of the dorsal thalamus (Figs. 9 and 10). Thus, individual areas within the PMC appear not to receive input from one nucleus or a series of separate nuclei, but from complex, three-dimensional thalamic arrays, or domains, that involve adjacent subsets of thalamic neurons superceding thalamic nuclear cytoarchitecture. To the extent which these domains interdigitate, interlock or overlap cannot be discerned from the data and design of our experiments, but should be testable with multiple double-labeling tracer experiments.
Comparing the continuous bar-like pattern of anterograde corticothalamic projections from the PMC to the patchy domain-like pattern of thalamocortical projection to the PMC suggests that there are thalamic neurons that receive unidirectional information from the PMC without reciprocating back to it. These thalamic neurons may be relaying the PMC inputs to other neural structures that the PMC can or cannot reach directly. This should also be testable with multiple double-labeling tracer experiments in the future.
Correlation to Aging and Dementia
Multiple studies suggest that the PMC may play a role in higher order associative tasks such as visuo-spatial imagery and navigation (Malouin et al., 2003; Ogiso et al., 2000) memory retrieval (Andreasen et al., 1995; Lundstrom et al., 2005; Lundstrom et al., 2003; Shannon and Buckner, 2004; Wagner et al., 2005) and self-referential processing (Cavanna and Trimble, 2006; Damasio, 1999; Gusnard and Raichle, 2001; Mazoyer et al., 2001; Vogt and Laureys, 2005). Taken together, these putative functional roles of the PMC are of particular interest due to their dysfunction in normal aging and dementia.
The PMC shows baseline hypometabolism in the functional studies of patients with dementia (Buckner, 2004; Buckner et al., 2000; Buckner et al., 2005; Drzezga et al., 2005; Lustig et al., 2003; Matsuda, 2001; Minoshima et al., 1994; Minoshima et al., 1997; Nestor et al., 2003a; Nestor et al., 2003b; Scahill et al., 2002). Moreover, the task-independent decrease of activity seen in the PMC in younger adults disappears with the onset of dementia (Buckner et al., 2000; Buckner et al., 2005; Lustig et al., 2003). These findings are not surprising given that the PMC is one of the brain regions that exhibits selective Alzheimer's related pathological changes in the course of the disease (Vogt et al., 1992a; Vogt et al., 1998).
It has also been suggested that the PMC dysfunction in dementia may be the result of damage to the major projection pathways from the entorhinal cortex to the PMC (Buckner et al., 2005; Giannakopoulos et al., 2000; Lustig et al., 2003), given that pathological damage to the entorhinal cortex is a hallmark of Alzheimer's Disease (Van Hoesen et al., 1991). These entorhinal-PMC pathways may in some way modulate the functional processes of the PMC and may account for observed functional differences seen in aging and dementia. The projections from the thalamus to the PMC described in this report, may also be an additional factor in the normal, putative functions of the PMC, and damage to these thalamocortical pathways, in addition to damage of medial temporal lobe projections to the PMC, may collectively contribute to the observed behavioral dysfunction in elderly and demented populations.
Some have suggested that this altered activation pattern may be the result of damage to the major projection pathways from the entorhinal cortex to the PMC (Buckner et al., 2005; Lustig et al., 2003), given that pathological damage to the entorhinal cortex is a hallmark of Alzheimer's Disease (Van Hoesen et al., 1991). These entorhinal-PMC pathways may in some way modulate the functional processes of the PMC and may account for observed functional differences seen in aging and dementia. The projections from the thalamus to the PMC described in this report, in particular, projections from the AILN to all regions of the PMC likely additionally be a factor in the normal putative functions of the PMC, and that damage to these thalamocortical pathways, in addition to damage of medial temporal lobe projections to the PMC, may collectively contribute to the observed behavioral dysfunction in elderly and demented populations. The finding that the AILN are progressively affected by DAT-related cytoskeletal pathology (Rub et al., 2002) strengthens the idea that damage to the AILN direct thalamocortical projections to the PMC may be a contributor to the observed functional imaging abnormalities in the PMC.
Acknowledgments
Grants NS 19632 and NS 14944 (GVH) and NS 046367 (RJM) from the National Institutes of Health have provided support for this research. We would also like to thank Tina Knutson, Diana Lei, Kim Stilwell-Morecraft and Paul Reimann for technical assistance.
Literature Cited
- Andreasen NC, O'Leary DS, Cizadlo T, Arndt S, Rezai K, Watkins GL, Ponto LL, Hichwa RD. Remembering the past: two facets of episodic memory explored with positron emission tomography. Am J Psychiatry. 1995;152(11):1576–1585. doi: 10.1176/ajp.152.11.1576. [DOI] [PubMed] [Google Scholar]
- Baleydier C, Mauguiere F. Anatomical evidence for medial pulvinar connections with the posterior cingulate cortex, the retrosplenial area, and the posterior parahippocampal gyrus in monkeys. J Comp Neurol. 1985;232(2):219–228. doi: 10.1002/cne.902320207. [DOI] [PubMed] [Google Scholar]
- Baleydier C, Mauguiere F. Network organization of the connectivity between parietal area 7, posterior cingulate cortex and medial pulvinar nucleus: a double fluorescent tracer study in monkey. Exp Brain Res. 1987;66(2):385–393. doi: 10.1007/BF00243312. [DOI] [PubMed] [Google Scholar]
- Bowker RM, Coulter JD. Intracortical connectivities of somatic sensory and motor areas. Multiple cortical pathways in monkey. In: Woolsey CN, editor. Cortical Sensory Organization Multiple somatic sensory areas. Clifton, NJ: Humana Press; 1981. pp. 205–242. [Google Scholar]
- Braak H. Pigment architecture of the human telencephalic cortex. IV. Regio retrosplenialis. Cell Tissue Res. 1979;204(3):431–440. doi: 10.1007/BF00233654. [DOI] [PubMed] [Google Scholar]
- Brodmann K. Vergleichende Localisationslehre der Grosshirnrinde in ihren Prinzipien dargestellt auf Grund des Zellenbaues'. Leipzig, Germany: Barth; 1909. [Google Scholar]
- Buckner RL. Memory and executive function in aging and AD: multiple factors that cause decline and reserve factors that compensate. Neuron. 2004;44(1):195–208. doi: 10.1016/j.neuron.2004.09.006. [DOI] [PubMed] [Google Scholar]
- Buckner RL, Snyder AZ, Sanders AL, Raichle ME, Morris JC. Functional brain imaging of young, nondemented, and demented older adults. J Cogn Neurosci. 2000;12(2):24–34. doi: 10.1162/089892900564046. [DOI] [PubMed] [Google Scholar]
- Buckner RL, Snyder AZ, Shannon BJ, LaRossa G, Sachs R, Fotenos AF, Sheline YI, Klunk WE, Mathis CA, Morris JC, Mintun MA. Molecular, structural, and functional characterization of Alzheimer's disease: evidence for a relationship between default activity, amyloid, and memory. J Neurosci. 2005;25(34):7709–7717. doi: 10.1523/JNEUROSCI.2177-05.2005. [DOI] [PMC free article] [PubMed] [Google Scholar]
- Caminiti R, Genovesio A, Marconi B, Mayer AB, Onorati P, Ferraina S, Mitsuda T, Giannetti S, Squatrito S, Maioli MG, Molinari M. Early coding of reaching: frontal and parietal association connections of parieto-occipital cortex. Eur J Neurosci. 1999;11(9):3339–3345. doi: 10.1046/j.1460-9568.1999.00801.x. [DOI] [PubMed] [Google Scholar]
- Cavada C, Goldman-Rakic PS. Posterior parietal cortex in rhesus monkey: I. Parcellation of areas based on distinctive limbic and sensory corticocortical connections. J Comp Neurol. 1989a;287(4):393–421. doi: 10.1002/cne.902870402. [DOI] [PubMed] [Google Scholar]
- Cavada C, Goldman-Rakic PS. Posterior parietal cortex in rhesus monkey: II. Evidence for segregated corticocortical networks linking sensory and limbic areas with the frontal lobe. J Comp Neurol. 1989b;287(4):422–445. doi: 10.1002/cne.902870403. [DOI] [PubMed] [Google Scholar]
- Cavanna AE, Trimble MR. The precuneus: a review of its functional anatomy and behavioural correlates. Brain. 2006;129(Pt 3):564–583. doi: 10.1093/brain/awl004. [DOI] [PubMed] [Google Scholar]
- Cipolloni PB, Pandya DN. Cortical connections of the frontoparietal opercular areas in the rhesus monkey. J Comp Neurol. 1999;403(4):431–458. [PubMed] [Google Scholar]
- Conde F. Further studies on the use of the fluorescent tracers fast blue and diamidino yellow: effective uptake area and cellular storage sites. J Neurosci Methods. 1987;21(1):31–43. doi: 10.1016/0165-0270(87)90100-2. [DOI] [PubMed] [Google Scholar]
- Damasio A. The Feeling of What Happens. New York, NY: Harcourt; 1999. [Google Scholar]
- Ding SL, Morecraft RJ, Van Hoesen GW. Topography, cytoarchitecture, and cellular phenotypes of cortical areas that form the cingulo-parahippocampal isthmus and adjoining retrocalcarine areas in the monkey. J Comp Neurol. 2003;456(2):184–201. doi: 10.1002/cne.10516. [DOI] [PubMed] [Google Scholar]
- Drzezga A, Riemenschneider M, Strassner B, Grimmer T, Peller M, Knoll A, Wagenpfeil S, Minoshima S, Schwaiger M, Kurz A. Cerebral glucose metabolism in patients with AD and different APOE genotypes. Neurology. 2005;64(1):102–107. doi: 10.1212/01.WNL.0000148478.39691.D3. [DOI] [PubMed] [Google Scholar]
- Dum RP, Strick PL. The origin of corticospinal projections from the premotor areas in the frontal lobe. J Neurosci. 1991;11(3):667–689. doi: 10.1523/JNEUROSCI.11-03-00667.1991. [DOI] [PMC free article] [PubMed] [Google Scholar]
- Giannakopoulos P, Gold G, Duc M, Michel JP, Hof PR, Bouras C. Neural substrates of spatial and temporal disorientation in Alzheimer's disease. Acta Neuropathol (Berl) 2000;100(2):189–195. doi: 10.1007/s004019900166. [DOI] [PubMed] [Google Scholar]
- Groenewegen HJ, Berendse HW. The specificity of the ‘nonspecific’ midline and intralaminar thalamic nuclei. Trends Neurosci. 1994;17(2):52–57. doi: 10.1016/0166-2236(94)90074-4. [DOI] [PubMed] [Google Scholar]
- Gusnard DA, Raichle ME. Searching for a baseline: functional imaging and the resting human brain. Nat Rev Neurosci. 2001;2(10):685–694. doi: 10.1038/35094500. [DOI] [PubMed] [Google Scholar]
- Hutchins KD, Martino AM, Strick PL. Corticospinal projections from the medial wall of the hemisphere. Exp Brain Res. 1988;71(3):667–672. doi: 10.1007/BF00248761. [DOI] [PubMed] [Google Scholar]
- Jones EG. The Thalamus. New York, NY: Plenum Press; 1985. [Google Scholar]
- Jones EG, Leavitt RY. Retrograde axonal transport and the demonstration of non-specific projections to the cerebral cortex and striatum from thalamic intralaminar nuclei in the rat, cat and monkey. J Comp Neurol. 1974;154(4):349–377. doi: 10.1002/cne.901540402. [DOI] [PubMed] [Google Scholar]
- Kievit J, Kuypers HG. Organization of the thalamo-cortical connexions to the frontal lobe in the rhesus monkey. Exp Brain Res. 1977;29(3-4):299–322. doi: 10.1007/BF00236173. [DOI] [PubMed] [Google Scholar]
- Kinomura S, Larsson J, Gulyas B, Roland PE. Activation by attention of the human reticular formation and thalamic intralaminar nuclei. Science. 1996;271(5248):512–515. doi: 10.1126/science.271.5248.512. [DOI] [PubMed] [Google Scholar]
- Kobayashi Y, Amaral DG. Macaque monkey retrosplenial cortex: I. three-dimensional and cytoarchitectonic organization. J Comp Neurol. 2000;426(3):339–365. doi: 10.1002/1096-9861(20001023)426:3<339::aid-cne1>3.0.co;2-8. [DOI] [PubMed] [Google Scholar]
- Kobayashi Y, Amaral DG. Macaque monkey retrosplenial cortex: II. Cortical afferents. J Comp Neurol. 2003;466(1):48–79. doi: 10.1002/cne.10883. [DOI] [PubMed] [Google Scholar]
- Krout KE, Belzer RE, Loewy AD. Brainstem projections to midline and intralaminar thalamic nuclei of the rat. J Comp Neurol. 2002;448(1):53–101. doi: 10.1002/cne.10236. [DOI] [PubMed] [Google Scholar]
- Leichnetz GR. Connections of the medial posterior parietal cortex (area 7m) in the monkey. Anat Rec. 2001;263(2):215–236. doi: 10.1002/ar.1082. [DOI] [PubMed] [Google Scholar]
- de No Lorente. Cerebral cortex: architecture, intracortical connections, motor projections. In: Fulton JF, editor. Physiology of the Nervous System. New York, NY: Oxford University Press; 1938. pp. 291–340. [Google Scholar]
- Lundstrom BN, Ingvar M, Petersson KM. The role of precuneus and left inferior frontal cortex during source memory episodic retrieval. Neuroimage. 2005;27(4):824–834. doi: 10.1016/j.neuroimage.2005.05.008. [DOI] [PubMed] [Google Scholar]
- Lundstrom BN, Petersson KM, Andersson J, Johansson M, Fransson P, Ingvar M. Isolating the retrieval of imagined pictures during episodic memory: activation of the left precuneus and left prefrontal cortex. Neuroimage. 2003;20(4):1934–1943. doi: 10.1016/j.neuroimage.2003.07.017. [DOI] [PubMed] [Google Scholar]
- Luppino G, Matelli M, Camarda R, Rizzolatti G. Corticospinal projections from mesial frontal and cingulate areas in the monkey. Neuroreport. 1994;5(18):2545–2548. doi: 10.1097/00001756-199412000-00035. [DOI] [PubMed] [Google Scholar]
- Lustig C, Snyder AZ, Bhakta M, O'Brien KC, McAvoy M, Raichle ME, Morris JC, Buckner RL. Functional deactivations: change with age and dementia of the Alzheimer type. Proc Natl Acad Sci U S A. 2003;100(24):14504–14509. doi: 10.1073/pnas.2235925100. [DOI] [PMC free article] [PubMed] [Google Scholar]
- Maddock RJ. The retrosplenial cortex and emotion: new insights from functional neuroimaging of the human brain. Trends Neurosci. 1999;22(7):310–316. doi: 10.1016/s0166-2236(98)01374-5. [DOI] [PubMed] [Google Scholar]
- Maguire EA. The retrosplenial contribution to human navigation: a review of lesion and neuroimaging findings. Scand J Psychol. 2001;42(3):225–238. doi: 10.1111/1467-9450.00233. [DOI] [PubMed] [Google Scholar]
- Malouin F, Richards CL, Jackson PL, Dumas F, Doyon J. Brain activations during motor imagery of locomotor-related tasks: a PET study. Hum Brain Mapp. 2003;19(1):47–62. doi: 10.1002/hbm.10103. [DOI] [PMC free article] [PubMed] [Google Scholar]
- Marconi B, Genovesio A, Battaglia-Mayer A, Ferraina S, Squatrito S, Molinari M, Lacquaniti F, Caminiti R. Eye-hand coordination during reaching. I. Anatomical relationships between parietal and frontal cortex. Cereb Cortex. 2001;11(6):513–527. doi: 10.1093/cercor/11.6.513. [DOI] [PubMed] [Google Scholar]
- Matsuda H. Cerebral blood flow and metabolic abnormalities in Alzheimer's disease. Ann Nucl Med. 2001;15(2):85–92. doi: 10.1007/BF02988596. [DOI] [PubMed] [Google Scholar]
- Mazoyer B, Zago L, Mellet E, Bricogne S, Etard O, Houde O, Crivello F, Joliot M, Petit L, Tzourio-Mazoyer N. Cortical networks for working memory and executive functions sustain the conscious resting state in man. Brain Res Bull. 2001;54(3):287–298. doi: 10.1016/s0361-9230(00)00437-8. [DOI] [PubMed] [Google Scholar]
- McCoy AN, Crowley JC, Haghighian G, Dean HL, Platt ML. Saccade reward signals in posterior cingulate cortex. Neuron. 2003;40(5):1031–1040. doi: 10.1016/s0896-6273(03)00719-0. [DOI] [PubMed] [Google Scholar]
- Mesulam MM. A cortical network for directed attention and unilateral neglect. Ann Neurol. 1981;10(4):309–325. doi: 10.1002/ana.410100402. [DOI] [PubMed] [Google Scholar]
- Minoshima S, Foster NL, Kuhl DE. Posterior cingulate cortex in Alzheimer's disease. Lancet. 1994;344(8926):895. doi: 10.1016/s0140-6736(94)92871-1. [DOI] [PubMed] [Google Scholar]
- Minoshima S, Giordani B, Berent S, Frey KA, Foster NL, Kuhl DE. Metabolic reduction in the posterior cingulate cortex in very early Alzheimer's disease. Ann Neurol. 1997;42(1):85–94. doi: 10.1002/ana.410420114. [DOI] [PubMed] [Google Scholar]
- Morecraft RJ, Cipolloni PB, Stilwell-Morecraft KS, Gedney MT, Pandya DN. Cytoarchitecture and cortical connections of the posterior cingulate and adjacent somatosensory fields in the rhesus monkey. J Comp Neurol. 2004;469(1):37–69. doi: 10.1002/cne.10980. [DOI] [PubMed] [Google Scholar]
- Morecraft RJ, Geula C, Mesulam MM. Architecture of connectivity within a cingulo-fronto-parietal neurocognitive network for directed attention. Arch Neurol. 1993;50(3):279–284. doi: 10.1001/archneur.1993.00540030045013. [DOI] [PubMed] [Google Scholar]
- Morecraft RJ, Louie JL, Schroeder CM, Avramov K. Segregated parallel inputs to the brachial spinal cord from the cingulate motor cortex in the monkey. Neuroreport. 1997;8(18):3933–3938. [PubMed] [Google Scholar]
- Morecraft RJ, McNeal DW, Stilwell-Morecraft KS, Gedney M, Ge J, Schroeder CM, van Hoesen GW. Amygdala interconnections with the cingulate motor cortex in the rhesus monkey. J Comp Neurol. 2007;500(1):134–165. doi: 10.1002/cne.21165. [DOI] [PubMed] [Google Scholar]
- Morecraft RJ, Schroeder CM, Keifer J. Organization of face representation in the cingulate cortex of the rhesus monkey. Neuroreport. 1996;7(8):1343–1348. doi: 10.1097/00001756-199605310-00002. [DOI] [PubMed] [Google Scholar]
- Morecraft RJ, Tanji J. Cingulofrontal Interactions and Cingulate Skeletomotor Areas. In: Vogt BA, editor. Cingulate Neurobiology and Disease: Infrastructure, Diagnosis and Treatment. New York: Oxford University Press; In press. [Google Scholar]
- Morecraft RJ, Van Hoesen GW. Cingulate input to the primary and supplementary motor cortices in the rhesus monkey: evidence for somatotopy in areas 24c and 23c. J Comp Neurol. 1992;322(4):471–489. doi: 10.1002/cne.903220403. [DOI] [PubMed] [Google Scholar]
- Morecraft RJ, Van Hoesen GW. Convergence of limbic input to the cingulate motor cortex in the rhesus monkey. Brain Res Bull. 1998;45(2):209–232. doi: 10.1016/s0361-9230(97)00344-4. [DOI] [PubMed] [Google Scholar]
- Morecraft RJ, Van Hoesen GW. Functional neuroanatomy of limbic structures and some relationships with prefrontal cortex. In: Fogel BS, Schiffer RB, Rao SM, editors. Neuropsychiatry. 2. Baltimore, MD: Lippincott, Williams and Wilkins; 2003. pp. 294–327. [Google Scholar]
- Morison RS, Dempsey EW. A study of thalamo-cortical relations. American Journal of Physiology. 1942;135:281–292. [Google Scholar]
- Morris R, Petrides M, Pandya DN. Architecture and connections of retrosplenial area 30 in the rhesus monkey (Macaca mulatta) Eur J Neurosci. 1999;11(7):2506–2518. doi: 10.1046/j.1460-9568.1999.00672.x. [DOI] [PubMed] [Google Scholar]
- Murray EA, Coulter JD. Organization of corticospinal neurons in the monkey. J Comp Neurol. 1981;195(2):339–365. doi: 10.1002/cne.901950212. [DOI] [PubMed] [Google Scholar]
- Nestor PJ, Fryer TD, Ikeda M, Hodges JR. Retrosplenial cortex (BA 29/30) hypometabolism in mild cognitive impairment (prodromal Alzheimer's disease) Eur J Neurosci. 2003a;18(9):2663–2667. doi: 10.1046/j.1460-9568.2003.02999.x. [DOI] [PubMed] [Google Scholar]
- Nestor PJ, Fryer TD, Smielewski P, Hodges JR. Limbic hypometabolism in Alzheimer's disease and mild cognitive impairment. Ann Neurol. 2003b;54(3):343–351. doi: 10.1002/ana.10669. [DOI] [PubMed] [Google Scholar]
- Nimchinsky EA, Vogt BA, Morrison JH, Hof PR. Neurofilament and calcium-binding proteins in the human cingulate cortex. J Comp Neurol. 1997;384(4):597–620. doi: 10.1002/(sici)1096-9861(19970811)384:4<597::aid-cne8>3.0.co;2-y. [DOI] [PubMed] [Google Scholar]
- Nudo RJ, Masterton RB. Descending pathways to the spinal cord, III: Sites of origin of the corticospinal tract. J Comp Neurol. 1990;296(4):559–583. doi: 10.1002/cne.902960405. [DOI] [PubMed] [Google Scholar]
- Ogiso T, Kobayashi K, Sugishita M. The precuneus in motor imagery: a magnetoencephalographic study. Neuroreport. 2000;11(6):1345–1349. doi: 10.1097/00001756-200004270-00039. [DOI] [PubMed] [Google Scholar]
- Olszewski J. The Thalamus of the Macaca Mulatta. Basel, Switzerland: S. Karger; 1952. [Google Scholar]
- Pandya DN, Seltzer B. Intrinsic connections and architectonics of posterior parietal cortex in the rhesus monkey. J Comp Neurol. 1982;204(2):196–210. doi: 10.1002/cne.902040208. [DOI] [PubMed] [Google Scholar]
- Parvizi J, Van Hoesen GW, Buckwalter J, Damasio A. Neural connections of the posteromedial cortex in the macaque. Proc Natl Acad Sci U S A. 2006;103(5):1563–1568. doi: 10.1073/pnas.0507729103. [DOI] [PMC free article] [PubMed] [Google Scholar]
- Paxinos G, Huang XF, Toga AW. The Rhesus Monkey Brain in Sterotaxic Coordinates. New York, NY: Academic Press; 2000. [Google Scholar]
- Petrides M, Pandya DN. Projections to the frontal cortex from the posterior parietal region in the rhesus monkey. J Comp Neurol. 1984;228(1):105–116. doi: 10.1002/cne.902280110. [DOI] [PubMed] [Google Scholar]
- Robertson RT. Thalamic projections to visually responsive regions of parietal cortex. Brain Res Bull. 1976;1(5):459–469. doi: 10.1016/0361-9230(76)90116-7. [DOI] [PubMed] [Google Scholar]
- Robertson RT. Thalamic projections to parietal cortex. Brain Behav Evol. 1977;14(3):161–184. doi: 10.1159/000125659. [DOI] [PubMed] [Google Scholar]
- Rose JE, Woolsey CN. Structure and relations of the limbic cortex and anterior thalamic nuclei in rabbit and cat. Journal of Comparative Neurology. 1948;89:279–348. doi: 10.1002/cne.900890307. [DOI] [PubMed] [Google Scholar]
- Rub U, Del Tredici K, Del Turco D, Braak H. The intralaminar nuclei assigned to the medial pain system and other components of this system are early and progressively affected by the Alzheimer's disease-related cytoskeletal pathology. J Chem Neuroanat. 2002;23(4):279–290. doi: 10.1016/s0891-0618(02)00007-8. [DOI] [PubMed] [Google Scholar]
- Sanides F. Representation in the Cerebral Cortex and its Areal Lamination. In: Bourne GH, editor. The Structure and Function of Nervous Tissue. New York, NY: Academic Press; 1972. [Google Scholar]
- Sato N, Sakata H, Tanaka YL, Taira M. Navigation-associated medial parietal neurons in monkeys. Proc Natl Acad Sci U S A. 2006;103(45):17001–17006. doi: 10.1073/pnas.0604277103. [DOI] [PMC free article] [PubMed] [Google Scholar]
- Scahill RI, Schott JM, Stevens JM, Rossor MN, Fox NC. Mapping the evolution of regional atrophy in Alzheimer's disease: unbiased analysis of fluid-registered serial MRI. Proc Natl Acad Sci U S A. 2002;99(7):4703–4707. doi: 10.1073/pnas.052587399. [DOI] [PMC free article] [PubMed] [Google Scholar]
- Schmahmann JD, Pandya DN. Anatomical investigation of projections from thalamus to posterior parietal cortex in the rhesus monkey: a WGA-HRP and fluorescent tracer study. J Comp Neurol. 1990;295(2):299–326. doi: 10.1002/cne.902950212. [DOI] [PubMed] [Google Scholar]
- Shannon BJ, Buckner RL. Functional-anatomic correlates of memory retrieval that suggest nontraditional processing roles for multiple distinct regions within posterior parietal cortex. J Neurosci. 2004;24(45):10084–10092. doi: 10.1523/JNEUROSCI.2625-04.2004. [DOI] [PMC free article] [PubMed] [Google Scholar]
- Shibata H, Yukie M. Differential thalamic connections of the posteroventral and dorsal posterior cingulate gyrus in the monkey. Eur J Neurosci. 2003;18(6):1615–1626. doi: 10.1046/j.1460-9568.2003.02868.x. [DOI] [PubMed] [Google Scholar]
- Shima K, Aya K, Mushiake H, Inase M, Aizawa H, Tanji J. Two movement-related foci in the primate cingulate cortex observed in signal-triggered and self-paced forelimb movements. J Neurophysiol. 1991;65(2):188–202. doi: 10.1152/jn.1991.65.2.188. [DOI] [PubMed] [Google Scholar]
- Van der Werf YD, Witter MP, Groenewegen HJ. The intralaminar and midline nuclei of the thalamus. Anatomical and functional evidence for participation in processes of arousal and awareness. Brain Res Brain Res Rev. 2002;39(2-3):107–140. doi: 10.1016/s0165-0173(02)00181-9. [DOI] [PubMed] [Google Scholar]
- Van Hoesen GW, Hyman BT, Damasio AR. Entorhinal cortex pathology in Alzheimer's disease. Hippocampus. 1991;1(1):1–8. doi: 10.1002/hipo.450010102. [DOI] [PubMed] [Google Scholar]
- Vogt BA. Retrosplenial cortex in the rhesus monkey: a cytoarchitectonic and Golgi study. J Comp Neurol. 1976;169(1):63–97. doi: 10.1002/cne.901690105. [DOI] [PubMed] [Google Scholar]
- Vogt BA. Structural Organization of the Cingulate Cortex: Areas, Neurons, and Somatodendritic Transmitter Receptors. In: Vogt BA, Gabriel M, editors. Neurobiology of Cingulate Cortex and Limbic Thalamus. Boston, MA: Birkhauser; 1993. [Google Scholar]
- Vogt BA, Crino PB, Vogt LJ. Reorganization of cingulate cortex in Alzheimer's disease: neuron loss, neuritic plaques, and muscarinic receptor binding. Cereb Cortex. 1992a;2(6):526–535. doi: 10.1093/cercor/2.6.526. [DOI] [PubMed] [Google Scholar]
- Vogt BA, Finch DM, Olson CR. Functional heterogeneity in cingulate cortex: the anterior executive and posterior evaluative regions. Cereb Cortex. 1992b;2(6):435–443. doi: 10.1093/cercor/2.6.435-a. [DOI] [PubMed] [Google Scholar]
- Vogt BA, Laureys S. Posterior cingulate, precuneal and retrosplenial cortices: cytology and components of the neural network correlates of consciousness. Prog Brain Res. 2005;150:205–217. doi: 10.1016/S0079-6123(05)50015-3. [DOI] [PMC free article] [PubMed] [Google Scholar]
- Vogt BA, Nimchinsky EA, Vogt LJ, Hof PR. Human cingulate cortex: surface features, flat maps, and cytoarchitecture. J Comp Neurol. 1995;359(3):490–506. doi: 10.1002/cne.903590310. [DOI] [PubMed] [Google Scholar]
- Vogt BA, Pandya DN. Cingulate cortex of the rhesus monkey: II. Cortical afferents. J Comp Neurol. 1987;262(2):271–289. doi: 10.1002/cne.902620208. [DOI] [PubMed] [Google Scholar]
- Vogt BA, Rosene DL, Pandya DN. Thalamic and cortical afferents differentiate anterior from posterior cingulate cortex in the monkey. Science. 1979;204(4389):205–207. doi: 10.1126/science.107587. [DOI] [PubMed] [Google Scholar]
- Vogt BA, Vogt L, Farber NB, Bush G. Architecture and neurocytology of monkey cingulate gyrus. J Comp Neurol. 2005;485(3):218–239. doi: 10.1002/cne.20512. [DOI] [PMC free article] [PubMed] [Google Scholar]
- Vogt BA, Vogt LJ, Vrana KE, Gioia L, Meadows RS, Challa VR, Hof PR, Van Hoesen GW. Multivariate analysis of laminar patterns of neurodegeneration in posterior cingulate cortex in Alzheimer's disease. Exp Neurol. 1998;153(1):8–22. doi: 10.1006/exnr.1998.6852. [DOI] [PubMed] [Google Scholar]
- von Bonin G, Bailey P. The Neocortex of the Macaca Mulatta. Urbana, IL: University of Illinois Press; 1947. [Google Scholar]
- Wagner AD, Shannon BJ, Kahn I, Buckner RL. Parietal lobe contributions to episodic memory retrieval. Trends Cogn Sci. 2005;9(9):445–453. doi: 10.1016/j.tics.2005.07.001. [DOI] [PubMed] [Google Scholar]
- Wenderoth N, Debaere F, Sunaert S, Swinnen SP. The role of anterior cingulate cortex and precuneus in the coordination of motor behaviour. Eur J Neurosci. 2005;22(1):235–246. doi: 10.1111/j.1460-9568.2005.04176.x. [DOI] [PubMed] [Google Scholar]
- Yeterian EH, Pandya DN. Corticothalamic connections of the posterior parietal cortex in the rhesus monkey. J Comp Neurol. 1985;237(3):408–426. doi: 10.1002/cne.902370309. [DOI] [PubMed] [Google Scholar]
- Yeterian EH, Pandya DN. Corticothalamic connections of paralimbic regions in the rhesus monkey. J Comp Neurol. 1988;269(1):130–146. doi: 10.1002/cne.902690111. [DOI] [PubMed] [Google Scholar]
- Yeterian EH, Pandya DN. Striatal connections of the parietal association cortices in rhesus monkeys. J Comp Neurol. 1993;332(2):175–197. doi: 10.1002/cne.903320204. [DOI] [PubMed] [Google Scholar]
- Yeterian EH, Pandya DN. Corticostriatal connections of extrastriate visual areas in rhesus monkeys. J Comp Neurol. 1995;352(3):436–457. doi: 10.1002/cne.903520309. [DOI] [PubMed] [Google Scholar]
- Yeterian EH, Pandya DN. Corticothalamic connections of extrastriate visual areas in rhesus monkeys. J Comp Neurol. 1997;378(4):562–585. [PubMed] [Google Scholar]
- Yukie M. Neural connections of auditory association cortex with the posterior cingulate cortex in the monkey. Neurosci Res. 1995;22(2):179–187. doi: 10.1016/0168-0102(95)00888-1. [DOI] [PubMed] [Google Scholar]