

Abstract
Nitric oxide (•NO) is a biologically important short-lived free radical signaling molecule. Both the enzymatic synthesis and the predominant forms of cellular metabolism of •NO are oxygen-dependent. For these reasons, changes in local oxygen concentrations can have a profound influence on steady-state •NO concentrations. Many proteins are regulated by •NO in a concentration-dependent manner, but their responses are elicited at different thresholds. Using soluble guanylyl cyclase (sGC) and p53 as model •NO-sensitive proteins, we demonstrate that their concentration-dependent responses to •NO are a function of the O2 concentration. p53 requires relatively high steady-state •NO concentrations (>600 nM) to induce its phosphorylation (P-ser-15), whereas sGC responds to low •NO concentrations (<100 nM). At a constant rate of •NO production (liberation from •NO-donors), decreasing the O2 concentration (1%) lowers the rate of •NO metabolism. This raises steady-state •NO concentrations and allows p53 activation at lower doses of the •NO donor. Enzymatic •NO production, however, requires O2 as a substrate such that decreasing the O2 concentration below the Km for O2 for nitric oxide synthase (NOS) will decrease the production of •NO. We demonstrate that the amount of •NO produced by RAW 264.7 macrophages is a function of the O2 concentration. Differences in rates of •NO production and •NO metabolism result in differential sGC activation that is not linear with respect to O2. There is an optimal O2 concentration (≈5–8%) where a balance between the synthesis and metabolism of •NO is established such that both the •NO concentration and sGC activation are maximal.
Abbreviations: BH4, tetrahydrobiopterin; cGMP, cyclic guanosine monophosphate; DETA/NO, (Z)-1-[N-(2-aminoethyl)–N-(2-ammonioethyl)amino]diazen-1-ium-1,2-diolate; eNOS, endothelial nitric oxide synthase; FAD, flavin adenine dinucleotide; FMN, flavin mononucleotide; iNOS, inducible nitric oxide synthase; Km, Michaelis constant; LPS, lipopolysaccharide; NADPH, nicotinamide adenine dinucleotide phosphate, reduced; nNOS, neuronal nitric oxide synthase; NO3−, nitrate; NO2−, nitrite; •NO, nitric oxide; ODQ, 1H-[1,2,4]Oxadiazolo[4,3–a]quinoxalin-1-one; O2, oxygen; P-Ser-15, phospho-serine 15; sGC, soluble guanylyl cyclase; Sper/NO, (Z)-1-[N-[3–aminopropyl]–N-[4-(3-aminopropylammonio)butyl]-amino]diazen-1-ium-1,2-diolate
Keywords: Nitric oxide, Nitric oxide synthase, Oxygen, Autooxidation, sGC, p53
Graphical Abstract

Highlights
►► O2 regulates •NO signaling by modulating •NO synthesis and metabolism. ► O2 affects •NO synthesis by regulating NOS expression and substrate availability. ► The rate of enzymatic •NO production increases linearly from 1–8% O2. ► The rate of cellular •NO metabolism increases with increasing [O2]. ► •NO-mediated sGC activation is maximal between 5% and 8% O2.
1. Introduction
Nitric oxide (nitrogen monoxide, •NO) is a short-lived signaling molecule involved in regulating numerous physiological and pathological functions. Nitric oxide is synthesized by nitric oxide synthase (NOS) of which there are three main isoforms (iNOS, eNOS, nNOS). The substrates for this enzyme are arginine and oxygen (O2). Also, NADPH, FMN, BH4, and FAD are required as cofactors. Not surprisingly, changes in the availability of any one of these substrates or cofactors can affect the rate of •NO production. When there is an abundance of cofactors, the rate of •NO synthesis will be a function of both the arginine and O2 concentrations. Arginine availability can vary based on cellular uptake and competing consumptive pathways (i.e. arginase and the urea cycle). The O2 availability in tissues is a function of its rate of delivery from the vasculature and the rate at which it is consumed locally via mitochondrial respiration. The Km's for arginine and O2 are different for each NOS isoform, thus changes in substrate concentrations will alter the •NO output in an isoform-dependent manner. The Km's for O2 for eNOS, iNOS and nNOS are 23 μM, 135 μM and 350 μM respectively. These differences indicate that for a given O2 concentration the rate of •NO synthesis from nNOS will be dramatically affected while production from eNOS will remain comparatively constant [1]. Since many phenotypic responses to •NO occur in a concentration-dependent manner [2], the cellular response to •NO produced in a relatively hypoxic environment could be substantially different than in tissues which are well oxygenated even if they express an equivalent amount and type of NOS.
The steady-state concentration of •NO ([•NOss]) is determined by the balance between its rate of production and its rate of disappearance. Although several studies have attempted to elucidate the mechanism(s) of cellular •NO metabolism, to date the dominant pathway(s) for this process remains undetermined. We and others have shown, however, that metabolism of •NO by non-erythroid cells is an O2-dependant process. Kinetic studies indicated that, although •NO metabolism requires O2, it is not a direct reaction of •NO with O2 (autooxidation) [3]. Herein, we demonstrate that the local O2 concentration determines [•NO]SS which differentially regulates signaling responses to •NO.
2. Materials and methods
2.1. Chemicals
(Z)-1-[N-(2-aminoethyl)–N-(2-ammonioethyl)amino]diazen-1-ium-1,2-diolate (DETA/NO) and (Z)-1-[N-[3–aminopropyl]–N-[4-(3-aminopropylammonio)butyl]-amino]diazen-1-ium-1,2-diolate (Sper/NO) were generous gifts from Dr. Joseph Hrabie (National Institutes of Health, NCI). 1H-[1,2,4]Oxadiazolo[4,3–a]quinoxalin-1-one (ODQ), lipopolysaccharides (LPS) and aminoguanidine hydrochloride were purchased from Sigma. All cell culture reagents were purchased from Invitrogen.
2.2. Cell culture
MCF-7 human breast carcinoma cells and RAW 264.7 murine macrophages were cultured in DMEM supplemented with 10% fetal bovine serum and 1% penicillin/streptomycin. All cells were grown to 85% confluence and MCF-7 cells were serum-starved overnight prior to treatment. To achieve a hypoxic environment (<21% O2), cells were grown in a hypoxic chamber glove-box (Coy Scientific) at 37 °C and 5% CO2. Oxygen concentration was constantly monitored and regulated by purging with nitrogen gas. RAW 264.7 cells were activated using LPS (1 μg/ml) to induce iNOS expression. For coculture experiments, activated RAW 264.7 cells were trypsinized, counted and added at indicated densities to MCF-7 cells in serum free media in the presence or absence of aminoguanidine (1 mM), an iNOS inhibitor. To inhibit sGC, MCF-7 cells were pretreated with 10 μM ODQ for 30 minutes prior to addition of RAW 264.7 cells.
2.3. Western Blotting
Whole cell lysates were collected using CellLytic™ M Cell Lysis Reagent (Sigma), supplemented with 1% protease inhibitor cocktail (Calbiochem) and 1 mM PMSF (Sigma). Proteins were transferred to polyvinylidene difluoride (PVDF) membranes using the iBlot transfer system (Invitrogen). The membranes were blocked with 5% nonfat dry milk in Tris-glycine–SDS containing 0.1% Tween 20 for 1 h at room temperature. They were then incubated overnight at 4 °C with suitable primary antibodies: p53 P-Ser-15, p53, β-actin (Cell Signaling Technology, Beverly, MA, USA) or iNOS (Santacruz Biotechnology, Santa Cruz, CA, USA). After incubation with horseradish peroxidase-conjugated secondary anti-rabbit antibody (Cell Signaling Technology, Beverly, MA, USA) for 1 h, the blots were analyzed in a Fluor Chem HD2 imager (Alpha Innotech) using SuperSignal West Femto Maximal Sensitivity Substrate (Thermo Scientific).
2.4. cGMP Measurements
MCF-7 cells were grown to 50% confluency in 96-well microtiter plates. Cells were serum-starved overnight and treated with various concentrations of Sper/NO or cocultured with activated RAW 264.7 macrophages at different densities. After the removal of •NO source, MCF-7 cells were lysed at the indicated time points, and cell extracts were assayed for cGMP by enzyme immunoassay (Amersham Biosciences).
2.5. Cellular •NO metabolism
Rates of disappearance of •NO were measured as described previously [4]. RAW 264.7 cells were trypsinized and put into a reaction chamber at 6×10⁶ cells/ml of serum-free media. Cell suspensions were constantly stirred in a sealed, water-jacketed, temperature-controlled (37 °C) chamber. The reaction chamber was equipped with both •NO and O2 electrodes connected to an Apollo 4000 free radical analyzer (World Precision Instruments, Sarasota, FL, USA). Headspace in the vessel was negligible compared to the vessel volume to ensure that the rate of •NO volatilization was insignificant compared with its reaction in solution. Reactions were initiated by injection of a saturated •NO solution with a gas-tight syringe, and •NO metabolism was measured using an •NO-selective electrode (amiNO-700, response time of <0.2 s, sensitivity of 25 nM; Innovative Instruments, Tampa, FL, USA).
2.6. Real-time •NO measurements
MCF-7 cells were grown in 10 cm culture dishes and an •NO-selective electrode (amiNO-700, Innovative Instruments) connected to an Apollo 4000 free radical analyzer (World Precision Instruments) was positioned ∼1 mm above, and perpendicular to the cellular monolayer. After equilibration for 2 h at 37 °C, •NO donor compounds were added and steady-state •NO concentrations were measured over time.
2.7. NO2−/NO3− measurements
Accumulation of •NO metabolites in the media was measured by chemiluminescence with a Sievers nitric oxide analyzer 280i. 25 μl aliquots of media were injected into a reaction chamber containing vanadium chloride in HCl as described previously [4].
2.8. Statistics
Significance was determined using either t-test or one way ANOVA with Bonferoni post-hoc analysis. Error bars indicate SEM.
3. Results
3.1. Proteins respond to •NO in a concentration-dependent manner
We and others have shown that the tumor suppressor protein p53 is phosphorylated at the serine 15 residue (p53 P-Ser-15) in response to relatively high steady-state concentrations of •NO (>600 nM [•NO]SS) [5]. Conversely, relatively low concentrations of •NO (<100 nM [•NO]SS) activate soluble guanylyl cyclase (sGC) [6]. The differing sensitivities of these proteins to •NO makes them, in effect, biological •NO dosimeters. We treated MCF-7 cells with increasing concentrations of the •NO-donor Sper/NO and measured changes in p53 P-Ser-15 and cGMP production. When the Sper/NO concentration was increased, the [•NO]ss concentration rose in a corresponding manner (Fig. 1A). As predicted, p53 was phosphorylated at the highest concentration of Sper/NO which produced [•NO]ss concentrations approaching 1 μM (Fig. 1B). Next, cGMP was measured in these cells as an indicator of sGC activation (Fig. 1C). Very low •NO concentrations were sufficient for maximal sGC activation (≈5 μM Sper/NO, <50 nM [•NO]SS).
Fig. 1.

Signaling effects of •NO are a function of its steady-state concentration. MCF-7 cells were treated with increasing concentrations of Sper/NO (0–100 μM) at 21% O2. (A) Measurement of [•NO]ss in media (•NO selective electrode, ∼1 mm above monolayer). (B) Immunoblot demonstrating p53 P-Ser-15 accumulation (t=2 h). (C) Measurement of cGMP production as an indicator of sGC activation (t=30 min). n=3, ⁎⁎ indicates p<0.01 with respect to untreated controls which are arbitrarily set to 1.0.
3.2. The impact of O2 concentration on [•NO]ss
We have previously shown that, for a given cell type and density, the rate of cellular •NO metabolism displays first-order kinetics which is a function of the both the •NO and O2 concentrations (Eq. 1) [3].
| (1) |
Using an •NO-selective electrode, we measured differences in •NO metabolism after either bolus addition or continuous exposure to •NO at 1% and 21% O2. For the purposes of this study, metabolism is defined as the disappearance of •NO in the presence of cells. Fig. 2A demonstrates that when cells in suspension received a 1000 nM •NO bolus, •NO metabolism was slower at 1% than at 21% O2 (t1/2=260s vs. 45 s). We also measured [•NO]ss in the culture media of cells treated with the •NO-donor DETA/NO at either 1% or 21% O2. The rate of •NO liberation from diazeniumdiolates such as DETA/NO is a function of pH and temperature and it is not affected by differences in O2 concentration [7]. For an equivalent concentration of DETA/NO (500 μM), the [•NO]ss was greater at 1% O2 than it was at 21% O2 (Fig. 2B). These observed differences in [•NO]ss at 1% vs. 21% O2 can be partially attributed to differences in the rates of •NO metabolism which decreases as the O2 concentration is lowered.
Fig. 2.
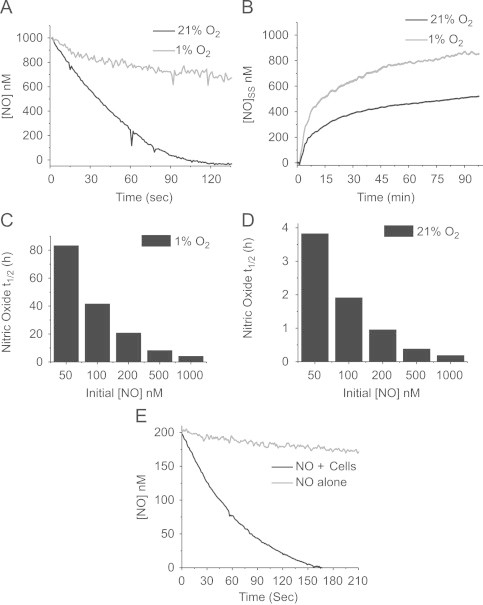
Oxygen concentration influences •NO consumptive process. (A) MCF-7 cells were placed in suspension and stirred in a reaction vessel at 37 °C with an •NO-selective electrode. •NO metabolism (disappearance) was measured after the additions of bolus amounts of an •NO-saturated stock solution at 21% O2 or 1% O2. (B) Measurement of [•NO]ss in the media of cells treated with 500 μM of the •NO-donor DETA/NO (•NO-selective electrode, ∼1 mm above monolayer) at 21% O2 or 1% O2. (C,D) Calculated half-life of •NO via autooxidation from 50–1000 nM starting concentrations at 1% and 21% O2. (E) Disappearance of 200 nM •NO at 21% O2 in the presence or absence of cells.
For cell culture experiments, the volume of media far exceeds the volume of cells. Therefore, in addition to cellular metabolism, the disappearance of •NO can result from other consumptive processes such chemical reactions in the media. The predominant reaction of •NO in the media is with dissolved O2 through the autooxidation reaction [8]. This reaction is first-order with respect to the O2 concentration (Eq. 3) and, therefore, its rate will vary based on differences in O2. We calculated the contribution of this reaction to the observed differences in the rates of •NO disappearance at both O2 concentrations. Autooxidation occurs with the following overall stoichiometry [8]:
| (2) |
The rate of disappearance of •NO through this reaction is given by
| (3) |
where k=1.8–6.6×10⁶ M−2s−1.
Calculations of •NO disappearance via the autooxidation reaction at 1% and 21% O2 are shown in Fig. 2C and D. These illustrate the well-known fact that the half-life of •NO is inversely correlated to the •NO concentration and the O2 concentration. At 1% O2, the half-life of •NO is on the order of hours to days at 1000 nM •NO (Fig. 2C). At 21% O2, the half-life of •NO is reduced to minutes or hours (Fig. 2D). These calculations reveal that, at 1% O2, 1000 nM •NO disappears ≈58 times slower via the autooxidation reaction than in the presence of cells (Fig. 2A) and ≈15 times slower at 21% O2. The lower the •NO concentration, however, the less autooxidation contributes to the observed differences in the rates of •NO disappearance in the presence of cells because autooxidation is second order in •NO. This is exemplified in Fig. 2E, which demonstrates that the disappearance of 200 nM •NO is negligible in the absence of cells.
In addition to cellular consumption and autooxidation, there are other means by which •NO can disappear in cell culture experiments. These include volatilization from the culture flask and reactions with other components in the media [7]. In comparison to the reaction of •NO with cells or O2, the disappearance of •NO via other mechanisms should be constant at any O2 concentration. As a result, these other consumptive pathways should not be a confounding factor when observing differences in the rates of •NO disappearance at different O2 concentrations. Our data indicate that the dominant mechanism of •NO loss is via cellular metabolism, which prevails over other processes including autooxidation.
3.3. Oxygen modulates •NO signaling processes
At a constant rate of •NO production (i.e. from •NO-donor compounds), the [•NO]ss is predominantly a function of the O2-dependant rate at which it is metabolized by cells (Fig. 2B). We set out to determine if the effect of O2 on [•NO]ss would differentially affect •NO-regulated signaling. To test this, we measured the accumulation of p53 Ser-15 phosphorylation in MCF-7 cells treated with increasing concentrations of the •NO-donor Sper/NO at either 1% O2 or 21% O2 for 2 h. Fig. 3 demonstrates that, at 1% O2, the concentration of Sper/NO necessary to induce p53 P-Ser-15 is only one fourth of the amount required at 21% O2. For a given Sper/NO concentration, the rate of •NO production is the same at both O2 concentrations, yet the [•NO]ss is greater at 1% O2 due to differences in the rates of cellular •NO metabolism. Since p53 phosphorylation requires a specific threshold concentration of •NO (Fig. 1B), this implies that the [•NO]ss from 25 μM Sper/NO at 1% O2 is roughly equivalent to what is achieved at 21% O2 from 100 μM Sper/NO. This demonstrates that, at a constant rate of •NO production, it is the O2 concentration that ultimately determines the extent of •NO signaling.
Fig. 3.

Low O2 decreases the dose of •NO-donor compound required for p53 activation. MCF-7 cells were treated with increasing concentrations of Sper/NO (0–100 μM) at 21% O2 or 1% O2 for 2 h. Immunoblot demonstrating accumulation of p53-Ser-15 phosphorylation. n=3, ⁎⁎indicates p<0.01 with respect to untreated controls which are arbitrarily set to 1.0.
3.4. Oxygen determines the rate of enzymatic •NO synthesis
Unlike the liberation of •NO from synthetic donors, the biological production of •NO is enzymatic and requires molecular O2 as a substrate. For a given NOS isoform, changes in O2 concentrations will affect enzymatic •NO production. To demonstrate this, we cultured RAW 264.7 macrophages over a range of O2 concentrations and stimulated them with LPS to induce iNOS expression and •NO production. The total amount of enzymatic •NO synthesis was determined by measuring the accumulation of NO3−/NO2− in the media over time. In Fig. 4A it can be seen that, as expected, there was a temporal and linear increase in •NO production as the O2 concentration rose from 1–8%. More importantly, however, above 8% O2 no further increase in the rate of •NO production was observed. This indicates that O2 is no longer a limiting factor for •NO synthesis at concentrations greater than 8%.
Fig. 4.

The rate of •NO synthesis is a function of both the NOS and O2 concentrations. RAW 264.7 cells were cultured at different O2 concentrations and stimulated with LPS (t=0 h). The rate of •NO synthesis was measured by quantifying NO2−/NO3− accumulation in the media by chemiluminescence. (A) Contour plot demonstrating the temporal relationship between changing O2 concentrations and rates of •NO synthesis. (B) Immunoblot demonstrating increased iNOS expression as a function of decreasing O2 concentrations (t=10 h). (C) (columns 1, 2, 4, & 5) Cells were grown at 21% O2 or 1% O2 and NO2−/NO3− was measured at 16 h and 24 h. (columns 3 & 6) Cells were grown at 21% O2 or 1% O2. After 16 h the cells at 21% O2 were moved to 1% O2 and the cells at 1% O2 were moved to 21% O2. Both sets of cells were incubated for an additional eight hours (24 h total) and NO2−/NO3− was measured. Values given at 24 h are the addition of the 16 h and additional 8 h reads. n=3, ⁎ indicates 0.01<p<0.05; ⁎⁎indicates p<0.01 with respect to untreated controls which are arbitrarily set to 1.0.
Hypoxia is known to affect the magnitude of iNOS expression which could potentially influence the overall amount of •NO synthesis [4]. We examined this possibility by culturing RAW 264.7 cells over a range of O2 concentrations and measuring the levels of iNOS expression subsequent to LPS stimulation. Fig. 4B demonstrates that decreasing the O2 concentration increased the magnitude of iNOS expression. Next, we set out to compare the effects of enzyme concentration vs. O2 concentration on the amount of •NO produced. Activated RAW 264.7 cells were cultured at 1% and 21% O2 for 16 or 24 h and the amount of NO2−/NO3− was measured (Fig. 4C, columns 1,2,4,5). At both time points, the amount of •NO synthesis was considerably higher at 21% O2 than at 1% O2 as seen in Fig. 4A.
To understand the effects of differences in enzyme expression on •NO synthesis, we cultured RAW 264.7 cells for 16 h at 1% O2. This resulted in a substantial increase in cellular iNOS protein expression (Fig. 4B). After 16 h these cells were moved to 21% O2 for an additional 8 h (24 h total) and NO2−/NO3− was measured (Fig. 4C, column 3). This resulted in a dramatic increase in •NO production at 21% O2 that we attributed to the hypoxia-mediated increase in iNOS expression (Fig. 4C, compare columns 1, 2 and 3). This experiment was repeated, but the order of oxygen exposure was reversed; 21% O2 for 16 h followed by 8 h at 1% O2 (Fig. 4C, column 6). Under these conditions, total •NO synthesis was substantially diminished (Fig. 4C, compare columns 3,6). Together these results indicate that at 21% O2 enzyme concentration is the major limiting factor for •NO synthesis whereas at 1% O2, oxygen is the major limiting factor. Therefore, the oxygen concentration can influence •NO production by changing the amount of iNOS expressed or as a limiting substrate for this enzyme.
3.5. Oxygen regulates the magnitude of •NO signaling
Having determined that changes in O2 concentration could influence both the rate of enzymatic •NO production and •NO metabolism, we went on to examine the impact of these processes on •NO signaling. For these experiments we developed a co-culture model in which MCF-7 cells were cultured in the presence of •NO-producing RAW 264.7 cells. After isolation of the MCF-7 cells, sGC activation was measured by monitoring the cGMP production. Fig. 5A demonstrates that sGC in the target MCF-7 cells was activated in response to RAW 264.7-derived •NO. Cyclic GMP production in the MCF-7 cells was not detected when cells were treated with ODQ, co-cultured with non-activated RAW 264.7 cells or activated RAW cells treated with the iNOS inhibitor aminoguanidine (Fig. 5A). Next, we altered oxygen levels by culturing the cells at different O2 concentrations (1–21%) and modulated the •NO concentration by changing the ratio of RAW 264.7/MCF-7 cells. We then repeated the co-culture experiment over a range of O2 and •NO concentrations. Fig. 5B demonstrates that sGC activation was dependent on both the O2 concentration and the number of •NO-producing cells. Interestingly, the optimal O2 concentration for maximal cGMP production was at ≈5–8% O2. This suggests that at this O2 concentration •NO production and •NO consumptive processes are optimized to maximize steady-state •NO concentration and sGC activation.
Fig. 5.

Signaling effects of endogenously produced •NO are affected by O2 concentration. (A) Activated RAW 264.7 cells were cocultured in serum free media with MCF-7 cells at 21% O2. Coculture with unactivated RAW cells; activated RAW cells±the iNOS inhibitor aminoguanidine (AG); or the sGC inhibitor ODQ. After 30 min the RAW 264.7 cells were removed and cGMP production was measured in the MCF-7 cells by ELISA. (B) Increasing amounts of activated RAW 264.7 cells were cocultured in serum free media with MCF-7 cells over a range of O2 concentrations (0.5–21%). After 30 min the RAW 264.7 cells were removed and cGMP production was measured in the MCF-7 cells by ELISA. Contour plot demonstrating the relationship between cGMP production, O2 concentration, and different densities of •NO-producing RAW 264.7 cells.
4. Discussion
Nitric oxide is a small, uncharged, freely diffusible gas that under biological conditions reacts with other free radicals (including oxygen) and metals. Its unique biochemical properties allow it regulate, and sometimes disrupt, numerous aspects of cell physiology. In addition to •NO's ability to activate signal transduction cascades, it can also directly inhibit respiration and sequester cellular iron. Unfortunately, the same properties that confer this diversity of function also make it extremely challenging to predict its exact [•NO]ss in cells and tissues. It is well-known that both •NO synthesis and •NO consumption are O2-dependent, and thus the oxygen concentration will influence the rates of both of these processes. We investigated the overall ability of O2 to modulate •NO signaling events. If the rate of •NO synthesis is greater than the rate of cellular •NO consumption, [•NO]ss concentrations will increase. Conversely, if the rate of •NO consumptive processes predominate over its rate of synthesis, [•NO]ss levels will decrease. Oxygen largely dictates the [•NO]ss and ultimately the magnitude of •NO signaling. We and others have demonstrated previously that the [•NO]ss is a significant determinant of cell signaling effects; the various •NO-mediated signaling pathways require different threshold concentrations of •NO for activation. Although many of these concepts have been described previously, our results link •NO concentration, O2 concentration, •NO synthesis, and •NO metabolism into a unified theory.
Many in vivo studies use the expression levels of NOS as justification for •NO-attributable responses [9]. It is often not appreciated that the overall amount of synthesized •NO cannot easily be inferred solely by examining the levels of NOS protein. Our results demonstrate that both the O2 concentration and the amount of NOS protein are equally important determinants of the amount of •NO synthesized. The relative contribution of both of these parameters varies with the O2 concentration. At high O2, •NO synthesis is dependent on the amount of enzyme present, while at low O2, oxygen itself becomes the limiting factor.
We used a •NO-selective electrode to measure the [•NO]ss in the •NO-donor treated media of cells grown in monolayer. Since •NO is freely diffusible into cells, its steady-state concentration in the media is in equilibrium with its concentration in the cells. This allows for a precise measurement of [•NO]ss and the identification of signaling cascades that correspond to specific •NO concentrations. As we have previously reported, •NO-mediated cellular signaling is stratified with numerous signaling pathways being activated by differential [•NO]ss [2]. Our current study builds on these findings by demonstrating how •NO signaling can be significantly modified by the O2 concentration. In many ways these results are expected given the ability of O2 to modulate •NO concentrations. However, our results demonstrate that changes in •NO signaling do not always change linearly with changing O2 concentrations.
When the rate of •NO production is constant, its steady-state concentration is predominantly a function of its O2-dependant rate of metabolism. We demonstrate that, at lower O2 concentrations, •NO metabolism is considerably slower, and thus [•NO]ss is higher. This inverse relationship has a direct effect on •NO signaling. Activation of p53 Ser-15 phosphorylation at 1% O2, for example, is possible with one-fourth the dose of Sper/NO necessary to achieve the same effect at 21% O2. This indicates that, for a given rate of •NO production (synthesis), lowering the O2 concentration will enable activation of signaling pathways that are not obtainable at higher O2 concentrations.
In addition to •NO consumptive pathways, we show that O2 concentrations influence [•NO]ss by affecting its rate of enzymatic synthesis. Oxygen is a necessary substrate for NOS, and the oxygen gradient itself regulates iNOS expression [4]. Our data reveals that, in •NO-producing RAW 264.7 cells, the rate of •NO synthesis increases in a linear fashion from 1–8% O2. Above this amount of O2, further increases in the rate of •NO synthesis were not observed. When sGC activation by •NO was examined under changing O2 concentrations, we noted maximal activation at 5–8% O2. At O2 concentrations higher or lower than these amounts, there was a decrease in sGC activation. We suggest that the balance between O2 availability and enzyme expression at 5–8% O2 is optimized such that the rate of •NO production versus its rate of metabolism synergize to achieve maximal [•NO]ss. At higher O2 concentrations, •NO production is maximal but so is its metabolism. At lower O2 concentrations, •NO metabolism is slowest but so is its enzymatic synthesis.
5. Conclusions
These findings highlight the importance and dependence of O2 on biological responses to •NO. The principals discussed in this study are important to consider when assigning a functional role to •NO in the context of numerous normal and disease conditions where oxygen gradients exist. The tissue microenvironment will drive [•NO]ss, thereby modifying which signal transduction cascades are triggered to ultimately influence cellular phenotype. Some of the disparities seen in •NO signaling are thus the result of O2 mediated changes in [•NO]ss. These are important factors to consider when trying to elucidate the biochemical responses to •NO synthesis and also the effects of therapeutic •NO donors especially in the context of changing oxygen environments.
Acknowledgments
Research reported in this publication was supported by the National Institute of General Medical Sciences of the National Institutes of Health under award number R01GM085232. The content is solely the responsibility of the authors and does not necessarily represent the official views of the National Institutes of Health. The authors also acknowledge ongoing support from the UIC Cancer Center.
Footnotes
This is an open-access article distributed under the terms of the Creative Commons Attribution License, which permits unrestricted use, distribution, and reproduction in any medium, provided the original author and source are credited.
References
- 1.Stuehr D.J., Santolini J., Wang Z.Q., Wei C.C., Adak S. Update on mechanism and catalytic regulation in the NO synthases. Journal of Biological Chemistry. 2004;279:36167–36170. doi: 10.1074/jbc.R400017200. [DOI] [PubMed] [Google Scholar]
- 2.Thomas D.D., Ridnour L.A., Isenberg J.S., Flores-Santana W., Switzer C.H., Donzelli S. The chemical biology of nitric oxide: implications in cellular signaling. Free Radical Biology and Medicine. 2008;45:18–31. doi: 10.1016/j.freeradbiomed.2008.03.020. [DOI] [PMC free article] [PubMed] [Google Scholar]
- 3.Thomas D.D., Liu X., Kantrow S.P., Lancaster J.R., Jr. The biological lifetime of nitric oxide: implications for the perivascular dynamics of NO and O2. Proceedings of the National Academy of Sciences of the USA. 2001;98:355–360. doi: 10.1073/pnas.011379598. [DOI] [PMC free article] [PubMed] [Google Scholar]
- 4.Hickok J.R., Sahni S., Shen H., Arvind A., Antoniou C., Fung L.W. Dinitrosyliron complexes are the most abundant nitric oxide-derived cellular adduct: biological parameters of assembly and disappearance. Free Radical Biology and Medicine. 2011;51:1558–1566. doi: 10.1016/j.freeradbiomed.2011.06.030. [DOI] [PMC free article] [PubMed] [Google Scholar]
- 5.Thomas D.D., Espey M.G., Ridnour L.A., Hofseth L.J., Mancardi D., Harris C.C. Hypoxic inducible factor 1alpha, extracellular signal-regulated kinase, and p53 are regulated by distinct threshold concentrations of nitric oxide. Proceedings of the National Academy of Sciences of the USA. 2004;101:8894–8899. doi: 10.1073/pnas.0400453101. [DOI] [PMC free article] [PubMed] [Google Scholar]
- 6.Bellamy T.C., Wood J., Garthwaite J. On the activation of soluble guanylyl cyclase by nitric oxide. Proceedings of the National Academy of Sciences of the USA. 2002;99:507–510. doi: 10.1073/pnas.012368499. [DOI] [PMC free article] [PubMed] [Google Scholar]
- 7.Thomas D.D., Miranda K.M., Espey M.G., Citrin D., Jourd’heuil D., Paolocci N. Guide for the use of nitric oxide (NO) donors as probes of the chemistry of NO and related redox species in biological systems. Methods in Enzymology. 2002;359:84–105. doi: 10.1016/s0076-6879(02)59174-6. [DOI] [PubMed] [Google Scholar]
- 8.Ford P.C., Wink D.A., Stanbury D.M. Autoxidation kinetics of aqueous nitric oxide. FEBS Letters. 1993;326:1–3. doi: 10.1016/0014-5793(93)81748-o. [DOI] [PubMed] [Google Scholar]
- 9.Hickok J.R., Thomas D.D. Nitric oxide and cancer therapy: the emperor has NO clothes. Current Pharmaceutical Design. 2010;16:381–391. doi: 10.2174/138161210790232149. [DOI] [PMC free article] [PubMed] [Google Scholar]