

Abstract
Activation of the transcription factor Nrf2 (nuclear factor-erythroid 2-related factor 2) is one of the major cellular defense lines against oxidative and xenobiotic stress, but also influences genes involved in lipid and glucose metabolism. It is unresolved whether the cytoprotective and metabolic responses mediated by Nrf2 are connected or separable events in non-malignant cells. In this study we show that activation of Nrf2, either by the small molecule sulforaphane or knockout of the Nrf2 inhibitor Keap1, leads to increased cellular glucose uptake and increased glucose addiction in fibroblasts. Upon Nrf2 activation glucose is preferentially metabolized through the pentose phosphate pathway with increased production of NADPH. Interference with the supply of glucose or the pentose phosphate pathway and NADPH generation not only hampers Nrf2-mediated detoxification of reactive oxygen species on the enzyme level but also Nrf2-initiated expression of antioxidant defense proteins, such as glutathione reductase and heme-oxygenase1. We conclude that the Nrf2-dependent protection against oxidative stress relies on an intact pentose phosphate pathway and that there is crosstalk between metabolism and detoxification already at the level of gene expression in mammalian cells.
Abbreviations: 3BP, 3-bromopyruvate; ATP, adenosine triphosphate; ctrl, control; DCF, dichloroflourescein; DHEA, dehydroandrostendione; DMSO, dimethylsulfoxide; G6PD, glucose 6-phosphate dehydrogenase; Glut1, glucose transporter 1; GR, glutathione reductase; HO-1, heme oxygenase-1; Keap1, Kelch-like ECH-associated protein1; NADP, nicotine adenine dinucleotide phosphate; Nrf2, nuclear factor-erythroid 2-related factor 2; NQO1, NAD(P)H:quinone oxidoreductase 1; Maf, small masculoaponeurotic fibrosarcoma; MEF, mouse embryonic fibroblasts; OXPHOS, oxidative phosphorylation; PBS, phosphate buffered saline; PPP, pentose phosphate pathway; ROS, reactive oxygen species; SFN, sulforaphane; WT, wild type
Keywords: Nrf2, Glucose addiction, ROS detoxification
Graphical abstract

Highlights
-
•
Activation of Nrf2 results in increased cellular glucose uptake.
-
•
Upon activation of Nrf2 glucose is preferentially metabolized through the PPP.
-
•
The resulting increase in NADPH is not only pivotal for functional detoxification of ROS, but also for Nrf2-dependent gene expression in mammalian cells.
-
•
These data complement our understanding of the metabolic shade of Nrf2 action.
Introduction
Cells are constantly challenged by xenobiotic and oxidative insults. Nrf2 (nuclear factor-erythroid 2-related factor 2), a ubiquitously expressed transcription factor of the cap 'n' collar basic leucine zipper family, is a major part of the cellular defense against those harmful stressors. Like most transcription factors, Nrf2 underlies a spatio–temporal regulation of its function. Under unstressed conditions, the level of Nrf2 protein is kept at low levels by binding to its most prominent inhibitor Kelch-like ECH-associated protein (Keap) 1 in a 1:2 M ratio. Keap1, being an adapter for Cul3/Rbx1 E3 ubiquitin ligases, facilitates constant proteasome-dependent degradation of Nrf2. Upon exposure to oxidative or electrophilic agents, Keap1 acts as redox or xenobiotic sensor via oxidation or covalent modification of some of its cysteine residues. This disrupts the Nrf2/Keap1 complex, stops degradation and favors stabilization of Nrf2 and subsequent translocation to the nucleus. There, Nrf2 heterodimerizes with Maf (small masculoaponeurotic fibrosarcoma) proteins and binds to ARE (antioxidant response element) consensus sequences (TCAG/CXXXGC) in promoters of Nrf2-regulated genes. Those counteract the initiating insults and are usually involved in drug metabolism, the oxidative stress response and detoxification [1–3].The discovery of Nrf2 as main factor in the expression of cell defense genes favored research exploiting Nrf2 as target of drugs or nutritional supplements. Several plant- and food derived products are capable of activating Nrf2, including Michael reaction acceptors (such as curcumine from turmeric), isothiocyanates (such as sulforaphane from cruciferous vegetable), polyenes (such as chlorophyll or porphyrins) or oxidizable (di)phenols (such as resveratrol from grapes) [4]. They beneficially influence the outcome in many models of disease, including cancer, vascular disease, type II diabetes or neurodegenerative disorders. These conditions are characterized or caused, at least to some extent, by a tilt of the redox balance towards oxidative stress which is thought to be alleviated or prevented upon Nrf2 activation. However, they are also linked with altered metabolism. Of note, beyond mere antioxidant and detoxification duties of Nrf2, gene arrays revealed that activated Nrf2 regulates clusters of genes involved in lipid and glucose metabolism [5]. Nrf2 showed both positive and negative influence on lipogenesis, depending on the model system used [6–8], and certain cancer cells exploit constitutive activation of Nrf2 to reprogram their metabolism for securing optimal supply with biosynthetic building blocks [9]. However, whether the cellular antioxidant defense and the metabolic shift elicited by Nrf2 are interconnected in non-malignant cells has not been elucidated in detail.
We therefore investigated a potential interplay between Nrf2-mediated cytoprotection and cellular glucose metabolism in mouse embryonic fibroblasts (MEFs) as model system. In order to rule out metabolic adaptations to distinct proliferation rates upon different treatments, we used quiescent (growth factor depleted) cells throughout the study. We obtained transient pharmacological activation of Nrf2 by treatment with the Nrf2 activator sulforaphane (SFN) [10]. Nrf2-dependent activity of SFN was confirmed by a lacking response in isogenic Nrf2−/− cells. Genetic knockout of the Nrf2 inhibitor Keap1 served as model for constitutive Nrf2 activation.
Materials and methods
Materials
Mouse embryonic fibroblasts (WT, Nrf2−/− and Keap1−/−) were a kind gift from Thomas Kensler, University of Pittsburgh, USA. SFN, menadione and other chemicals or enzymes were obtained from Sigma-Aldrich, unless stated otherwise. Accutase for serum-free cell detachment was from Millipore. Tritium-labeled 2-desoxyglucose was provided by Amersham. Amplex Red and H2DCF-DA were from Invitrogen. The CellTiterGlo assay for determination of cellular ATP levels came from Promega. The kit for NADPH determination was purchased from BioVision, and the exogenous enzymatic NADPH generation system was from BD Biosciences and was used in a 1:20 dilution of solution A (NADP+ and glucose-6-phosphate; cat. no. 451220) and a 1:100 dilution of solution B (glucose-6-phosphate dehydrogenase (G6PD); cat. no. 451200). The primary antibody directed against heme oxygenase (HO-1) was from Stressgen, the one against glutathione reductase (GR) was from Santa Cruz, the secondary horseradish peroxidase (HRP) coupled anti-rabbit antibody was obtained from Cell Signalling, and the secondary anti-mouse antibody was purchased from mpbio.
Cell cultivation and treatment
Mouse embryonic fibroblasts (MEFs) were routinely subcultivated in Dulbecco's modified essential medium (DMEM containing 5 g/L glucose) supplemented with 10% heat inactivated fetal calf serum and 2 mM glutamine and used up to passage 6. Except for traces of insulin from the added serum, no extra insulin was present during cultivation and experiments. For all experiments, cells were seeded in appropriate plates and grown to approximately 80–90% confluency and then rendered quiescent by depletion of serum (0.1% serum) for at least 18 h. For withdrawal of glucose, old medium was aspirated, cells were washed twice with phosphate-buffered saline (PBS) and then glucose free DMEM (Invitrogen) was added to cells for at least 24 h prior to assessment of the readout of interest. For pharmacological activation of Nrf2, cells were treated with 5 µM SFN for 3–7 h.
Determination of the cellular glucose uptake rate
MEFS were seeded into 12-well plates. After treatment as indicated cells were equilibrated in standard Krebs Ringer Phosphate HEPES (KRPH) buffer containing 0.2% bovine serum albumin (BSA) for 20 min. The glucose uptake was initiated by addition of 2-deoxy-D-glucose spiked with 2-deoxy-D-(1H3)-glucose (final concentrations 0.1 mM and 0.45 µCi/mL). After 15 min the reaction was stopped by three rapid washes with ice-cold PBS. The glucose uptake rate was determined by liquid scintillation counting (Perkin Elmer, Waltham, MA, USA) of cell lysates (lysis by 0.05 N NaOH in PBS) and normalized to protein content assessed by the Bradford protein assay and uptake time (to obtain incorporated moles of glucose per milligram of protein per minute).
Determination of the extracellular lactate as marker for glycolysis
MEFs were seeded into 24-well plates. After treatment as indicated cells were washed with PBS and then incubated with KRPH buffer supplemented with 0.2% BSA and 10 mM glucose for 2 h. Then supernatants were analyzed for their lactate content via an enzyme-coupled and fluorescent assay, and cells were lysed and their protein content was determined. Briefly, one volume supernatant (usually diluted 1:20) was mixed with one volume assay buffer (KRPH buffer with 10 µM Amplex Red, 1 U/mL lactate oxidase and 2.5 U/mL horseradish peroxidase), incubated for 10 min and then read in a flourimeter at an excitation wavelength of 535 nm and emission wavelength of 590 nm. Parallel monitoring of solutions with known concentrations of lactate facilitated a final readout of moles of lactate per gram of protein per minute.
Determination of cellular ATP levels
MEFs were prepared in 12-well plates. After treatment as indicated cells were detached, and an aliquot of the cell suspension was counted in a Vicell cell viability analyzer (Beckman) to obtain the number of cells per milliliter. Another aliquot was analyzed in a ATP sensitive luminescence kit (Cell Titer Glo, Promega) according the manufacturer's instructions. ATP was quantified by parallel assessment of a standard curve with known concentrations of ATP. This allowed moles of ATP per cell as the final readout. ATP derived from glycolysis was determined by blocking mitochondrial ATP production by 6 µM oligomycin (OM), and ATP originating from OXPHOS was monitored in the presence of the glycolytic inhibitor 20 mM deoxyglucose (DOG) or 200 µM 3-bromopyruvate (3BP). The portion of glycolytic ATP was then determined as (ATP in the presence of OM/total ATP levels)×100, whereas the portion from OXPHOS was defined as (ATP in the presence of DOG or 3BP/total ATP levels)×100.
Determination of the NADPH/NADP ratio
MEFs were prepared in 12-well plates. After treatment as indicated, cells were subjected to an assessment of the cellular NADPH/NADP ratio with a kit from BioVision according to the manufacturer´s instructions.
Determination of the cellular level of reactive oxygen species (ROS)
MEFs were prepared in 12-well plates. After the indicated treatment, 10 µM H2DCF-DA (Invitrogen) were added to the cells. After 20 min, cells were detached by accutase treatment and analyzed in a flow cytometer (FACS Calibur, BD) recording the green fluorescence of oxidized DCF. The mean fluorescence of 10,000 analyzed cells (corrected for auto-fluorescence) was taken as readout for the intracellular ROS load. Exogenous redox stress was induced by addition of 25 µM menadione.
Interference with G6PD activity
Pharmacological inhibition of G6PD was obtained by incubation of cells with 100 µM dehydroandrostendione (DHEA). siRNA-mediated knockdown of the enzyme was obtained as follows. Cells were seeded in 6-well plates and transfected with siRNA using oligfectamine according to the manufacturers' instructions. siRNA directed against murine G6PD was from Ambion (silencerSelect) and applied in a final concentration of 100 nM, scrambled control siRNA was from Invitrogen. Knockdown was maximal between 24 and 48 h (as determined by western blot analysis) and ranged between 70% and 80% efficiency.
Real-time quantitative polymerase chain reaction (RTq-PCR)
RNA isolation and subsequent cDNA synthesis were performed according to the instructions of the manufacturer, using the PeqGOLD Total RNA kit (Peqlab) and Superscript™ First-Strand Synthesis System (Invitrogen), respectively. The real-time quantitative PCR (RTq-PCR) was carried out using Light Cycler™ LC480 SYBR Green I Master reagent (Roche Diagnostics) in a reaction volume of 15 µL. QuantiTect® Primer Assays for murine heme oxygenase 1 (target) and murine hypoxanthin-phosphoribosyl-transferase (reference) were obtained from Qiagen, diluted and aliquoted as recommended by the manufacturer. PCR contained one denaturation step (10 min at 95 °C) and up to 40 amplification cycles (annealing step: 30 s at 61 °C and elongation step: 15 s at 72 °C). Melting curves of the amplified DNA were analyzed to make sure that the PCR resulted in amplification of one specific product only. Data were analyzed using the Light Cycler™ LC480 Software (Roche Diagnostics) and the 2–ΔΔCt method.
Protein extraction, SDS-polyacrylamide electrophoresis and immunoblot analysis
MEFs were prepared in six-well plates. After the indicated treatments, cells were washed with ice-cold PBS and scraped into 100 µL standard RIPA buffer. After a short pulse of sonication, lysates were centrifuged to pellet insoluble debris. Supernatants were subjected to protein determination according to Bradford. Per lane of a gel, 10–20 µg protein were heat-denatured in 1× SDS sample buffer and then electrophoretically separated on 10% SDS polyacrylamide gels. After electrophoresis, proteins were transferred to an Immobilon (BioRad) membrane. Free binding sites of the membrane were blocked with 5% dry milk powder in Tris-buffered saline with Tween (TBS–T) before the membranes were probed with the antibodies of interest. Visualization of the antigen-antibody complex was achieved by enhanced chemoluminescence and recorded in Fuji LAS 3000 CCD camera. Densitometric analysis was performed using the AIDA software (Fuji).
Statistics
All experiments were performed at least three times. Unless stated otherwise, the bar graphs depict mean+SEM (standard error of the mean). Two groups were compared using Student´s t test, more groups were analyzed by one- or two-way ANOVA depending on the number of variables in the investigated data sets, followed by Dunnett's or Bonferroni's post test. All statistical analyses were done with GraphPad Prism. Differences with p-values<0.05 were considered as significant and are designated with * in the figures.
Results
In order to get a first insight into a potential interdependence between Nrf2-mediated cytoprotection and glucose metabolism, we assessed the cellular glucose uptake rate upon activation of Nrf2. Knockout of Keap1 or pharmacological Nrf2 activation by SFN increased the cellular glucose uptake rate approximately two-fold and 1.5-fold, respectively, compared to the respective control cells (Fig. 1A). Nrf2 knockout cells failed to exhibit an increased cellular glucose uptake rate upon treatment with SFN, demonstrating Nrf2-dependency and excluding an unspecific effect of the small molecule (Fig. 1B). Moreover, cells with activated Nrf2, be it by knockout of Keap1 or treatment with SFN, were less capable of coping with glucose withdrawal over time and showed significantly decreased viability compared to control cells with basal Nrf2 activity (Fig. 1C). A control experiment performed in parallel in the presence of glucose revealed unaltered cell viability over time excluding a time-dependent negative impact of SFN or Keap1 knockout on cell viability (data not shown).
Fig. 1.

Activation of Nrf2 results in increased cellular glucose uptake and glucose addition. (A) In quiescent mouse embryonic fibroblasts Nrf2 was activated (black bars) either by knockout of Keap1 (Keap1−/−) or treatment with sulforaphane (SFN, 5 µM) for 7 h. The cellular glucose uptake rate was determined as described in Materials and methods. The graph compiles data of three independent experiments expressed as fold increases compared to wildtype (WT) cells with basal Nrf2 activity (* p<0.05, Student's t-test, mean+SEM). (B) Quiescent WT and Nrf2−/− MEFs were treated with vehicle (DMSO, D) or 5 µM SFN for 7 h before their glucose uptake rate was determined. The graph compiles data of three independent experiments expressed as fold increases compared to vehicle-treated control cells (⁎p<0.05, Student's t-test, mean+SEM).(C) Control cells with basal Nrf2 activity and cells with activated Nrf2 (treatment with 5 µM SFN or Keap1−/− cells) were cultivated in absence of glucose as indicated. After the given periods of time cell viability was assessed based on Trypan Blue exclusion and analyzed in an automated cell viability analyzer. The depicted graph compiles data from three independent experiments. (* p<0.05 (compared to WT cells at the respective time point, ANOVA, mean+SEM)).
Next, we aimed for deciphering the metabolic route of the plus of ingested glucose. We determined the rate of aerobic glycolysis upon activation of Nrf2. The excreted lactate levels, a surrogate marker of glycolysis, were comparable between control cells, cells with genetically or pharmacologically activated Nrf2 and cells with depleted Nrf2 (Fig. 2A). Cellular ATP levels remained unchanged demonstrating that glucose is not diverted for energy production upon activation of Nrf2 (Fig. 2B). Moreover, the portions of ATP derived from oxidative phosphorylation and glycolysis determined in the presence of DOG or 3BP and oligomycin, respectively, (see also Materials and methods) were not significantly different between control cells and cells with activated Nrf2 (data not shown). We further examined the cellular ratio of NADPH/NADP, as readout for the activity of the pentose phosphate pathway (PPP) which routes glucose-6-phosphate into production of NADPH and ribose-5-phosphate. Keap1−/− cells display significantly higher cellular NADPH levels than WT cells (Fig. 2C), in line with the notion that several enzymes of the PPP are under the control of Nrf2 [5]. Inhibition of the key enzyme of the PPP, glucose-6-phosphate dehydrogenase (G6PD), by dehydroandrostendione (DHEA) [11] abolished the increase of NADPH, showing that G6PD and the PPP are the main sources of the observed elevated NADPH. Also WT cells treated with the Nrf2 activator SFN possess a significantly higher NADPH/NADP ratio than vehicle-treated cells, whereas Nrf2−/− cells fail to respond to SFN treatment and hereby confirm the Nrf2-dependent action of SFN (Fig. 2D).
Fig. 2.
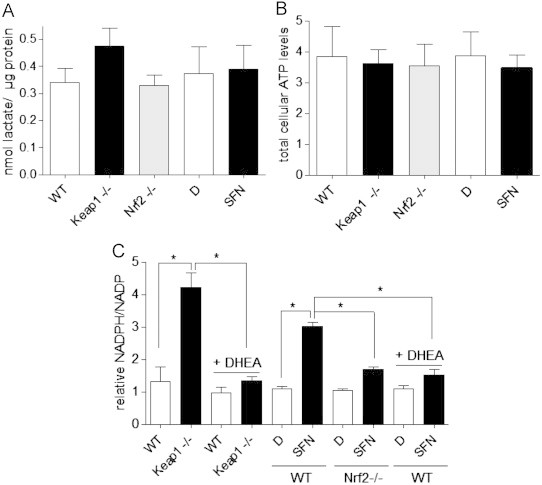
Activation of Nrf2 does neither alter the cellular glycolytic rate nor ATP production, but enhances the cellular NADPH/NADP ratio. (A) The production of lactate by MEFs with basal (white bars, DMSO(D) or WT), activated (black bars, SFN (5 µM, 7 h) or Keap1−/−) or lacking Nrf2 (gray bars) activity was determined as a readout for the cellular glycolytic activity and normalized to the protein concentration derived from the cells. The bar graph depicts compiled data of three independent experiments. (B) MEFs with basal (white bars, DMSO(D) or WT), activated (black bars, SFN (5 µM, 7 h) or Keap1−/−) or lacking Nrf2 (gray bars) activity were examined for their total ATP levels normalized to cell count as described in Materials and methods (mM/cell). The bar graph depicts compiled data of three independent experiments. (C) The cellular NADPH/NADP ratio was determined in cells with basal (white bars, WT and D(MSO), respectively) and activated Nrf2 (black bars, Keap1−/− and SFN (5 µM, 7 h), respectively) as described in Materials and methods and referred to the value of untreated WT cells. Glucose-6-phosphate dehydrogenase was inhibited by 100 µM dehydroandrostendione (DHEA) and revealed the pentose phosphate pathway as main source of NADPH. Nrf2−/− MEFS confirmed Nrf2-dependency of the increased NADPH/NADP upon SFN treatment. (n=3; * p<0.05, ANOVA, Bonferroni, mean+SEM).
NADPH is a pivotal source of reducing equivalents and required for enzymatic regeneration of the reduced forms of the cellular redox buffers thioredoxin and glutathione, as well as cofactor for several Nrf2-dependent detoxification genes including NAD(P)H:quinone oxidoreductase 1 (NQO1). We therefore checked the reliance of the Nrf2-controlled ROS detoxification on glucose availability and a functional PPP. Cells are significantly less capable of detoxifying imposed redox stress upon activation of Nrf2 by SFN when glucose is depleted or G6PD is inhibited either by DHEA or by siRNA-mediated knockdown (average obtained knockdown 70–80%). Detoxification of menadione-induced ROS by SFN is Nrf2-dependent since it is blunted in Nrf2−/− cells (Fig. 3A). Moreover, Keap1−/− cells cannot detoxify menadione-induced redox stress to the same extent upon glucose depletion or inhibition of G6PD as in the presence of glucose and an intact PPP (Fig. 3B). Interestingly, the impact of glucose depletion or of interference with G6PD activity becomes evident not only at the functional detoxification of ROS, but already on the level of Nrf2 target gene expression. Withdrawal of glucose or inhibition of G6PD activity by DHEA abrogates the induction of the selected antioxidant Nrf2-target genes glutathione reductase (GR) or heme oxygenase-1 (HO-1) by SFN (Fig. 3C). To corroborate that G6PD and a functional PPP are needed for proper Nrf2-mediated gene transcription we further checked expression of HO-1 in cells with depleted G6PD. Cells with reduced G6PD levels fail to up-regulate HO-1 upon genetic and pharmacological activation of Nrf2, both on the protein- (Fig. 3D) and mRNA- (Fig. 3E) levels. We also confirmed Nrf2-regulation of G6PD as seen by elevated G6PD levels upon Nrf2 activation. Supplementation with an exogenous enzymatic NADPH generating system rescues protein expression of GR and HO-1 in cells that were treated with DHEA or depleted from glucose (Fig. 4A). Exogenous NADPH also restored Nrf2-dependent HO-1 expression on the mRNA level in cells that were deprived of glucose or G6PD activity (Fig. 4B).
Fig. 3.

Supply with glucose and a functional pentose phosphate pathway are necessary for the Nrf2-dependent detoxification of ROS and expression of selected Nrf2 target genes. (A) WT MEF, either kept in medium plus glucose or without glucose (−glc) or with impaired G6PD activity (DHEA, siG6PD) were treated with DMSO (D, white bars) or 5 µM SFN (7 h; black bars) and stressed with menadione (25 µM) as indicated. Nrf2−/− MEF served as control for Nrf2-dependent action of SFN. Then their intracellular ROS levels were determined based on fluorescence of oxidized DCF by flow cytometry (large panel). The insert depicts the extent of SFN-mediated detoxification of menadione-induced redox stress ([1-(ΔROS(+menadione/−menadione)SFN/−(ΔROS (+menadione/−menadione)DMSO)]×100) under each condition (n=3; * p<0.05, ANOVA, Dunnett, mean+SEM). (B) Intracellular ROS levels in Keap1−/− MEFs were determined in the basal state and after imposure of exogenous oxidative stress by 25 µM menadione under control conditions (ctrl), upon withdrawal of glucose (−glc), inhibition of G6PD by DHEA (100 µM) or knockdown of G6PD (siG6PD). The graph depicts the extent of menadione-induced redox stress in each condition (i.e., ΔROS (+menadione/−menadione)) (n=3; * p<0.05, ANOVA, Bonferroni, mean+SEM). (C) WT MEFs were treated with SFN (5 µM) in the presence of glucose or the G6PD inhibitor DHEA (100 µM) as indicated for 7 h before the expression level of the Nrf2 target genes glutathione reductase (GR) and heme oxygenase (HO-1) as well as the loading control actin were determined by western blot analysis. Representative blots out of three independent experiments are depicted. The numbers below the blot indicate the relative densitometric mean of all performed experiments (normalized to the respective loading control). (D) MEFs were transfected with either scrambled (scr) siRNA or siRNA directed against G6PD as indicated. Activation of Nrf2 was then obtained either by Keap1 knockout (genetic g) or treatment with SFN (5 µM) for 7 h (pharmacological p). Cell lysates were subjected to western blot analysis for HO-1, G6PD and actin. Representative blots out of three independent experiments are depicted. The numbers below the blots indicate the relative densitometric mean of all performed experiments (normalized to the loading control). (E) MEFs were transfected with either scrambled (scr) siRNA or siRNA directed against G6PD as indicated. Activation of Nrf2 was then obtained either by Keap1 knockout (g) or treatment with 5 µM SFN (p) for 3 h. mRNA levels of HO-1 were determined by RTqPCR analysis. (n=3, * p<0.05, ANOVA, Bonferroni, mean+SEM).
Fig. 4.

A functional pentose phosphate pathway and subsequent supply with NADPH is pivotal for Nrf2-mediated expression of HO-1 and GR. (A) WT MEFS were treated as indicated with SFN (5 µM) for 7 h, in the absence of glucose, the presence of DHEA (100 µM) or supplementation with an exogenous NADPH regeneration mix in the medium as indicated. Cell lysates were subjected to western blot analysis for the Nrf2 target genes HO-1 or GR as well as for actin as loading control. Representative blots out of three independent experiments are depicted. The numbers below the blots indicate the relative densitometric mean of all performed experiments (normalized to the loading control). (B) WT MEFS were treated as indicated with SFN (5 µM) for 3 h, in the absence of glucose, the presence of DHEA (100 µM) or supplementation with an exogenous NADPH regeneration mix in the medium as indicated. HO-1 mRNA levels were determined by RTqPCR analysis. (n=3, * p<0.05, ANOVA, Bonferroni, mean+SEM).
Based on these findings we conclude that Nrf2 activation boosts cellular glucose uptake and metabolism through the PPP to provide NADPH which is pivotal for Nrf2-mediated ROS detoxification on the functional and transcriptional level.
Discussion
In this study we demonstrate the metabolic facet of the cytoprotective transcription factor Nrf2. Our findings underline the notion that activation of transcription factors or cellular signaling events, which ultimately result in an altered gene expression and a changed cellular phenotype (e.g. proliferation and inflammation), is inseparably coupled with changes in cellular metabolism and vice-versa [12]. This is not different upon activation of Nrf2. In order to cope with the cellular demand of an increased antioxidant response, cells take up more glucose and shuttle it through the PPP for NADPH production, in line with the notion of PPP enzymes being Nrf2 target genes themselves. NADPH is crucial for maintaining an intact cellular buffer system against redox stress by providing reducing equivalents to allow glutathione or thioredoxin redox cycling. In addition, NADPH is a cofactor of NQO1, a validated Nrf2 target gene and involved in detoxification of quinones. NQO1 may, thus, be involved in the detoxification of menadione-induced redox stress upon Nrf2 activation, as seen in Fig. 3. As we show here, interference with the flux of glucose through PPP hampered not only ROS detoxification on the functional level due to insufficient NADPH availability but already on the level of Nrf2-triggered gene expression. The expression of ROS detoxification enzymes seems to be halted if sufficient supply with necessary co-factors is not guaranteed. Such feedback regulation may spare the cell from futile de novo protein expression. A link between the PPP and the transcriptional antioxidant response upon an oxidative insult has already been reported in yeast [13], and is very likely to be mediated by Nrf2 in mammalian cells.
Our findings raise several issues which warrant further detailed investigations at the interface of Nrf2-dependent cellular detoxification and glucose metabolism. In light of the observed increased cellular glucose uptake rate obvious questions concern the connection between insulin signaling and Nrf2 on the one side, and level and localization of glucose transporters after Nrf2 activation on the other. Of note, insulin signaling is reported to activate Nrf2 [14] and both insulin and Nrf2 activation trigger cellular glucose uptake. The detailed causal connection and interdependency are not resolved yet. It is tempting to speculate, though, that insulin, besides its anabolic effects, activates Nrf2 which then accounts for detoxification of elevated glucose levels and by-products (such as redox stress). A very recent study observed elevated Glut1 levels in brown adipose tissue due to graded knockdown of Keap1 [15]. It will be furthermore of interest to elucidate the molecular sensor of the actual NADPH/NADP ratio that decides whether or not Nrf2-dependent gene transcription occurs, and at what level Nrf2 signaling is interrupted. We have seen reduced Nrf2-dependent protein and mRNA expression upon interference with the PPP. However, it is still unresolved whether nuclear translocation or stabilization of Nrf2 is also affected. We have selected HO-1 and GR as representative Nrf2-target genes and observed that their expression is impaired upon withdrawal of glucose and disruption of the PPP, respectively. It will be of interest to examine in a future unbiased microarray analysis whether all Nrf2-dependent genes are equally affected or if there are differences between different promoters or functional clusters of Nrf2-dependent target genes. Moreover, it will be of importance to analyze whether different pharmacological activators show distinct dependency on glucose to trigger Nrf2 activation. We have made our observations in non-malignant mouse embryonic fibroblasts. Future studies are warranted to investigate the metabolic shade of Nrf2 in differentiated specialized cell types. It will be e.g. of interest to see how Nrf2 activation affects the synthesis of fatty acids and cholesterol in hepatocytes as these processes also need NADPH. Since fatty acid synthase is negatively regulated by Nrf2 [16], it is conceivable that Nrf2 activation directs NADPH mainly to the antioxidant machinery and not towards reductive biosyntheses. Moreover, it will be necessary to confirm our in vitro observations made in cell culture in appropriate in vivo/organ models in order to consider application of Nrf2 activators/inhibitors in pathological settings. Chronically high blood glucose levels, as found in patients with diabetes and insulin resistance, are linked with increased redox stress, also due to the flux of glucose through the polyol and hexosamine pathway. Future studies should clarify whether activation of Nrf2 in these conditions could exert a double beneficial action by (i) increasing the cellular glucose uptake and diverting glucose to the PPP and (ii) concomitantly boosting the cellular antioxidant response. Studies demonstrating better glucose tolerance and insulin sensitivity after Nrf2 activation in animal model of diabetes are in line with this idea [15,17,18].
Overall, Nrf2 is a prominent player in protecting the cell against oxidative and xenobiotic insults. In this study we revealed that activation of Nrf2 goes along with increased cellular uptake and metabolism of glucose through the PPP. The subsequent production of NADPH is crucial for allowing not only functional detoxification of ROS but also Nrf2-controlled gene expression to occur. This is the first report to show that Nrf2-mediated detoxification is connected with a specific metabolic program in non-malignant mammalian cells. Availability of glucose and a functional PPP are apparent prerequisites for Nrf2 to fully exert its cytoprotective properties already at the level of gene expression.
Funding
This study was in part supported by grants from the Austrian Science Fund (FWF; P23317 to E.H.H.), the Herzfelder`sche Familienstiftung as well as the graduate program “BioProMoTion” from the University of Vienna.
Contribution of authors
E.H.H. conceived the study, performed experiments, analyzed and interpreted data as well as wrote the manuscript. D.S. and K.Z. performed experiments. V.M.D. critically commented the manuscript. All authors read and agreed on the final version of this manuscript.
Acknowledgments
The authors thank T. Kensler for providing us WT, Nrf2−/− and Keap1−/− mouse embryonic fibroblasts.
Footnotes
This is an open-access article distributed under the terms of the Creative Commons Attribution-NonCommercial-No Derivative Works License, which permits non-commercial use, distribution, and reproduction in any medium, provided the original author and source are credited.
References
- 1.Bryan H.K., Olayanju A., Goldring C.E., Park B.K. The Nrf2 cell defence pathway: Keap1-dependent and -independent mechanisms of regulation. Biochemical Pharmacology. 2013;85:705–717. doi: 10.1016/j.bcp.2012.11.016. [DOI] [PubMed] [Google Scholar]
- 2.Kensler T.W., Wakabayashi N., Biswal S. Cell survival responses to environmental stresses via the Keap1-Nrf2-ARE pathway. Annual Review of Pharmacology and Toxicology. 2007;47:89–116. doi: 10.1146/annurev.pharmtox.46.120604.141046. [DOI] [PubMed] [Google Scholar]
- 3.Copple I.M. The Keap1-Nrf2 cell defense pathway- a promising therapeutic target. Advances in Pharmacology. 2012;63:43–67. doi: 10.1016/B978-0-12-398339-8.00002-1. [DOI] [PubMed] [Google Scholar]
- 4.Jeong W.S., Jun M., Kong A.N. Nrf2: a potential molecular target for cancer chemoprevention by natural compounds. Antioxidants & Redox Signaling. 2006;8:99–106. doi: 10.1089/ars.2006.8.99. [DOI] [PubMed] [Google Scholar]
- 5.Yates M.S., Tran T.W., Dolan Q.T., Osburn P.M., Shin W.O., McCulloc S., Silkworth C.C., takuchi J.B., Yamamoto M., William C.R., Liby K.T., Sporn M.B., Sutter T.R., Kensler T. Genetic vesrus cehmoprotective activation of Nrf2 signaling: overlapping yet distinct gene expression profiles between Keap knockout and triterpenoid-treated mice. Carcinogenesis. 2009;30:1024–1031. doi: 10.1093/carcin/bgp100. [DOI] [PMC free article] [PubMed] [Google Scholar]
- 6.Shin S., Wakabayashi N., Misra V., Biswal S., Lee G.H., Agoston E.S., Yamamoto M., Kensler T.W. NRF2 modulates arylhydrocarbon receptor signaling: influence on adipogenesis. Molecular and Cellular Biology. 2007;27:7188–7197. doi: 10.1128/MCB.00915-07. [DOI] [PMC free article] [PubMed] [Google Scholar]
- 7.Shin S., Wakabayashi J., Yates M.S., Wkabaysahi N., Dolan P.M., Aja S., Liby K.T., Sporn M.B., Yamamoto M., Kensler T.W. Role of Nrf2 in prevention of high-fat diet induced obesity by synthetic triterpenoid CDDO-IM. European Journal of Pharmacology. 2009;620:138–142. doi: 10.1016/j.ejphar.2009.08.022. [DOI] [PMC free article] [PubMed] [Google Scholar]
- 8.Pi J., Leung L., Wang W., Hou Y., Liu D., Yehuda-Shnaidman E., Lee C., Lua J., Kurtz T.W., Chang J.Y. Deficiency of Nrf2 results in impaired adipogenesis and protects against diet-induced obesity. Journal of Biological Chemistry. 2010;285:9292–9300. doi: 10.1074/jbc.M109.093955. [DOI] [PMC free article] [PubMed] [Google Scholar]
- 9.Mitsuishi Y., Takuchi K., Kawatani Y., Shibata T., Nukiwa T., Aburatani H., Yamamoto M., Motohashi H. Nrf2 redirects glucose and glutamine into anabolic pathways I metabolic reprogramming. Cancer Cell. 2012;22:66–79. doi: 10.1016/j.ccr.2012.05.016. [DOI] [PubMed] [Google Scholar]
- 10.Dinkova-Kostova A.T., Kostov R.V. Glucosinolates and isothiocyanates in health and disease. Trends in Molecular Medicine. 2012;18:337–347. doi: 10.1016/j.molmed.2012.04.003. [DOI] [PubMed] [Google Scholar]
- 11.Hamilton N.M., Dawson M., Fairweather E.E., Hamilstin N.S., Hitchin J.R., James D.I., Jones S.D., Jordan A.M., Lyons A.J., Samll H.F., Thomson G.J., Wadell I.D., Ogilvie D.J. Novel steroid inhibitors of glucose 6-phosphate dehydrogenase. Journal of Medicinal Chemistry. 2012;55:4431–4445. doi: 10.1021/jm300317k. [DOI] [PubMed] [Google Scholar]
- 12.Metallo C.M., Vander Heiden M.G. Metabolism strikes back: metabolic flux regulates cell signaling. Genes & Development. 2010;24:2717–2722. doi: 10.1101/gad.2010510. [DOI] [PMC free article] [PubMed] [Google Scholar]
- 13.Krüger A., Grüning N.M., Wamelink M.M., Kerick M., Kirpy A., Parkhomchuk D., Bluemlein K., Schweiger M.R., Soldatov A., Lehrach H., Jakobs C., Ralser M. The pentose phosphate pathway is a metabolic redox sensor and regulates transcription during the antioxidant response. Antioxidants & Redox Signaling. 2011;15:311–324. doi: 10.1089/ars.2010.3797. [DOI] [PubMed] [Google Scholar]
- 14.Wang X., Wu H., Chen H., Liu R., Liu J., Zhang T., Yu W., Hai C. Does insulin bolster antioxidant defenses via the extracellular signal-regulated kinases-protein kinase B-nuclear factor erythroid 2 p45 related factor 2 pathway? Antioxidants & Redox Signaling. 2012;15:1061–1070. doi: 10.1089/ars.2011.4460. [DOI] [PubMed] [Google Scholar]
- 15.Uruno A., Furusawa Y., Yagishita Y., Fukutomi T., Muramatsu H., Negishi T., Sugawara A., Kensler T.W., Yamamoto M. The Keap1-Nrf2 system prevents onset of diabetes mellitus. Molecular and Cellular Biology. 2013;33:2996–3010. doi: 10.1128/MCB.00225-13. [DOI] [PMC free article] [PubMed] [Google Scholar]
- 16.Tanaka Y., Aleksunes L.M., Yeager R.L., Gyamfi M.A., Esterly N., Guo G.L., Klaassen C.D. NF-E2-related factor 2 inhibits lipid accumulation and oxidative stress in mice fed a high-fat diet. Journal of Pharmacology and Experimental Therapeutics. 2008;325:655–664. doi: 10.1124/jpet.107.135822. [DOI] [PubMed] [Google Scholar]
- 17.Aleksunes L.M., Reisman S.A., Yeager R.L., Goedken M.J., Klaassen C.D. Nuclear factor erythroid 2-related factor 2 depletion impairs glucose tolerance and exacerbates hyperglycemia in type 1 diabetic mice. Journal of Pharmacology and Experimental Therapeutics. 2010;333:140–151. doi: 10.1124/jpet.109.162271. [DOI] [PMC free article] [PubMed] [Google Scholar]
- 18.Yu Z., Shao W., Chiang Y., Foltz W., Zhang Z., Ling W., Fantus I.G., Jin T. Oltipraz upregulates the nuclear factor ( erythroid-derived 2)-like 2 (NRF2) antioxidant system and prevents insulin resistance and obesity induced by a high-fat diet in C57BL/6J mice. Diabetologia. 2011;54:922–934. doi: 10.1007/s00125-010-2001-8. [DOI] [PubMed] [Google Scholar]