

Abstract
Due to its short lifespan, ease of use and age-related pathologies that mirror those observed in humans, the common marmoset (Callithrix jacchus) is poised to become a standard nonhuman primate model of aging. Blood and extracellular fluid possess two major thiol-dependent redox nodes involving cysteine (Cys), cystine (CySS), glutathione (GSH) and glutathione disulfide (GSSG). Alteration in these plasma redox nodes significantly affects cellular physiology, and oxidation of the plasma Cys/CySS redox potential (EhCySS) is associated with aging and disease risk in humans. The purpose of this study was to determine age-related changes in plasma redox metabolites and corresponding redox potentials (Eh) to further validate the marmoset as a nonhuman primate model of aging. We measured plasma thiol redox states in marmosets and used existing human data with multivariate adaptive regression splines (MARS) to model the relationships between age and redox metabolites. A classification accuracy of 70.2% and an AUC of 0.703 were achieved using the MARS model built from the marmoset redox data to classify the human samples as young or old. These results show that common marmosets provide a useful model for thiol redox biology of aging.
Keywords: Cysteine, Cystine, Glutathione, Marmoset, Plasma
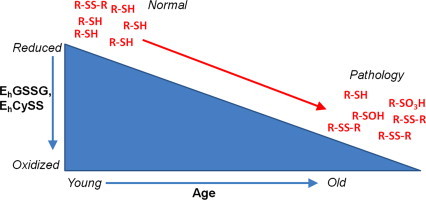
Graphical abstract
Highlights
-
•
Characterization of the Common Marmoset as a model for aging research.
-
•
Plasma thiol redox measurements in marmosets ranging in age from 2–16 years.
-
•
Similar to humans, marmosets exhibit age-related alterations in plasma thiol redox metabolites.
-
•
Marmoset redox data can be used to classify humans as young or old.
Introduction
To gain mechanistic insight into the biomarkers and processes involved in age-related diseases, such as cardiovascular disease, cancer and neurodegenerative diseases like Parkinson′s disease and Alzheimer′s disease, an animal model of aging that exhibits phenotypes similar to the human condition must be developed. Nonhuman primates, due to their close phylogenic relationship to humans, exhibit physiological processes that occur in humans. The most common nonhuman primate species used in aging research is the relatively large and long-lived rhesus macaque (Macaca mulatta); the size of this species and its long maximum lifespan of 40 years limits the practical use of this model [18]. Thus, a nonhuman primate model employing a species with a short lifespan would be optimal.
The common marmoset (Callithrix jacchus), a New World primate, offers a valuable resource as an animal model to investigate disease risk and aging due to the fact that these primates have the shortest lifespan and fastest reproduction of any anthropoid primate [15]. Marmosets are small primates, with adults weighing only 350–450 g. These animals mature by 18 months to 2 years of age and reach old age by 8 years. Adult females give birth to approximately 3–5 offspring per year [1], and similar to humans, marmosets live in compact and stable family groupings. Because of these characteristics, marmosets are perhaps the least expensive primate to maintain in a biomedical laboratory [1]. It should also be noted that the evolutionary time of divergence between humans and marmoset (∼43 million years ago) is much more recent than the human with mouse (∼92 mya), fly (∼780 mya), nematode (∼938 mya) or yeast (∼1215 mya) (http://www.timetree.org) (Fig. 1). Lastly, marmosets have a lower zoonotic risk of human disease transfer, e.g. transfer of herpes B virus, compared to macaques and humans [1,18]. Together, the short lifespan, small body size, and low zoonotic risk make these primates a desirable model for aging research.
Fig. 1.
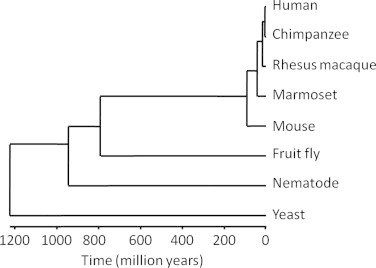
Phylogenetic tree of humans, several non-human primates, and four classic model organisms used in aging research. The horizontal axis represents the time, in millions of years, since a species diverged. The human-marmoset divergence is estimated to have occurred approximately 42.6 million years ago. By contrast, humans and fruit flies diverged approximately 782 million years ago.
Oxidative stress was first defined as “an imbalance between oxidant production and antioxidant capacity”; however, a more useful contemporary definition is “a disruption of redox signaling and control” [9]. During the process of aging, GSH levels decline and this piece of evidence supports the concept that oxidative stress increases with aging. Plasma GSH/GSSG and Cys/CySS redox potentials (Eh) become oxidized due to advancing age and age-related co-morbidities [8]. The redox state of plasma is largely determined by the redox state of Cys/CySS and, in humans, this redox couple can be used as a means to assess oxidative stress in a clinical setting [2]. For example, plasma CySS increases at a linear rate in humans as they age [12] and is associated with markers of impaired arterial elasticity and adverse outcomes [14].
Due to phenotypes exhibited by marmosets that represent features present in aging humans [1,15,18], we investigated age-related changes in plasma redox status in marmosets. Using plasma isolated from marmosets ranging in age from 2 to 16 years, we employed an HPLC method to study age-related changes in plasma GSH, GSSG, Cys, CySS, mixed disulfide (CySSG) and corresponding redox potentials of these redox couples (EhGSSG and EhCySS). Our results were in relative agreement with previously published results obtained from human samples [12], such as age-related increases in plasma CySS and GSSG, and these data further characterize the marmoset as a model of human aging.
Materials and methods
Animals
Common marmosets (Callithrix jacchus) (72 total animals; 36 male, 36 female) ranging in age from 2–16 years were housed at the New England Primate Research Center and were maintained as described by protocols approved by the Institutional Animal and Use Committee. The animals received commercial marmoset chow (New World Primate Chow 8791, Harlan Teklad, Indianapolis, IN) and were supplemented daily with a combination of fresh fruits, vegetables, seeds, eggs and/or mealworms. Water was provided ad libitum in polycarbonate water bottles. Husbandry of this marmoset colony has been previously described [17]. Blood samples were obtained during the marmosets′ quarterly physical examinations after sedation with 0.2 mL of ketamine i.m.
HPLC analysis of GSH, GSSG, Cys and CySS
Samples were prepared and derivatized using a previously described protocol [11]. Briefly, blood was collected during quarterly physical examinations under ketamine sedation, and 0.5 ml of whole blood was immediately transferred into a microcentrifuge tube containing a redox preservation solution. This preservation solution minimizes artifactual autooxidation and hemolysis of the samples [11]. Following centrifugation, 300 μl of supernatant was added to 300 μl of 10% (w/v) perchloric acid containing 0.2 M boric acid and 10 μM γ-Glu–Glu as an internal standard. The samples were then derivatized with dansyl chloride to form N-dansyl derivatives and analyzed by HPLC with fluorescence detection using a Waters Alliance 2695 separations module and Waters 2475 multi-wavelength fluorescence detector (excitation: 335 nm; emission: 518 nm). The metabolites were identified by co-elution with standards, and quantification was achieved by integration relative to the internal standard, γ-Glu–Glu [11].
Calculation of redox potentials
The redox potentials (Eh) of the plasma thiol/disulfide pools were calculated using the Nernst equation, Eh=Eo+RT/nF ln[disulfide]/[thiol]2, where Eo is the standard redox potential for the specific couple, R is the gas constant, T is the absolute temperature, n is 2 for the number of electrons transferred, and F is Faraday′s constant. The Eo value used for the GSH/GSSG redox potential (EhGSSG) was −264 mV, which was based upon the value of −240 mV for pH 7.0 [16]. The Eo value used to calculate the Cys/CySS redox potential (EhCySS) was −250 mV (pH 7.4) [10].
Statistical analyses
Data were analyzed and graphed using R. The data were scale transformed such that each biomarker had a mean of zero and standard deviation of one. Normality tests were conducted using the Anderson–Darling test. Spearman correlation analysis followed by a significance test based on t-test was performed to study the association between the metabolites. Outliers were detected based on Tukey′s rule prior to generating boxplots (20). For each variable, values less than Q1−1.5×IQR and greater than Q3+1.5×IQR criteria were replaced by the minimum and the maximum of the remaining data points. Significance level of 0.05 was used for all statistical tests.
Regression analysis
Because previous research in humans demonstrated non-linear age associated relationships, Multiple Adaptive Regression Splines (MARS) method implemented in the earth package (http://www.milbo.users.sonic.net/earth/) in R was used to investigate the relationship between age and redox metabolites with and without sex as a covariate [1–3]. MARS is a non-parametric method that generates piecewise linear basis functions for each variable xi of the form, max(0,xi−t) and max(0,t−xi) These functions are called hinge functions, h(x). The knots are formed at a constant t, which is an observed value in the original data of the predictor variable xi. This approach allows the non-linear modeling of the relationship between the predictor and outcome variables. The MARS method has been previously reported to detect complex biological interactions, such as SNP-SNP and histone-histone interactions [4,5]. The hinge functions were derived from MARS using the transformed redox metabolite concentrations and redox potentials as outcome measures and age as a predictor variable with and without sex as a covariate. MARS models were built using ten-fold cross-validation procedure, where nine tenths of the data is used for training and the remaining one tenth is used for evaluation. The performance of the models was evaluated according to the Generalized Cross Validation (GCV) value and the R2 values, where GCV evaluates the fit of the models and penalizes models based on the number of effective parameters in the models and R2 provides an estimate of how well the model fits the data. A model with low GCV is preferred to avoid overfitting. The hinge functions selected after the MARS modeling step were then used as input for regression analysis using generalized linear models.
Predictive analysis
The MARS method was used to perform classification analyses using age as a binary response, 0 for young and 1 for adults, and the redox metabolites as predictor variables. Each model was allowed terms with up to 3° of interaction. MARS models at different degree levels were evaluated according to the Area Under the Receiver Operating Characteristic Curve (AUC) in order to evaluate the discriminatory power of the models.
Results
Samples collected from 72 healthy marmosets during regularly scheduled health examination; this population contained equal numbers of males (36) and females (36), with relatively equal numbers of males and females (40–75%) in each 2-year age group. An age and sex breakdown of the study population is described in Table 1. The majority of the animals (63%) were aged 8 years or less, while 37% of the animals were over the age of 8 years and considered “aged” [1].
Table 1.
Age and sex distribution of marmosets used in this study.
| Age range (years) | Number of animals (%) | % Male |
|---|---|---|
| 0–2 | 8 (11) | 63 |
| 3–4 | 14 (19) | 57 |
| 5–6 | 12 (17) | 50 |
| 7–8 | 11 (15) | 45 |
| 9–10 | 11 (15) | 45 |
| 11–12 | 7 (10) | 57 |
| 13–14 | 4 (6) | 75 |
| 15–16 | 5 (7) | 40 |
| All ages | 72 (100) | 50 |
Scatter plots were generated and a multiple regression model was employed to evaluate data trends with respect to age (Fig. 2). Trend lines (green lines) and the regression analysis show significant age dependent increase in plasma GSSG concentration (p<0.001) (Fig. 2E) and increased oxidation of EhGSSG (p<0.001) (Fig. 2F). A trend was also observed for plasma Cys (p=0.085) (Fig. 2A). Finally, according to the scatter plots, corresponding trend lines, and regression analyses, plasma CySS (p=0.424) (Fig. 2B), GSH (p=0.987) (Fig. 2D) and mixed disulfide (p=0.590) (CySSG; Fig. 2G) were relatively unchanged due to aging.
Fig. 2.
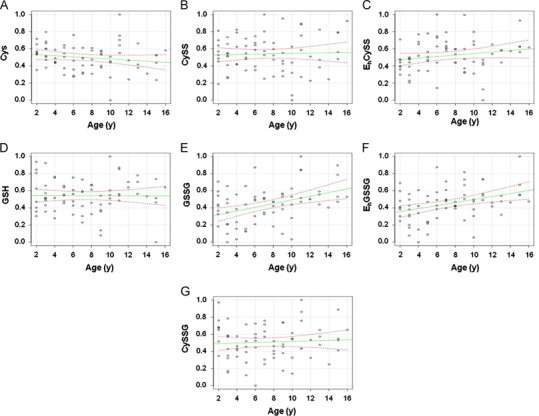
Plasma thiol metabolites and redox potentials plotted as a function of age (years). The data were transformed and normalized as described in the Method section. Values for each metabolite were also scaled using min/max scaling with the minimum value equal to zero and the maximum equal to one. The green line represents the linear trend and the dotted red lines indicate the 95% confidence interval.
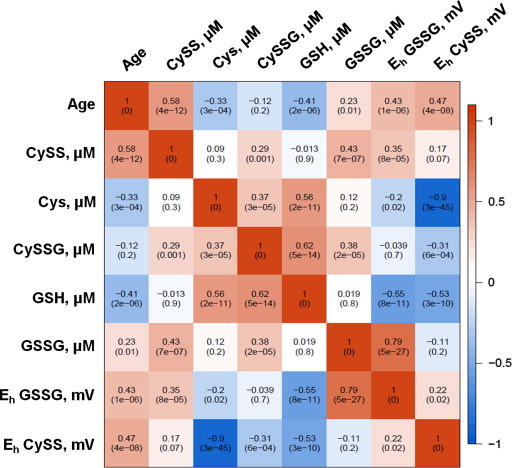
A Spearman correlation analysis was performed to determine the association of redox metabolites and redox potentials with age and with each other (Fig. 3). GSSG and Cys redox metabolites and their redox potentials (EhGSSG and EhCySS) were found to be associated with age at a significance level of 0.05. Strong associations were observed between the reduced and oxidized forms of the metabolites, which are in concordance with the physiological role of these metabolites. Similar analysis was performed on human plasma redox data taken from a previously published study from our laboratory [7], (Fig. 4). The associations of the metabolites with age in humans were similar to the marmosets with the exception of CySS and GSH. These metabolites were found to be significantly associated with age in humans, but not in this cohort of marmosets. This discrepancy could be due to differences in data collection and analysis, differences in age/sex distribution between the two studies, or due to human consumption of dietary sulfur amino acids that far exceeds nutritional requirements.
Fig. 3.
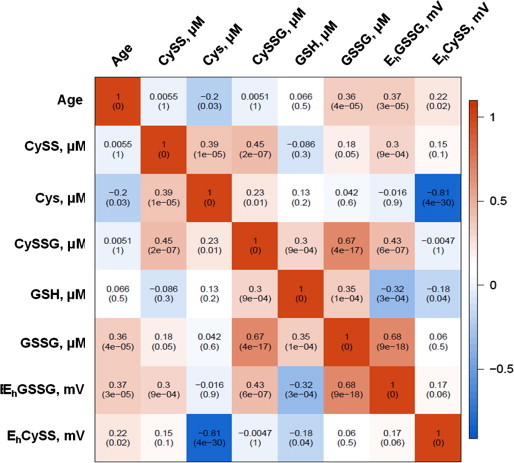
A heat map representation of the Spearman correlation matrix of the marmoset plasma metabolites. Spearman correlation was calculated for each metabolite, redox potential and age is located in each cell of the matrix. The p-value of the correlation is in parentheses.
Fig. 4.
A heat map representation of the Spearman correlation matrix of the human plasma metabolites [11]. Spearman correlation was calculated for each metabolite, redox potential and age is located in each cell of the matrix. The p-value of the correlation is in parentheses.
MARS and GLM models were used to determine the relationship between the metabolite concentrations and age. Non-linear spline functions associating age with metabolite concentrations were first obtained from MARS. These hinge functions were used as predictors in a generalized linear model with metabolite concentrations or redox potentials as outcome to estimate the fitting coefficient and significance of each hinge function (Tables 2 and 3). GSSG and the redox potentials, EhGSSG and EhCySS, were found to have statistically significant association with age without controlling for sex, at a significance level of 0.05. The relationship between GSSG and age was explained using two hinge functions, h (Age-8) where Age>8 and h (Age-11) where Age>11, at a significance level of 0.05. This suggests an increase in GSSG level between the ages of 8 and 11 and decrease thereafter. The plasma redox potential EhGSSG was found to increase in adult and old marmosets (age>4), and the EhCySS redox state was found to be significantly associated with age in both young marmosets (less than 4 years age) and old marmosets (greater than 10 years). Although the associations are significant, the results should be interpreted cautiously as the sample size at each time point was small. The effect of sex on the association between age and redox states was also evaluated by including sex as a covariate in the MARS and GLM models (Table 3 and Fig. 5). Sex was found to be significantly associated with CySS and CySSG. Specifically, the level of CySS was found to increase with age in females whereas CySSG was found to increase with age in young marmosets (age less than 4 years).
Table 2.
Results from Multiple Adaptive Regression Splines analyses: Age-dependent effects on redox states.
| Redox variable | MARS hinge function(s) | Coefficient | p-value | GCV* | R2 |
|---|---|---|---|---|---|
| GSSG | h(Age-8) | 0.398 | 7.36E-04 | 0.931 | 0.183 |
| h(Age-11) | −0.513 | ||||
| EhGSSG | h(Age-4) | 0.108 | 8.69E-04 | 0.915 | 0.147 |
| EhCySS | h(Age-4) | −0.389 | 2.18E-02 | 0.95 | 0.215 |
| h(Age-10) | −1.259 | 5.30E-04 | |||
| h(Age-11) | 1.726 | 1.20E-03 | |||
GCV=Generalized cross validation.
Table 3.
Age-dependent effects on plasma redox states after controlling for sex.
| Redox variable | MARS hinge function(s) | Coefficient | p-value | GCV⁎ | R2 |
|---|---|---|---|---|---|
| CySS | h(Sex-M) | 1.010 | 5.03E-06 | 0.796 | 0.259 |
| GSSG | h(Age-8) | 0.398 | 7.36E-04 | 0.930 | 0.183 |
| h(Age-11) | −0.513 | 1.80E-02 | |||
| CySSG | h(Age-4) | 0.085 | 2.31E-02 | 1.0089 | 0.166 |
| h(4-Age) | 0.554 | 5.72E-03 | |||
| h(Sex-M) | 0.527 | 1.99E-02 | |||
| EhGSSG | h(Age-4) | 0.108 | 8.69E-04 | 0.915 | 0.147 |
| EhCySS | h(6-Age) | −0.232 | 4.34E-03 | 0.96 | 0.207 |
| h(Age-11) | 1.446 | 3.80E-03 | |||
| h(Age-10) | −1.053 | 7.64E-03 | |||
GCV=Generalized cross validation.
Fig. 5.
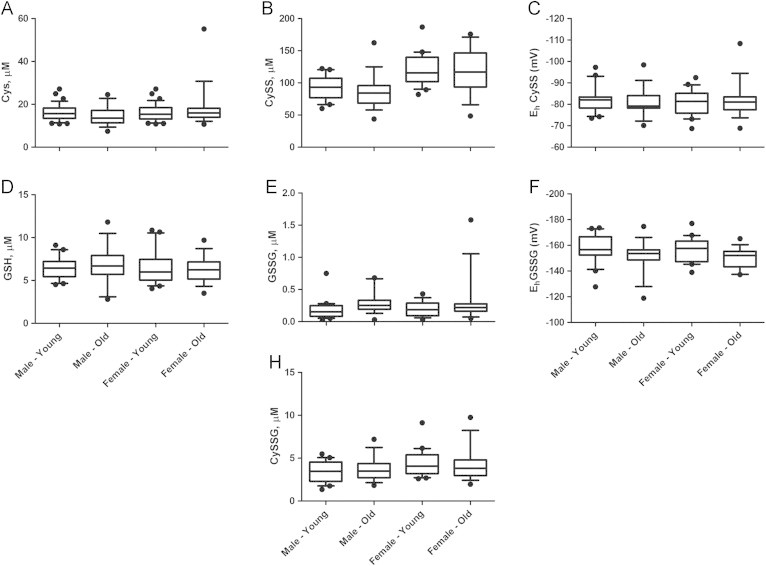
Effect of age and sex on the redox metabolites and redox potentials. Box plots were generated for (A) Cys, (B) CySS, (C) EhCySS, (D) GSH, (E) GSSG, (F) EhGSSG, and (G) CySSG.
Predictive analysis: MARS based classification analysis was performed to compare the effect of age on metabolite concentrations in marmosets and humans. Previous studies have reported that marmosets are considered “aged” after age 8 [15,18]. Marmosets of age 7 years or younger were categorized into the young age group (n=40) and the old age group (n=27) otherwise. Human samples of age 59 years or younger were categorized into the young group (n=94) and the old group (n=27) otherwise. MARS was used to select the best set of metabolites that allowed accurate classification of samples as young or old. The marmoset plasma redox data were used for training the MARS models using the redox metabolites as the predictor variables and the binary age response as the dependent variable. GSSG, CySS, and GSH were selected as the best predictors with an AUC of 0.708 in the training data at degree of interaction equal to 2. The performance of the model on the human redox data and a classification accuracy of 70.2% was achieved with an AUC of 0.703 (Table 4).
Table 4.
Summary of predictive analysis of age as a binary response (0=young; 1=old) in Marmosets (training data) and Humans (blind test data) using the redox metabolites as predictor variables.
| MARS degree of interaction | Selected predictor variables | GCV | R2 | Train AUC | Test classification accuracy (%) | Test AUCb |
|---|---|---|---|---|---|---|
| 1 | h(0.0684-GSSG), | 0.217 | 0.227 | 0.678 | 59.5 | 0.383 |
| h(−0.217-CySS) | ||||||
| 2a | h(0.0684-GSSG) | 0.237 | 0.207 | 0.708 | 70.2 | 0.703 |
| h(−0.2169-CySS)b | ||||||
| h(1.081-GSH) | ||||||
| 3 | h(0.0684-GSSG), | 0.224 | 0.227 | 0.678 | 59.5 | 0.383 |
| h(−0.217-CySS) | ||||||
AUC=area under curve; GCV=generalized cross validation.
Best model based on AUC value from training stage.
Discussion
Age-related changes observed in marmosets similar to those observed in humans include declines in lean mass, calf circumference, circulating albumin, hemoglobin and hematocrit. Also, similar to aging humans, marmosets have a higher prevalence of diseases such as cancer, diabetes and chronic renal disease as they age [15,18]. Using a population of 72 marmosets with an age range of 2–16 years old, we have further characterized the marmoset as a model of human aging by studying the age-related changes in plasma redox thiols and redox potentials. Here we have demonstrated age dependent decreases in plasma Cys and GSH, increased GSSG, and oxidation of the corresponding redox potentials (EhCySS and EhGSSG). While our population of animals did contain an equal number of males and females overall, the number of older animals (>8 years) was approximately one-third the number of young and adult animals. By increasing the number of subjects in the older age groups, we could possibly decrease the variation in the data and eliminate potentially misleading data points, e.g. high plasma GSH in 11–14 year olds. Also, blood was collected from these animals during a routine health exam. On the morning of the exam, the animals′ food bowls were removed; however, they may have had access to food located in the cage pan. Due to this we cannot consider these animals fasted and it is known that the fasted/fed status can alter the sulfur amino acid levels in the blood [13], which may have contributed to some variability in the data set.
The correlation data presented here are similar to human data that have been published previously by our laboratory [12]. When comparing Spearman correlations of redox metabolites in marmosets with that of aging humans we find that a majority of the comparisons are in agreement. For example, a strong negative correlation is observed for EhCySS and Cys in marmosets (r=−0.81; p<0.001) and humans (r=−0.9; p<0.001) [12]. Also, it was observed in humans that EhCySS increases at a linear rate as age increases [12], and this observation can now be applied to the aging marmoset.
Additionally, we performed regression based and predictive analysis using the MARS technique and Generalized Linear Models (GLM) to infer the association between age and plasma thiol redox metabolites. MARS is a non-parametric regression method that takes advantage of recursive partitioning and spline fitting methods to generate linear spline functions, called basis functions, from the original data. These functions are used as input variables for regression and classification analysis. In our analyses, we used the MARS models to study the association of each plasma thiol redox metabolite and redox potential with age and sex. The plasma thiol redox metabolites GSSG, CySS, and GSH were found to be the best predictors for classifying the marmosets as young or old with an AUC of 0.708. The model built using the marmoset plasma thiol redox data was also applied to predict the classification of human samples based on their redox levels. These analyses resulted in a classification accuracy of 70.2% that was achieved with an AUC of 0.703. Most biological systems involve many key regulators that are involved in complex interactions. Here we demonstrate that machine learning techniques like MARS that have so far been applied to genome-wide association and epigenetic studies can be used to study the complex interaction structure of the redox metabolites as well.
Harman proposed that aging was due to age-related ROS production [4]; therefore, it is reasonable to predict that increased plasma CySS concentrations due to aging will result in increased mitochondrial ROS production, cellular damage, cell death, morbidity and mortality. Also, female marmosets were observed to have higher plasma CySS concentrations compared to males. Tardif and colleagues have reported that males have a higher age-specific survival [18]. This phenomenon might be partially explained by this observed difference in plasma CySS.
In summary, our present data in common marmosets are in agreement with plasma thiol redox data from humans; therefore, further characterizing the marmoset nonhuman primate model of human aging. We have demonstrated that, similar to humans, marmosets exhibit age-related alterations in plasma thiol redox metabolites, which results in a progressive oxidation of the extracellular/plasma redox potentials as the animal ages. Also, it has been previously reported, using in vitro and in vivo models as well as human studies, that oxidation of these redox potentials can have deleterious physiological consequences [2,3,5–7,12]. To conclude, due to the relatively short lifespan and aging phenotypes that marmosets and humans share, marmosets should be accepted as a valid nonhuman primate model employed to study age-related pathologies.
Acknowledgments
This research was funded by grants from the National Institutes of Health R01AG038756 (D.P.J., D.E.P., L.M.W.), F32ES019821 (J.R.R.) and K99ES022266 (J.R.R.).
Footnotes
This is an open-access article distributed under the terms of the Creative Commons Attribution License, which permits unrestricted use, distribution, and reproduction in any medium, provided the original author and source are credited.
References
- 1.Abbott D.H., Barnett D.K., Colman R.J., Yamamoto M.E., Schultz-Darken N.J. Aspects of common marmoset basic biology and life history important for biomedical research. Complementary Medicine. 2003;53:339–350. [PubMed] [Google Scholar]
- 2.Go Y.M., Jones D.P. Cysteine/cystine redox signaling in cardiovascular disease. Free Radical Biology & Medicine. 2011;50:495–509. doi: 10.1016/j.freeradbiomed.2010.11.029. [DOI] [PMC free article] [PubMed] [Google Scholar]
- 3.Go Y.M., Park H., Koval M., Orr M., Reed M., Liang Y., Smith D., Pohl J., Jones D.P. A key role for mitochondria in endothelial signaling by plasma cysteine/cystine redox potential. Free Radical Biology & Medicine. 2010;48:275–283. doi: 10.1016/j.freeradbiomed.2009.10.050. [DOI] [PMC free article] [PubMed] [Google Scholar]
- 4.Harman D. Aging: a theory based on free radical and radiation chemistry. Journals of Gerontolog. 1956;11:298–300. doi: 10.1093/geronj/11.3.298. [DOI] [PubMed] [Google Scholar]
- 5.Iyer S.S., Accardi C.J., Ziegler T.R., Blanco R.A., Ritzenthaler J.D., Rojas M., Roman J., Jones D.P. Cysteine redox potential determines pro-inflammatory IL-1beta levels. PLoS One. 2009;4:e5017. doi: 10.1371/journal.pone.0005017. [DOI] [PMC free article] [PubMed] [Google Scholar]
- 6.Jiang S., Moriarty-Craige S.E., Orr M., Cai J., Sternberg P., Jr., Jones D.P. Oxidant-induced apoptosis in human retinal pigment epithelial cells: dependence on extracellular redox state. Investigative Ophthalmology & Visual Science. 2005;46:1054–1061. doi: 10.1167/iovs.04-0949. [DOI] [PubMed] [Google Scholar]
- 7.Jonas C.R., Ziegler T.R., Gu L.H., Jones D.P. Extracellular thiol/disulfide redox state affects proliferation rate in a human colon carcinoma (Caco2) cell line. Free Radical Biology & Medicine. 2002;33:1499–1506. doi: 10.1016/s0891-5849(02)01081-x. [DOI] [PubMed] [Google Scholar]
- 8.Jones DP. Extracellular redox state: refining the definition of oxidative stress in aging. Rejuvenation Research. 2006;9:169–181. doi: 10.1089/rej.2006.9.169. [DOI] [PubMed] [Google Scholar]
- 9.Jones D.P. Redefining oxidative stress. Antioxidants & Redox Signaling. 2006;8:1865–1879. doi: 10.1089/ars.2006.8.1865. [DOI] [PubMed] [Google Scholar]
- 10.Jones D.P., Carlson J.L., Mody V.C., Cai J., Lynn M.J., Sternberg P. Redox state of glutathione in human plasma. Free Radical Biology & Medicine. 2000;28:625–635. doi: 10.1016/s0891-5849(99)00275-0. [DOI] [PubMed] [Google Scholar]
- 11.Jones D.P., Carlson J.L., Samiec P.S., Sternberg P., Jr., Mody V.C., Jr., Reed R.L., Brown L.A. Glutathione measurement in human plasma. Evaluation of sample collection, storage and derivatization conditions for analysis of dansyl derivatives by HPLC. Clinica Chimica Acta. 1998;275:175–184. doi: 10.1016/s0009-8981(98)00089-8. [DOI] [PubMed] [Google Scholar]
- 12.Jones D.P., Mody V.C., Jr., Carlson J.L., Lynn M.J., Sternberg P., Jr. Redox analysis of human plasma allows separation of pro-oxidant events of aging from decline in antioxidant defenses. Free Radical Biology & Medicine. 2002;33:1290–1300. doi: 10.1016/s0891-5849(02)01040-7. [DOI] [PubMed] [Google Scholar]
- 13.Park Y., Ziegler T.R., Gletsu-Miller N., Liang Y., Yu T., Accardi C.J., Jones D.P. Postprandial cysteine/cystine redox potential in human plasma varies with meal content of sulfur amino acids. Journal of Nutrition. 2010;140:760–765. doi: 10.3945/jn.109.116764. [DOI] [PMC free article] [PubMed] [Google Scholar]
- 14.Patel R.S., Al Mheid I., Morris A.A., Ahmed Y., Kavtaradze N., Ali S., Dabhadkar K., Brigham K., Hooper W.C., Alexander R.W., Jones D.P., Quyyumi A.A. Oxidative stress is associated with impaired arterial elasticity. Atherosclerosis. 2011;218:90–95. doi: 10.1016/j.atherosclerosis.2011.04.033. [DOI] [PMC free article] [PubMed] [Google Scholar]
- 15.Ross C.N., Davis K., Dobek G., Tardif S.D. Aging phenotypes of common marmosets (Callithrix jacchus) Journal of Aging Research. 2012;2012:567143. doi: 10.1155/2012/567143. [DOI] [PMC free article] [PubMed] [Google Scholar]
- 16.Rost J., Rapoport S. Reduction-potential of glutathione. Nature. 1964;201:185. doi: 10.1038/201185a0. [DOI] [PubMed] [Google Scholar]
- 17.Soltow Q.A., Strobel F.H., Wachtman L., and Jones D.P. High-performance metabolic profiling with dual chromatography-Fourier-transform mass spectrometry (DC-FTMS) for study of the exposome. Metabolomics 9 (2011) S132-S143. [DOI] [PMC free article] [PubMed]
- 18.Tardif S.D., Mansfield K.G., Ratnam R., Ross C.N., Ziegler T.E. The marmoset as a model of aging and age-related diseases. ILAR Journal. 2011;52:54–65. doi: 10.1093/ilar.52.1.54. [DOI] [PMC free article] [PubMed] [Google Scholar]