

Abstract
Neuronal underpinnings of auditory verbal hallucination remain poorly understood. One suggested mechanism is brain activation that is similar to verbal imagery but occurs without the proper activation of the neuronal systems that are required to tag the origins of verbal imagery in one's mind. Such neuronal systems involve the supplementary motor area. The supplementary motor area has been associated with awareness of intention to make a hand movement, but whether this region is related to the sense of ownership of one's verbal thought remains poorly known. We hypothesized that the supplementary motor area is related to the distinction between one's own mental processing (auditory verbal imagery) and similar processing that is attributed to non-self author (auditory verbal hallucination). To test this hypothesis, we asked patients to signal the onset and offset of their auditory verbal hallucinations during functional magnetic resonance imaging. During non-hallucination periods, we asked the same patients to imagine the hallucination they had previously experienced. In addition, healthy control subjects signaled the onset and offset of self-paced imagery of similar voices. Both hallucinations and the imagery of hallucinations were associated with similar activation strengths of the fronto-temporal language-related circuitries, but the supplementary motor area was activated more strongly during the imagery than during hallucination. These findings suggest that auditory verbal hallucination resembles verbal imagery in language processing, but without the involvement of the supplementary motor area, which may subserve the sense of ownership of one's own verbal imagery.
Keywords: Auditory verbal hallucination, Brain, Functional magnetic resonance imaging, Imagery, Intention, Schizophrenia, Supplementary motor area
Highlights
► We compared involuntary (hallucinations) and voluntary (imagery) verbal processing. ► First such study in patients. ► Supplementary motor area (SMA) activation differed between conditions. ► Language-related circuitries were similarly activated during both conditions. ► Convergent evidence from intra-subject and between-groups analyses. ► SMA may be involved in the experience of the ownership of one's verbal thought.
1. Introduction
Human adaptive capacity relies in part on the ability to simulate external world in one's imagination. The imagery representations may be associated with activation of the modality-specific sensory cortex that is similar to the real perceptions (Kraemer et al., 2005). Then, how do we distinguish between the perceived and the imagined? In 3.5% of population suffering from psychotic disorders during life-time (Perälä et al., 2007), this capacity is compromised. Psychotic symptoms, such as auditory verbal hallucination (AVH) may help to address the poorly understood neuronal mechanisms of the distinction between the perceived and the imagined.
The “inner-speech hypothesis” of AVH states that AVH is one's inner speech or verbal imagery without the normal monitoring or tagging of the process within one's mind (Maudsley, 1886; Feinberg, 1978; Frith and Done, 1988; Stephane et al., 2001; Allen et al., 2007). This hypothesis agrees with observations that “voices” are typically related to the voice-hearer's thoughts and moods (Hustig and Hafner, 1990; Nayani and David, 1996). Furthermore, the “voices” coincide with activation of the bilateral language-related areas (L-circuitry) in the auditory cortices and the inferior frontal gyri (McGuire et al., 1993; Sommer et al., 2008; Raij et al., 2009; Jardri et al., 2011) that are activated during verbal imagery as well (McGuire et al., 1996).
One distinctive factor between the imagined and the perceived is the volitional intention when we imagine. If there is no trace of such intention, sensory activation could be interpreted as a perception of an external stimulus rather than imagination. Awareness of intention to make a physical movement has been associated with the supplementary motor area (SMA) (Lau et al., 2004; Haggard, 2008), more precisely the pre-supplementary motor area. Interestingly, an SMA lesion can cause alien limb syndrome, characterized by apparently purposeful, but unintended movements of the limb (Scepkowski and Cronin-Golomb, 2003).
Indirect evidence supports the hypothesis that the SMA is involved in the perception of intentionality during verbal imagery in addition to physical movements. In a seminal study that used functional imaging, McGuire et al. (1995) found that the activation of the SMA was weaker during verbal imagery in schizophrenia patients with AVH than in control subjects. The interpretation of the authors was that poor SMA function might relate to the loss of the sense that the inner speech is self-generated, and thereby predispose the individual to AVH (McGuire et al., 1995). This study did not probe the SMA function during the actual hallucination, however. Imaging studies that have compared AVH-related brain activation with non-AVH periods do not typically report SMA activation (Jardri et al., 2011; Allen et al., 2008; Kuhn and Gallinat, 2012). In contrast, verbal imagery has been associated with the SMA activation (McGuire et al., 1995). To our knowledge, only one study has compared AVH-related activation directly with verbal-imagery-related activation (Linden et al., 2011). The study with seven non-clinical subjects with AVH did not find a difference in SMA activation strengths between conditions, but suggested that the SMA activation started earlier during imagery than during AVH. We aim to extend this line of research to clinical subjects to test the hypothesis that the SMA activation is stronger during verbal imagery than during AVH.
2. Materials and methods
2.1. Participants
Patient group included 20 patients, who anticipated hearing intermittent voices, 10–60 s in duration, during a 30-min fMRI scanning. Nine of the patients were new and eleven from our previous study (Raij et al., 2009). Three of the patients from the previous study were rescanned for the present study. AVH-related data of the previous study that did not include imagery task were also made available from the rest of the subjects. Altogether 12 patients were scanned during the imagery task and 20 patients during intermittent AVH and non-AVH periods. Fifteen age- and sex- matched healthy control subjects were invited from a population of healthy voluntary subjects at Aalto University, Espoo, Finland. Study selection criteria were that participants have no neurological or severe somatic disorders, or contraindications of MR imaging. A structured diagnostic interview for DSM-IV (American Psychiatric Association, 1994) and Positive and Negative Symptom Scale (Kay et al., 1987) was conducted for each patient. The study was approved by the Hospital District of Helsinki and Uusimaa Ethics Committee for Gynaecology and Obstetrics, Pediatrics and Psychiatry, and each subject signed an informed consent form before participation.
2.2. Functional magnetic resonance imaging
We measured the blood-oxygenation-dependent (BOLD) signal (Signa VH/i 3.0 T MRI scanner; GE Healthcare, Chalmont St Giles, UK). The scanner was set for an echo time 32 ms, repetition time 2.3 s, flip angle 75°, and field of view 24 cm, on 39 oblique slices aligned with the anterior-commissure–posterior-commissure line, slice thickness 4 mm and matrix size 64 × 64. The first 4 of 260 whole-head images were automatically discarded to allow stabilization of the signal. The scanner and the imaging parameters were the same for the patients scanned in the previous study (Raij et al., 2009).
We presented stimuli to the study participants and collected behavioral information with Presentation® software. Patients reported beginnings and ends of AVH by a button press of an optical response key operated by either left or right thumb. To avoid any confusion between the hallucination- and non-hallucination periods, we presented visual feedback messages on a projector screen to the patients “Voices present—please push a button when the voices stop”, or “Voices absent—please push any button when the voices begin”, respectively. On any occasion when there had been an 18 s period without hallucinations, the following text appeared: “Imagine the voices. Please push any button if the voices begin”. If the AVH began during the 18 s of the fixed imagination-period, the imagination was interrupted and a “Voices present—please push a button when the voices stop” message appeared as text. If the imagery-period continued hallucination-free for 18 s the following text message appeared: “Voices absent—please push any button when the voices begin”. This signaled the end of a imagery-period and remained on the screen until the end of the scanning session, or until the patient signaled the beginning of a new AVH.
After scanning, patients wrote detailed description about their AVHs, including verbal content and characteristics of the voice. Each patient's description was given to the matched healthy control subject before scanning. During scanning, the control subjects were asked to imagine as similar as possible voices to those described by the patients in approximately 30 s periods, alternated with approximately 30 s rest periods. Periods were self-paced and the control subjects reported onset and offset of the imagery by button pressing.
2.3. Analysis
Of the 20 patients, we analyzed data of those 12 subjects who reported frequent hallucination and non-hallucination periods of 15 s or more in duration during scanning. This 15 s limit was selected because of the known inaccuracy between changes in the brain activity and subjective reports of the beginning and end of hallucinations (van de Ven et al., 2005).
We realigned, normalized, and smoothed the functional images, and analyzed them using the general linear model in SPM8 (http://www.fil.ion.ucl.ac.uk/spm/software/spm8/) (Friston et al., 1995). We created individual box-car functions for hallucination, non-hallucination (= rest), imagery periods, and button presses in the patients, and imagery and non-imagery (= rest) periods, and button presses in the control subjects. We convolved the box-car functions with a hemodynamic response function, high-pass filtered signal according to the temporal variation of AVH periods (cut-off 128–300 s), and included a first-order autoregressive model to compensate for autocorrelation error (Bullmore et al., 1996).
We created individual contrast images for hallucination vs. non-hallucination periods, and imagery of hallucination vs. non-hallucination periods, for patients, and imagery vs. non-imagery periods for control subjects. We modeled the button-press-related activations with box-car functions to plot them as regressions in the data analysis. Periods of previous study that included ratings of loudness and subjective reality of AVHs during scanning, were regressed in addition to the button press data, before the individual contrast images were created for hallucination vs. non-hallucination periods. In addition, hallucination periods of less than 10 s in duration were modeled separately from longer AVH and regressed out, because of the reported inaccuracy between brain activation and button presses during AVH (van de Ven et al., 2005).
Our main analysis compared imagery of AVH and AVH-related brain activation. We used fixed-effects analysis to compare AVH- and imagery-related activation within the patients, who reported success in the imagery task (Friston et al., 1999). These findings were family-wise-error corrected for multiple comparisons in the whole-brain volume. We then compared hallucination vs. non-hallucination contrast in all patients with the imagery vs. non-imagery contrast in control subjects with a two-sample t-test. For this analysis, P-values were corrected for multiple comparisons within a sphere of 8 mm radius, which was centered at the peak activation in the within-subject analysis.
In a separate analysis, we created a map of common activation clusters to illustrate similarities in the activation between AVH and imagery: We conducted a one-sample t-test for “AVH vs. rest” contrasts in patients, and created an inclusive mask image of activation with a cutoff of p < 0.05. This mask image was used in one-sample t-test to show activations with p < 0.05 in “imagery vs. rest” contrasts in patients. In the present analysis, our primary aim was not to test whether the brain activation during AVH survives correction for multiple comparisons, but rather to illustrate possible similarities between activation strengths of the L-circuitry. Thus, in line with a recent similar study (Linden et al., 2011), we did not correct the L-circuitry activation for multiple comparisons. To compare activation strengths, we extracted mean contrasts from the common clusters of activation and plotted 95% confidence intervals of activation strengths in these clusters in both “hallucination vs. non-hallucination” and “imagery vs. non-imagery” contrast.
We calculated individual differences between SMA activation strength and L-circuitry activation strength, to test the hypothesis that there is not only a different SMA activation but a different balance between SMA and L-circuitry activation during imagery and AVH. These differences were compared between AVH in patients and imagery in control subjects. Individual L-circuitry activation strength was calculated as a mean across the common clusters of activation. SMA activation strength was extracted for each subject from the most significantly activated voxel within a sphere of 20 mm radius, which was centered at the (pre-)SMA according to Lau et al. (2004).
We entered hallucination vs. non-hallucination contrast images to one-sample t-test with uncorrected threshold of P < 0.05 to search for signs of weak SMA activation that could have been missed due to the relatively small sample size. We also extracted individual contrast-strengths from the statistically most significantly activated voxel during AVH and imagery to exclude the possibility that the poor AVH-related SMA activation in the patient group results from large individual variance in functional anatomy rather than from poor individual activation. Individual activation strength and signal time courses were extracted from the most significantly activated voxel within a sphere of 20 mm radius, which was centered at the (pre-)SMA according to Lau et al. (2004). Signal time courses were extracted from five scans before to three scans after the onset of AVH and imagery in those patients who succeeded in both tasks. Finally, we compared AVH-related activation between the medicated and unmedicated patients. Independent-samples t-test was used in the comparisons.
3. Results
Table 1 shows the characteristics of the 12 patients and 15 healthy control subjects, who were included in the final analysis. These patients included four new patients and eight patients from our previous study, three of whom were rescanned for the present study. The patients who were included and those who were excluded from the final analysis did not differ on age (p = 0.44), sex (p = 0.65), PANSS total score (p = 0.56), handedness (p = 1.0), years of AVH (p = 0.29), or diagnosis (p = 1.0).
Table 1.
Characteristics of the participants who were included in the final analysis. *Antipsychotic medicines included aripiprazole, clozapine, olanzapine, perphenazine, quetiapine, risperidone, and sertindole. **The three remaining patients fulfilled DSM-IV criteria for schizoaffective disorder.
| Characteristic | Patients |
Healthy control subjects |
Group difference |
||
|---|---|---|---|---|---|
| Mean ± SD, or proportion | Range | Mean ± SD, or proportion | Range | p (t/χ2) | |
| Age | 32 ± 7 | 22–47 | 32 ± 7 | 22–47 | 0.97 |
| Female | 7/12 | 9/15 | 1.0 | ||
| Right-handed | 11/12 | 15/17 | 1.0 | ||
| Employed or full-time student | 5/12 | 15/15 | 0.001 | ||
| Duration of hallucination (years) | 9 ± 5 | 3–17 | |||
| PANSS total score | 60 ± 13 | 40–85 | |||
| Antipsychotic medication* | 7/12 | ||||
| Diagnosis of schizophrenia** | 9/12 | ||||
The patients reported a mean of 19 (range 7–36) AVH periods of more than 10 s in duration. All the patients reported human voices, one reported singing and others speech. The mean duration of these AVH periods was 46 s (range 12–368 s), and the mean duration of non-hallucination periods was 22 s (range 7–258 s). In healthy control subjects, the mean imagery period lasted for 48 s (range 12–94 s), and the mean non-imagery period for 46 s (range 14–122 s). Four patients reported success in the imagery task. Other patients reported that imagery was difficult because it triggered AVH, or because it was confused with AVH.
3.1. Differences within subjects in activation during hallucination and imagery of hallucination
The left SMA activation within patients was stronger during imagery of hallucination than during hallucination (x, y, z = − 4, 10, 50; p < 0.001, corrected for multiple comparisons; Fig. 1, left). No brain region was more strongly activated during AVH than during imagery of AVH, even if the statistical threshold was lowered to uncorrected p < 0.05. Fig. 2 shows that fMRI signal increases in the SMA after onset of imagery, but stays at the baseline during AVH.
Fig. 1.

SMA activation was stronger during imagery of hallucination than during hallucination. Hallucination-related activation was compared with the imagery-related activation in the same patients and in the healthy control subjects. Crosshairs identify the y- and z-coordinates of the peak activation in the pre-SMA, associated in a previous study with awareness of one's intention to act (Lau et al., 2004). No mask image is used in the figure.
Fig. 2.

fMRI signal time course from five scans before to three scans after the onset of imagery and hallucination in the four patients who succeeded in both tasks. Signals were extracted from the most statistically significant voxel within the SMA region for each individual and averaged across subjects. PE, activation strength in parameter estimates. Scan, time to repetition of the whole-head image.
3.2. Differences between groups in activation during hallucination and imagery of hallucination
The imagery-related SMA activation in control subjects was stronger than AVH-related SMA activation in the patient group (p = 0.038, corrected for multiple comparisons; Fig. 1, right). SMA activation was stronger than L-circuitry activation during imagery in the control subjects (p = 0.02). In contrast, SMA activation tended to be weaker than L-circuitry activation during AVH in patients (p = 0.07). SMA vs. L-circuitry activation difference was greater during imagery in the control subjects than during AVH in patients (p = 0.007; Fig. 3).
Fig. 3.

SMA activation strengths in comparison with the simultaneous L-circuitry activation strengths. Zero line refers to the individual L-circuitry activation strength. Error bars show 95% confidence intervals of the SMA activation strengths in comparison with the L-circuitry activation strengths. PE, activation strength in parameter estimates.
No SMA activation was detected during AVH, even if statistical threshold was lowered to uncorrected p < 0.05. Activation strengths of the individual peak voxels around the SMA were weaker during AVH in patients than during imagery in control subjects (p = 0.005).
3.3. Similarities between groups in activation during hallucination and imagery of hallucination
AVH-related activation in patients and imagery-related activation in control subjects overlapped in the bilateral auditory cortex and inferior frontal gyri (Fig. 4; Table 2). Fig. 4 shows that in the present sample, confidence intervals of the activation strengths in these regions were similar during AVH and imagery of AVH. No difference in AVH-related activation was observed in L-circuitry or SMA between the seven medicated and five unmedicated subjects (p > 0.1).
Fig. 4.
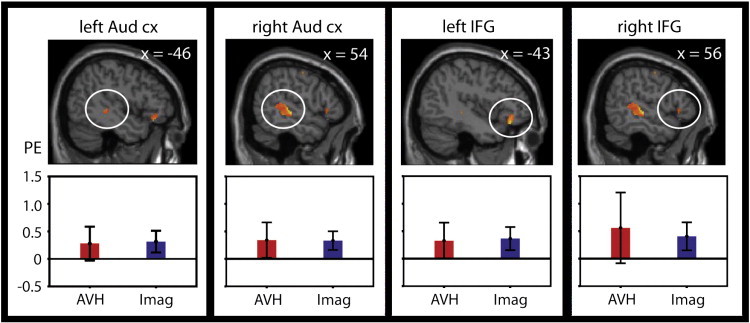
Overlap of activation during hallucination in patients and during imagery of hallucination in control subjects. Error bars show 95% confidence intervals. Aud cx, auditory cortex; IFG, inferior frontal gyrus; PE, activation strength in parameter estimates; AVH, auditory verbal hallucination; Imag, Imagery of hallucination.
Table 2.
Overlap of activation during hallucination in patients and during imagery of hallucination in control subjects.
| Region | x | y | z | Volume (cm3) |
|---|---|---|---|---|
| Bilateral auditory cortex | 62 | − 24 | − 2 | 42.7 |
| − 44 | − 34 | 0 | 2.3 | |
| Bilateral inferior frontal gyrus | 56 | 24 | 0 | 1.2 |
| − 42 | 32 | − 16 | 6.7 |
Volume refers to extent of voxels with p < 0.05.
4. Discussion
In the present comparison, SMA activation was stronger during imagery of AVH than during actual AVH. In contrast, the L-circuitry activation was similar during both imagery of AVH and actual AVH. Consequently, the balance between SMA activation and the L-circuitry activation differed significantly between conditions. These findings were not explained by differences in functional anatomy or activation latencies. The results agree with the indirect evidence suggesting that SMA is activated during voluntary verbal imagery (McGuire et al., 1995) but the activation is weak or absent during clinical AVH (Jardri et al., 2011; Allen et al., 2008; Kuhn and Gallinat, 2012).
Thereby, our findings complement considerably a recent study on 7 non-medicated, non-clinical subjects with AVH (Linden et al., 2011). In that study, the differences in SMA activation strengths between hallucination and verbal imagery did not reach statistical significance, though the onset of SMA activation was delayed during AVH (Linden et al., 2011). Both the delayed latency and the weak activation may be related to compromised SMA function during hallucination. However, it is possible that the weak rather than delayed SMA activation reflects more severe AVH in the patients in comparison with non-clinical subjects.
The SMA is normally involved in the initiation of action, including imagining of speech (McGuire et al., 1996), and it is possible that a trace of such an SMA function is required for the sense of ownership of one's own action (Haggard, 2008). Modern views of willed action suggest that brain activity changes gradually in large-scale loops well before one consciously recognizes intention to act (Haggard, 2008). These circuitries include the SMA (Haggard, 2008; Libet et al., 1983; Soon et al., 2008) in addition to the parietal and the prefrontal cortex (Soon et al., 2008). If functional hierarchy of these circuitries is bypassed, this could result in the experience of unwilled action and even the attribution of the action to non-self author. Several mechanisms of such an involuntary activation of the L-circuitry have been suggested. These mechanisms include the abnormal memory-retrieval, related to the dysfunction of the hippocampal/parahippocampal region (Jardri et al., 2011), dysfunctional corollary discharge signaling, i.e. signaling of the motor activity to the sensory cortices (Feinberg, 1978; van Lutterveld et al., 2011), spontaneous decrease of the default-mode-network activation (Jardri et al., in press), and increased sensitivity of the auditory cortex (Hoffman and McGlashan, 1997; Lewis-Hanna et al., 2011). Whatever the mechanism, one further way to test the hypothesis that the SMA is required for the experience of inner-speech ownership would be by using transcranial magnetic stimulation. Thus if SMA functioning is disrupted, does this lead to lowered sense of ownership or intentionality of inner speech?
Limitations of the present study include that the imagery task was difficult for most of the patients, which forced us to use fixed-effects analysis in the within-subjects comparison. Results of a fixed-effects analysis indicate that the finding is present in at least some of the subjects, but the results cannot be generalized to the study population (Friston et al., 1999). Consequently, our results rely in part on the between-groups comparison that may be biased by group differences, such as medication. However, the difference in SMA activation was consistent across analyses.
Another limitation is that we were unable to show activation for AVH corrected for multiple comparisons. This finding is well in line with previous studies: Even though there is a wide consensus that the L-circuitry is involved in AVH, a recent meta-analysis failed to support state-like L-circuitry activation during AVH (Kuhn and Gallinat, 2012). One possible explanation is that the L-circuitry activation during AVH is weak or unstable. Suitable subjects are rare for studies, which compare intermittent AVH periods with non-AVH periods, leading to small sample sizes and few AVH-periods. This may result in insufficient statistical power to detect weak or unstable activation (Mumford and Nichols, 2008). In addition, high (Kuhn and Gallinat, 2012) or unstable (Jardri et al., in press) baseline-activity of the auditory cortex in the subjects with AVH may mask any activation in this brain region. Therefore both base-line differences and the small sample size may have contributed to the poor L-circuitry activation in the patient group, as well as to the negative finding in the comparison of the imagery-related L-circuitry activation in healthy subjects with the AVH-related activation in the patient group. To overcome these limitations, further studies should compare AVH-related activation with both verbal-imagery- and matched-external-stimuli-related activation in larger patient groups. Robust L-circuitry activation during external stimuli (such as that observed in healthy subjects (Price, 2010)) would suggest that the weak AVH-related activation does not result from baseline activity.
In conclusion, the present finding on similarity of the L-circuitry activation during AVH and imagery of AVH has to be considered with caution. Nevertheless, the consistent findings across present comparisons suggest that the SMA activation is stronger during imagery of AVH than during actual AVH. While comprehensive models on AVH are still under development, the present findings support the idea that these symptoms are form of involuntary inner speech or verbal imagery. On the other hand, these findings provide preliminary evidence that SMA may be involved in the experience of ownership of one's verbal thought.
Acknowledgements
We thank Riitta Hari, Marita Kattelus, Johannes Lehtonen, Matti Holi, Minna Valkonen-Korhonen, Sebastian Therman, and Marko Manninen for expert help and advice. Authors report no conflicts of interest. This work was supported by the Academy of Finland, ERC Advanced Grant #232946, and the Jalmari and Rauha Ahokas Foundation.
Footnotes
This is an open-access article distributed under the terms of the Creative Commons Attribution-NonCommercial-ShareAlike License, which permits non-commercial use, distribution, and reproduction in any medium, provided the original author and source are credited
References
- Allen P., Aleman A., McGuire P.K. Inner speech models of auditory verbal hallucinations: evidence from behavioural and neuroimaging studies. International Review of Psychiatry. 2007;19:407–415. doi: 10.1080/09540260701486498. [DOI] [PubMed] [Google Scholar]
- Allen P., Laroi F., McGuire P.K., Aleman A. The hallucinating brain: a review of structural and functional neuroimaging studies of hallucinations. Neuroscience and Biobehavioral Reviews. 2008;32:175–191. doi: 10.1016/j.neubiorev.2007.07.012. [DOI] [PubMed] [Google Scholar]
- American Psychiatric Association . 4th ed. American Psychiatric Press; 1994. Diagnostic and Statistical Manual of Mental Disorders. [Google Scholar]
- Bullmore E., Brammer M., Williams S.C., Rabe-Hesketh S., Janot N., David A., Mellers J., Howard R., Sham P. Statistical methods of estimation and inference for functional MR image analysis. Magnetic Resonance in Medicine. 1996;35:261–277. doi: 10.1002/mrm.1910350219. [DOI] [PubMed] [Google Scholar]
- Feinberg I. Efference copy and corollary discharge: implications for thinking and its disorders. Schizophrenia Bulletin. 1978;4:636–640. doi: 10.1093/schbul/4.4.636. [DOI] [PubMed] [Google Scholar]
- Friston K.J., Holmes A.P., Worsley K.J., Poline J.-P., Frith C.D., Frackowiak R.S.J. Statistical parametric maps in functional imaging: a general linear approach. Human Brain Mapping. 1995;2:189–210. [Google Scholar]
- Friston K.J., Holmes A.P., Price C.J., Buchel C., Worsley K.J. Multisubject fMRI studies and conjunction analyses. NeuroImage. 1999;10:385–396. doi: 10.1006/nimg.1999.0484. [DOI] [PubMed] [Google Scholar]
- Frith C.D., Done D.J. Towards a neuropsychology of schizophrenia. The British Journal of Psychiatry. 1988;153:437–443. doi: 10.1192/bjp.153.4.437. [DOI] [PubMed] [Google Scholar]
- Haggard P. Human volition: towards a neuroscience of will. Nature Reviews. Neuroscience. 2008;9:934–946. doi: 10.1038/nrn2497. [DOI] [PubMed] [Google Scholar]
- Hoffman R.E., McGlashan T.H. Synaptic elimination, neurodevelopment, and the mechanism of hallucinated “voices” in schizophrenia. The American Journal of Psychiatry. 1997;154:1683–1689. doi: 10.1176/ajp.154.12.1683. [DOI] [PubMed] [Google Scholar]
- Hustig H.H., Hafner R.J. Persistent auditory hallucinations and their relationship to delusions and mood. The Journal of Nervous and Mental Disease. 1990;178:264–267. doi: 10.1097/00005053-199004000-00009. [DOI] [PubMed] [Google Scholar]
- Jardri R., Pouchet A., Pins D., Thomas P. Cortical activations during auditory verbal hallucinations in schizophrenia: a coordinate-based meta-analysis. The American Journal of Psychiatry. 2011;168:73–81. doi: 10.1176/appi.ajp.2010.09101522. [DOI] [PubMed] [Google Scholar]
- Jardri, R., Thomas, P., Delmaire, C., Delion, P., Pins , D., in press. The Neurodynamic Organization of Modality-Dependent Hallucinations. Cerebral Cortex, http://dx.doi.org/10.1093/cercor/bhs082. [DOI] [PubMed]
- Kay S.R., Fiszbein A., Opler L.A. The Positive and Negative Syndrome Scale (PANSS) for schizophrenia. Schizophrenia Bulletin. 1987;13:261–276. doi: 10.1093/schbul/13.2.261. [DOI] [PubMed] [Google Scholar]
- Kraemer D.J., Macrae C.N., Green A.E., Kelley W.M. Musical imagery: sound of silence activates auditory cortex. Nature. 2005;434:158. doi: 10.1038/434158a. [DOI] [PubMed] [Google Scholar]
- Kuhn S., Gallinat J. Quantitative meta-analysis on state and trait aspects of auditory verbal hallucinations in schizophrenia. Schizophrenia Bulletin. 2012;38:779–786. doi: 10.1093/schbul/sbq152. [DOI] [PMC free article] [PubMed] [Google Scholar]
- Lau H.C., Rogers R.D., Haggard P., Passingham R.E. Attention to intention. Science. 2004;303:1208–1210. doi: 10.1126/science.1090973. [DOI] [PubMed] [Google Scholar]
- Lewis-Hanna L.L., Hunter M.D., Farrow T.F., Wilkinson I.D., Woodruff P.W. Enhanced cortical effects of auditory stimulation and auditory attention in healthy individuals prone to auditory hallucinations during partial wakefulness. NeuroImage. 2011;57:1154–1161. doi: 10.1016/j.neuroimage.2011.04.058. [DOI] [PubMed] [Google Scholar]
- Libet B., Gleason C.A., Wright E.W., Pearl D.K. Time of conscious intention to act in relation to onset of cerebral activity (readiness-potential). The unconscious initiation of a freely voluntary act. Brain. 1983;106:623–642. doi: 10.1093/brain/106.3.623. [DOI] [PubMed] [Google Scholar]
- Linden D.E., Thornton K., Kuswanto C.N., Johnston S.J., van de Ven V., Jackson M.C. The brain's voices: comparing nonclinical auditory hallucinations and imagery. Cerebral Cortex. 2011;21:330–337. doi: 10.1093/cercor/bhq097. [DOI] [PubMed] [Google Scholar]
- Maudsley H. Trench & Co.; London: 1886. Natural Causes and Supernatural Seemings, Kegan Paul. [Google Scholar]
- McGuire P.K., Shah G.M., Murray R.M. Increased blood flow in Broca's area during auditory hallucinations in schizophrenia. Lancet. 1993;342:703–706. doi: 10.1016/0140-6736(93)91707-s. [DOI] [PubMed] [Google Scholar]
- McGuire P.K., Silbersweig D.A., Wright I., Murray R.M., David A.S., Frackowiak R.S., Frith C.D. Abnormal monitoring of inner speech: a physiological basis for auditory hallucinations. Lancet. 1995;346:596–600. doi: 10.1016/s0140-6736(95)91435-8. [DOI] [PubMed] [Google Scholar]
- McGuire P.K., Silbersweig D.A., Murray R.M., David A.S., Frackowiak R.S., Frith C.D. Functional anatomy of inner speech and auditory verbal imagery. Psychological Medicine. 1996;26:29–38. doi: 10.1017/s0033291700033699. [DOI] [PubMed] [Google Scholar]
- Mumford J.A., Nichols T.E. Power calculation for group fMRI studies accounting for arbitrary design and temporal autocorrelation. NeuroImage. 2008;39:261–268. doi: 10.1016/j.neuroimage.2007.07.061. [DOI] [PMC free article] [PubMed] [Google Scholar]
- Nayani T.H., David A.S. The auditory hallucination: a phenomenological survey. Psychological Medicine. 1996;26:177–189. doi: 10.1017/s003329170003381x. [DOI] [PubMed] [Google Scholar]
- Perälä J., Suvisaari J., Saarni S., Kuoppasalmi K., Isometsä E., Pirkola S., Partonen T., Tuulio-Henriksson A., Hintikka J., Kieseppä T., Härkänen T., Koskinen S., Lönnqvist J. Lifetime prevalence of psychotic and bipolar I disorders in a general population. Archives of General Psychiatry. 2007;64:19–28. doi: 10.1001/archpsyc.64.1.19. [DOI] [PubMed] [Google Scholar]
- Price C.J. The anatomy of language: a review of 100 fMRI studies published in 2009. Annals of the New York Academy of Sciences. 2010;1191:62–88. doi: 10.1111/j.1749-6632.2010.05444.x. [DOI] [PubMed] [Google Scholar]
- Raij T.T., Valkonen-Korhonen M., Holi M., Therman S., Lehtonen J., Hari R. Reality of auditory verbal hallucinations. Brain. 2009;132:2994–3001. doi: 10.1093/brain/awp186. [DOI] [PMC free article] [PubMed] [Google Scholar]
- Scepkowski L.A., Cronin-Golomb A. The alien hand: cases, categorizations, and anatomical correlates. Behavioral and Cognitive Neuroscience Reviews. 2003;2:261–277. doi: 10.1177/1534582303260119. [DOI] [PubMed] [Google Scholar]
- Sommer I.E., Diederen K.M., Blom J.D., Willems A., Kushan L., Slotema K., Boks M.P., Daalman K., Hoek H.W., Neggers S.F., Kahn R.S. Auditory verbal hallucinations predominantly activate the right inferior frontal area. Brain. 2008;131:3169–3177. doi: 10.1093/brain/awn251. [DOI] [PubMed] [Google Scholar]
- Soon C.S., Brass M., Heinze H.J., Haynes J.D. Unconscious determinants of free decisions in the human brain. Nature Neuroscience. 2008;11:543–545. doi: 10.1038/nn.2112. [DOI] [PubMed] [Google Scholar]
- Stephane M., Barton S., Boutros N.N. Auditory verbal hallucinations and dysfunction of the neural substrates of speech. Schizophrenia Research. 2001;50:61–78. doi: 10.1016/s0920-9964(00)00150-x. [DOI] [PubMed] [Google Scholar]
- van de Ven V.G., Formisano E., Roder C.H., Prvulovic D., Bittner R.A., Dietz M.G., Hubl D., Dierks T., Federspiel A., Esposito F., Di Salle F., Jansma B., Goebel R., Linden D.E. The spatiotemporal pattern of auditory cortical responses during verbal hallucinations. NeuroImage. 2005;27:644–655. doi: 10.1016/j.neuroimage.2005.04.041. [DOI] [PubMed] [Google Scholar]
- van Lutterveld R., Sommer I.E., Ford J.M. The neurophysiology of auditory hallucinations — a historical and contemporary review. Front Psychiatry. 2011;2:1–7. doi: 10.3389/fpsyt.2011.00028. [DOI] [PMC free article] [PubMed] [Google Scholar]