

Abstract
The current study investigates the whole brain myelin water content distribution applying a new approach that allows for the simultaneous mapping of total and relative myelin water content, T1 and T2* with full brain coverage and high resolution (1 × 1 × 2 mm3). The data was collected at two different sites in healthy controls to validate the independence of a specific setup. In addition, a group of patients with known white matter affections was investigated to compare two measures of myelin, i.e. relative and absolute myelin water content. Based on the first dataset, a quantitative myelin water content atlas was created which served as a control set for the other two datasets. Both control groups measured at different institutions yielded consistent results. However, distinct regions of reduced myelin water content were observed for the patient dataset, both on an individual basis and in a group-wise comparison.
The comparison between the absolute and relative measurement of myelin water content in MS patients showed that the relative measurement, which is employed by many researchers, overestimates both disease volume and the corresponding reduction of myelin water content in white matter lesions. However, for normal appearing white matter, no difference between both approaches was detected.
The results obtained in the current study demonstrate that absolute myelin water content can reliably be determined in a multicentre environment using standard MR sequences. The optimised protocol allows for a measurement of four quantitative parameters with full brain coverage in only 10 min. This might expedite a more widespread future use of quantitative MRI methods for clinical research and diagnosis.
Keywords: Quantitative MRI, Myelin imaging, Absolute water content, Quantitative brain atlas, Multiple sclerosis
Highlights
► Whole brain myelin water content maps of MS patients and controls were acquired. ► A quantitative full brain myelin water content atlas was created. ► Consistent results were obtained for measurements performed at different centres. ► Low-grade MS patients showed regions of distinct myelin water content reduction. ► An absolute measurement of myelin water content is recommended in MS plaques.
1. Introduction
Quantitative magnetic resonance imaging of brain myelination has experienced a real boost over the past few years. Different approaches were presented which can be grouped into two categories: relaxation based (Laule et al., 2004; Du et al., 2007; Oh et al., 2007; Hwang et al., 2010; Lenz et al., 2011; Hwang et al., 2011; Tonkova et al., 2012; Nguyen et al., 2012) and model based reconstruction (Andrews et al., 2005; Deoni et al., 2008) of myelin water content. In both cases, the restricted motility of myelin bound water with respect to other MR visible water pools is employed, which results in a modification of the corresponding pool relaxation rates (Mathur-De Vré). As such, relaxation based reconstruction methods allow for the determination of two or more pool fractions from the measured decay data by performing a multiexponential analysis of the transverse signal decay curve (either T2 or T2*). In contrast, model based approaches employ a mathematical modelling for the relationship between MR signal and myelin water content for a combination of different sequences (such as spin-echo and spoiled or non-spoiled gradient echo acquisitions). However, these methods rely on a priori assumptions about the expected relaxation rates of the different brain pools, resulting in an increased susceptibility to systematic errors (Lankford and Does, 2012).
Even though many approaches have been published for myelin water content mapping, not much is known about the corresponding whole brain distribution. I.e., apart from the work of Kolind et al. (2012), no full brain quantitative myelin water content atlas has been presented yet. Their work presents an important step towards a more objective assessment of myelin-related alterations in diseases such as multiple sclerosis as it forms a normative standard for the healthy population. However, the results obtained by the mcDESPOT scheme used by Kolind et al. are significantly overestimated with respect to results obtained when using relaxation based methods (Deoni et al., 2008; Kolind et al., 2012). The reason for this systematic shift is still unclear and requires further investigation (Lankford and Does, 2012).
On the other hand, most of the relaxation based techniques either suffer from prolonged measurement times or too low resolution and/or spatial coverage, rendering the reconstruction of a whole brain myelin atlas difficult. Furthermore, those approaches are based on the calculation of ratios between the amplitude of the myelin water pool and the total amplitude of all pools. Therefore, a decreased myelin water content is compatible with an increased numerator or a decreased denominator. In consequence, such methods provide more indirect information about demyelination processes in white matter diseases such as multiple sclerosis, as the cofounding factor of increased total water content is not determined independently. However, it is not to be unexpected that total water content increases in white matter of MS patients as a T1 prolongation in this group was independently confirmed (Vrenken et al., 2006a, 2006b; Manfredonia et al., 2007). As T1 correlates with total proton density, water content might be increased accordingly. This would result in an overestimation of demyelination effects in regions with simultaneous presence of significant oedema.
As previously shown, the average total water content in white matter of healthy subjects ranges between 68% and 72% without significant age or gender effects (Neeb et al., 2006a). However, significant regional variations were observed. If these variations are, at least in parts, dominated by changes in the free water pool, the corresponding myelin water content measurement will be biassed accordingly. Using the brain water model discussed by Laule et al. (2004), it was shown by the authors that a 2% change of water content could explain the observed myelin water content reduction in the MS subjects studied. However, that is exactly the same order of magnitude for physiological variations of white matter water content in a healthy population. Therefore, an absolute quantification of myelin water content could provide a further enhancement of sensitivity so that even smaller changes might be detectable. Vavasour et al. (2009) have recently published results for the simultaneous measurement of total and myelin water content in selected MS lesions. However, their method did not correct for receiver coil and B1 inhomogeneities which is vital in order to minimise systematic errors in absolute water content mapping (Tofts, 2003; Neeb et al., 2006b; Neeb and Shah, 2006; Neeb et al., 2008; Warntjes et al., 2008).
Even though the total water content in normal appearing white matter is effectively regulated (Neeb et al., 2006a), lesions are often associated with an increased water content, which in fact just enables their visibility on FLAIR images. The current work is therefore based on a quantitative MR protocol that enables the simultaneous mapping of total and relative myelin water content, T1 and T2* (Tonkova et al., 2012; Neeb et al., 2008). The availability of total water content was used to obtain an absolute measure of myelin water content. This allows for an objective comparison between the relative and the absolute measurement. First, quantitative myelin water content atlases were created for the relative and absolute measurement based on data from 31 young volunteers. To test for site-independence and for a possible usage of this approach in multicentered studies, we then investigated a different pool of subjects at another site. As the quantitative approach employed is based on standard sequences that are available on almost any modern scanner (Tonkova et al., 2012), it is ideally suited for a multicentre investigation. Only the reconstruction software, which is freely available for download (Neeb, 2012), is required to perform myelin water content mapping. Finally, a group of patients with multiple sclerosis was used to test our approach in white matter lesions and to investigate possible differences between relative and absolute myelin water content.
The objectives of the current study were therefore (1) to investigate differences between absolute and relative quantification of myelin water content, (2) to assess the feasibility of a multicentre measurement of myelin water content using the approach described in (Tonkova et al., 2012), (3) to develop a quantitative myelin water content atlas representative of a healthy young control population, and (4) to investigate the local differences of the myelin water content distribution in white matter of early stage MS patients.
2. Methods
2.1. Relative myelin water content mapping
Myelin water content was reconstructed for each subject based on a multiexponential analysis of the T2* decay (Tonkova et al., 2012). The corresponding signal intensity at 10 different echo times was measured for each voxel using a multi echo gradient echo (MEGE) sequence (Neeb et al., 2008). The maximum TE was approx. 40 ms in order to keep the acquisition time short. Given the measured signal intensity of each voxel at varying echo times i, yimeas, the effective amplitude of different relaxation pools, sj* ≡ s(T2*(j)), was determined by minimising the regularised squared difference between model and data,
| (1) |
Here, the sum runs over 10 echo times, ti, and n is the number of different equidistantly spaced T2* values that are allowed to vary during optimisation. The regularisation term, , was introduced to obtain a smooth distribution of the pool amplitudes as described in Tonkova et al. (2012). Here, A = ∑ j = 1n − 1|sj + 1* − sj*|2 is the sum of squared differences between neighbouring pool amplitudes and the parameter was set to 1. Setting in Eq. (1) resulted in a discrete distribution of the pool amplitudes, sj*. In this case, an increased systematic error and a significant dependence of the optimisation results on SNR have been observed. Both effects were largely suppressed by extending the objective function as shown in Eq. (1). Due to the measurement time constraints (TEMAX = 42 ms), the moderate SNR and the small number of points sampled on the relaxation curve, an unconstrained fit was not feasible. Therefore, the search space was restricted by employing a two pool relaxation model (a fast relaxing pool representing myelin water and a slow relaxing pool for all other MR visible water compartments). Constraining the position and maximum amplitude of each pool, Eq. (1) was subsequently minimised using quadratic programming optimization. Based on the optimisation results, the relative myelin water content WMyrel was defined as the ratio between the signal intensity of the fast relaxing pool and the total signal intensity. The constraints were chosen based on simulation studies and were adapted to each individual decay curve whenever possible. The latter is important to reduce the possible bias given our incomplete knowledge about the true relaxation times. The approach allows for the measurement of myelin water content even with low-SNR data (SNR > 30 of the shortest TE image) and a very sparse sampling of the relaxation curve. A detailed description of the full procedure, including the best choice of constraints, is given in Tonkova et al. (2012).
The T2* decay curve was sampled with a MEGE sequence using the following parameters: TR = 2100 ms, 10 equidistantly spaced echoes between TE = 4.35 ms and TE = 42 ms, FA = 40°, FoV = 256 × 192 mm2, matrix size = 256 × 192, 50 slices with 2 mm thickness, and Tacq = 6 min, 45 s. All data were corrected for signal modulations due to magnetic field inhomogeneities before the start of the optimisation algorithm. Here, a homogeneous voxel with constant field gradient along z-direction was assumed, resulting in a sinc-modulation of the decay curve (Tonkova et al., 2012). The argument of the sinc function is given, apart from constants, by the product of the slice thickness, , and the z-gradient, . The latter was determined form a field offset map, , which was acquired using the phase data of the MEGE sequence. More details are given in Tonkova et al. (2012).
2.2. T1, T2* and total water content mapping
The myelin water content measurement was part of a larger protocol for the quantitative mapping of T1, T2* and total water content. Therefore, a second MEGE sequence with a TR of 700 ms and a flip angle of 70° was measured for the same slices to determine T1 (Neeb et al., 2008). Flip angle and receive coil imperfections were corrected based on three fast EPI scans of the same volume. The full protocol and the corresponding reconstruction approach for T1, T2* and WTotal is detailed in Neeb et al. (2008) and Neeb (2012). Based on the total water content of each voxel, WTotal, the absolute myelin water content is given by WMyabs = WMyrel ⋅ WTotal. In the following, myelin water content always refers to the absolute measurement unless stated otherwise.
All measurements were performed on 3 T Trio systems (Siemens Medical Systems GmbH, Erlangen, Germany) within an acquisition time of approx. 10 min.
The quantitative maps were reconstructed using an in-house developed tool written in C++ (Professional Remagen Diagnostic Image Calculation Tool for MS, predictMS). Due to the computationally expensive determination of myelin water content, processing times ranged between approx. 20 min on a 24 core workstation and 1.5 h on a dual core Macintosh for a single subject. The predictMS source is freely available to the scientific community for research purposes (Neeb, 2012).
2.3. Subjects
To create the atlas, 31 healthy controls were scanned on a 3 T Trio at the Life&Brain research centre (University of Bonn, “Bonn data”). The group consisted of 15 male and 16 female subjects with a mean age of 32.9 ± 6.8 years. To test for site-independence, another group of 9 subjects (6 male and 3 female, age = 35.2 ± 5.6 years) was scanned on a 3 T Trio located at the Radiological Institute Hohenzollernstaße Koblenz (“Koblenz data”). Furthermore, 18 MS patients were also scanned on a 3T Trio at Koblenz. The patient group consisted of 8 male and 10 female subjects with a mean age of 35.1 ± 7.6 years. Only patients with grade 0 disease as evaluated by the expanded disability status scale (EDSS) were included. As the EDSS = 0 group is expected to be comparable to an age and gender matched healthy control population, it presents an ideal test suite to investigate (1) the stability of the quantitative measurement as large parts of the patient brains are expected to be comparable to healthy controls, and (2) the sensitivity of a quantitative myelin atlas to detect possibly existing small focal changes. Informed written consent was obtained from each subject.
2.4. Data processing
In order to normalise each individual dataset to the MN152 space (MNI152_T1_1mm_brain), synthetic T1-weighted data were created based on the quantitative T1 relaxation time of each voxel. A spoiled gradient echo acquisition was simulated using the standard Ernst formula for the signal intensity (Haacke, 1999) and setting TE = 0, TR = 10 ms and FA = 30°. The corresponding data were then processed using the FSL toolbox (www.fmrib.ox.ac.uk/fsl, Smith et al., 2004). First, brain extracted data were created using BET, which were linearly coregistered to the MNI152 space (FLIRT) and finally normalised to the MNI152 atlas using FNIRT. The transformation was applied to the T1, T2*, total and myelin water content maps in order to analyse all quantitative datasets within a common space.
2.5. Atlas calculation and statistical analysis
Based on the normalised maps, mean and standard deviation atlases of T1, T2*, WMyrel and WMyabs were created from all control subjects (“Bonn atlases”) after smoothing the individual datasets with a 5 × 5 Gaussian kernel (σ = 3). To investigate possible differences between scanner sites and/or between control subjects and MS patients, the myelin water contents of the 9 control subjects (Koblenz data) and the 18 EDSS = 0 patients were compared to the corresponding Bonn atlas (Fig. 1). Lesions in the patient datasets were first identified by removing all voxels where T1 and T2* increased by more than 4 standard deviations with respect to the corresponding atlases. This employs the fact that both T1 and T2* are elevated in most lesions. All datasets were visually checked and lesions missed by the automated classification were manually removed. The lesion corrected myelin water content datasets, representative of normal appearing white matter (NAWM), were smoothed with a 5 × 5 Gaussian kernel (σ = 3) and linearly averaged. Finally, a z-value, , was calculated for each location where the relative error of the mean myelin water content in the Bonn cohort was < 8% (Fig. 1). The latter is given by , where σ is the standard deviation of the unsmoothed maps, WMy the average myelin water content (either absolute or relative) and N is the number of subjects. This requirement effectively suppresses grey matter due to the increased σ/WMy-ratio (see Fig. 2; bottom row).
Fig. 1.

Schematic representation of the analysis workflow for the three different groups investigated.
Fig. 2.

The top row shows 5 transverse slices of the absolute water content atlas while the corresponding absolute myelin water content atlas is shown in the middle row. The relative deviation of WMyabs is shown in the bottom row.
In order to test for a statistically significant reduction of WMyabs, the number of voxels with increased myelin water content was counted. The corresponding result was then statistically compared to the number of voxels with decreased myelin water content relative to the Bonn atlas. The corresponding numbers were determined for different cut-offs, zcut,
| (2) |
Here, || refers to the cardinality of the set of points with z-value larger or smaller than the cut-off, zcut. The latter has been varied in the interval [0.5,4]. Due to the formal resemblance of this problem to the analysis of gene-expression data, we refer to Nup (Ndown) as the number of “upregulated” (“downregulated”) voxels. The expressions given by Eq. (2) represent a typical counting experiment, where Nup and Ndown follow a Poisson distribution with standard deviations and , respectively (Brandt, 1998). To test for a statistical significant difference between the number of up- and downregulated voxels, we assume that all voxels with increased myelin water content are simply due to a statistical fluctuation. Therefore, Nup(z) represents the number of “background” events. As we are interested in the possible investigation of demyelination, Ndown(z) represents the corresponding “signal” which is expected to be equal to the background in the control (Bonn) vs. control (Koblenz) comparison. To test for a consistency between signal and background, a t-value, , was calculated for each cut-off. t(zcut) follows a Student's t distribution which can be fairly well approximated by a Gaussian distribution for the numbers involved in the current study (Brandt, 1998). The Equation counts the number of standard deviations by which the signal exceeds the corresponding background. Here, 5 standard deviations were considered significant, which corresponds to p ≈ 2.9 ⋅ 10− 7 for Gaussian distributed data. It can be noted that the approach followed in the current work is completely analogous to the statistical method followed in other disciplines, e.g. for the detection of new particles high-energy particle physics (Neeb, 1998).
In addition to t(zcut), a normalised contrast between signal and background, , was calculated for each cut-off. Based on the observed maximum of t(zcut) at zcut ≈ 2 − 3 (Fig. 3c), regions which differed significantly relative to the Bonn atlas (|z| > 2.0) were marked and superimposed on the corresponding MNI152 template. Finally, the average absolute and relative myelin water contents were determined for each slice and plotted for all three groups as function of slice position in order to investigate possible group differences which affect individual slices only.
Fig. 3.

Panel (a) shows the normalised distribution of the absolute myelin water content, , measured for the Bonn cohort. Here, represents the measured myelin water content at location (in total 31 measurements). The corresponding mean and standard deviation at point are given by and , respectively. Only voxels with a relative error of the mean myelin water content < 8%, using the unsmoothed maps, were included. The corresponding normal probability plot is shown in (b). The distribution of the measured t value as a function of the z-cut is given in (c) while (d) shows the zcut-dependence of the normalised contrast. Data from the Koblenz control cohort are shown in blue whereas patient data are shown in red. Error bars indicate ± 1σ of the corresponding quantities.
The full potential of a quantitative atlas can be evaluated by its sensitivity to depict regions of altered myelin water in individual subjects. Therefore, each of the MS patients was compared to the myelin water content atlas by computing a z-score for every voxel. Again, only voxels with a relative deviation less than 8% of the corresponding Bonn atlas were analysed as described above. A mask was created for voxels with significantly decreased (z < − 3) or increased (z > 3) absolute myelin water content. The number of voxels with z < − 3 defines the “disease volume”. The corresponding reduction of the absolute myelin H2O-content was determined by relating the average myelin water content in the disease volume to the average of all other voxels analysed.
Finally, the same approach was repeated for the relative myelin measurement to compare the relative and absolute disease volumes and their reduction of WMy, respectively.
3. Results
Fig. 2 shows the atlases of total (top row) and absolute myelin water content (middle row) constructed from the 31 control subjects.1 The total water content is lower in white matter (approx. 70%) than in grey matter (approx. 80%), consistent with previous reports (Tofts, 2003; Neeb et al., 2006b, 2008; Warntjes et al., 2008). In contrast, WMyabs ranges between 7 and 11% in white and between 3 and 4% in grey matter, respectively. The decreased grey matter myelin water content results in a corresponding increase of the relative error as shown in the bottom row of Fig. 2.
The distribution of the normalised absolute myelin water content for all Bonn control subjects is shown in Fig 3a. The distribution can fairly well be approximated by a Gaussian with zero mean and standard deviation of one (Fig. 3b), indicating that myelin water content is normally distributed in the healthy control group. Comparing the independently scanned second control group to the atlases based on the cohort on the other scanner showed no contrast between number of up- and downregulated voxels for all the z-cuts investigated (Fig. 3c and d). Therefore, no statistical significant difference between the control subjects measured at Bonn and those measured at Koblenz can be established. As expected, a few regions with increased or decreased absolute myelin water content are visible for the control–control comparison (Fig. 4). The corresponding locations are randomly distributed in space. Furthermore, increased and decreased values were observed with the same frequency, which is characteristic for a statistical fluctuation. Fig. 5a provides more detailed insights into the differences between the two control groups by showing the slice dependence of the average myelin water content (blue and green curves, respectively). Both groups show a consistent pattern with local maxima around slice positions 55, 84 and 104 in the MNI152 space. However, the error increases for the more posterior positions as the number of voxels with a relative deviation of < 8% decreases, resulting in a less reliable measurement. Even though the general trend is consistent, the control group measured at Koblenz shows a significantly elevated average myelin water content at slices 85–93, resulting from an increase in the splenium of the corpus callosum (Fig. 4). Remarkably, this difference is larger for the relative measurement, whereas the corresponding curves are more consistent for WMyabs, as shown in Fig. 5b.
Fig. 4.

Result from the group comparison between both control groups. Areas marked in red (turquoise) correspond to regions with significantly decreased (increased) myelin water content.
Fig. 5.
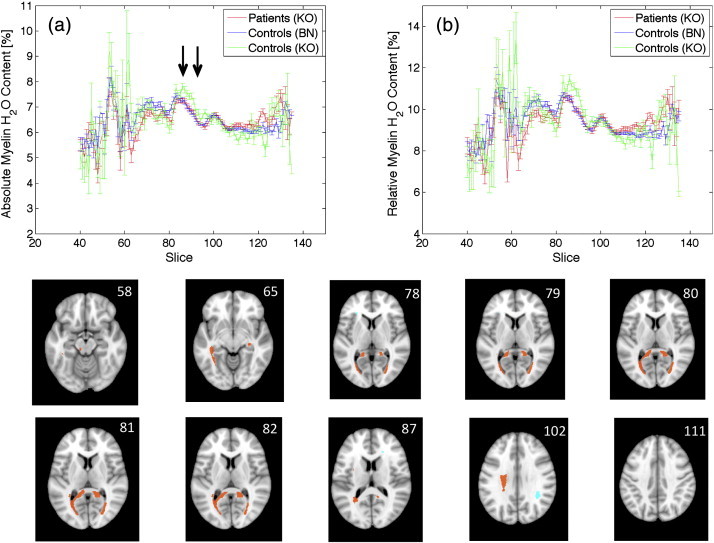
Panel (a) shows the slice dependence of the absolute myelin water content for patients (red curve), control subjects measured in Bonn (blue curve) and control subjects measured in Koblenz (green curve). The corresponding distribution of the relative myelin water content in normal appearing white matter is shown in (b). The last two rows show the result from the comparison between the patient group and the healthy control atlas. Areas marked in red (turquoise) correspond to regions with significantly decreased (increased) myelin water content.
Finally, to test for differences between the relative and absolute myelin water content measurement, the 18 MS patients were compared to the corresponding atlases. No significant differences were observed for the slice dependence of WMyabs between NAWM of MS patients and both control groups (Fig. 5a). The same argument holds for the relative measurement shown in Fig. 5b, which appears almost identical to the absolute measurement. This indicates that no significant difference of the total water content in NAWM between patient and control groups exists. A difference of WTotal would result in a shift of the patient group with respect to the control groups in Fig. 5a, which is, however, not obvious from the comparison between Fig. 5a and b. Furthermore, Fig. 5b shows that the average relative myelin water content ranges between 9 and 11%, consistent with previous reports (Laule et al., 2004; Du et al., 2007; Oh et al., 2007; Hwang et al., 2010; Tonkova et al., 2012; Nguyen et al., 2012).
The group comparison between patients and the absolute myelin water content atlas is shown in Fig. 3c and d. In contrast to the control–control comparison, a significant reduction of myelin water content is observed for the patient group for a wide range of zcut values. Furthermore, the contrast between down- and upregulated voxels increases with zcut, resulting in a smaller portion of falsely classified voxels. The decrease of myelin water content is most prominent in the splenium of the corpus callosum (Fig. 5, two bottom rows). This is in contrast to the corresponding control group (“Koblenz data”) which shows a much more diffuse behaviour with almost randomly distributed regions with increased or decreased myelin water content (Fig. 4).
The different results of the relative vs. absolute measurement can be illustrated by looking at individual patients (Fig. 6). Two aspects can be noted. First, most but not all lesions visible on a T1 map (right) show a decrease in the absolute myelin water content. Moreover, regions with the strongest decrease of WMyabs are all associated with lesions. In addition, WMyabs is reduced in otherwise normal appearing white matter, therefore showing white matter regions with demyelination but no corresponding increase in free water content and T1. Most importantly, however, Fig. 7 demonstrates that the corresponding disease volume as well as the average reduction of myelin water content are significantly larger if a relative measurement is performed. The relative disease volume is overestimated by (7.3 ± 3.3) % (range 3.8%–13.9%) while the elevation is slightly smaller for the corresponding relative measurement of the myelin water content reduction ((5.6 ± 1.5)%; range 3.6%–8.1%). On average, WMyabs of the disease volume is reduced by (44.8 ± 1.7)% with respect to normal appearing white matter.
Fig. 6.
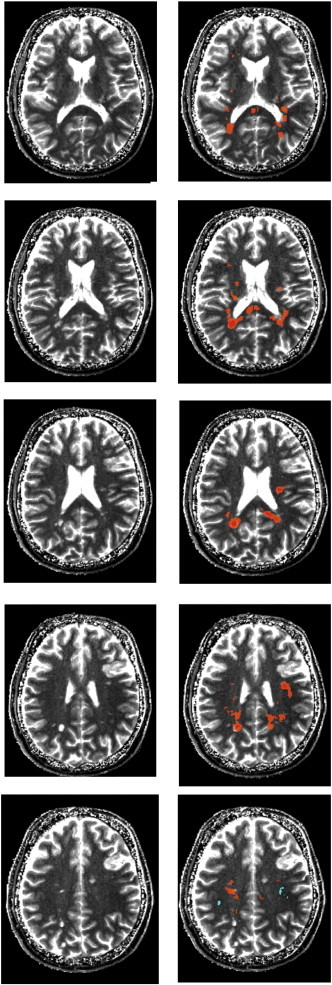
Left column: T1 maps for 5 transverse slices through the brain of an individual MS patient. Right column: Results from the comparison between the individual MS patient and the absolute myelin water content atlas. Areas marked in orange (turquoise) correspond to regions with significantly decreased (increased) myelin water content, where |z| > 3 was required. Regions with z < − 4 are shown in red.
Fig. 7.

Panel (a) shows the total disease volume for the absolute and the relative measurement of myelin water content while the corresponding reductions of WMyabs are shown in (b). The ratio between relative and absolute measurement is shown in (c).
4. Discussion and conclusion
In the current study, a full brain myelin water content atlas was developed using a new and fast method for myelin water content mapping (Tonkova et al., 2012). The goals of the study were fourfold: (1) investigate the independence of scanner location, which is one of the key assumptions underlying quantitative MRI; (2) develop a quantitative whole brain myelin water content atlas, representative of a healthy young control population; (3) investigate the relevance of an absolute measurement of myelin water content and (4) detect changes of myelin water content in low-grade MS patients, both on a group and individual level using the newly developed atlas.
4.1. Comparison between different sites
In our investigation, two healthy control groups were scanned at different locations. Therefore, one should be aware of potential systematic errors that might bias the results. One potential pitfall, which could systematically shift the myelin measurement, results from field homogeneity differences. A spatially varying B0 field results in a more rapid decay of the FID, resulting in a reduced T2*. This might bias the myelin water content measurement as the spacing between the two water compartments decreases, resulting in an overestimation of the fast relaxing myelin pool. As previously shown, a significant bias is expected for relaxation times of the free water pool (T2,free*) below approx. 35 ms, where a reliable separation between both water compartments is no longer feasible (Tonkova et al., 2012). However, T2,free* typically ranges between 45 ms and 65 ms in white matter, well above the 35 ms limit where pools start to overlap significantly. Furthermore, the means obtained for WMyrel in white and grey matter in both control groups were consistent with previous reports. This adds an additional confidence that myelin water content maps are comparable between different sites as consistent results were obtained.
Most importantly, however, the myelin water content obtained for the healthy control group measured in Koblenz was consistent with the data measured at a different location (Bonn). The observed differences were randomly distributed in space, in contrast to the corresponding differences between patient and control group (Figs. 4 and 5). Furthermore, the control–control comparison did not result in a statistical significant difference between the number of up- and downregulated voxels.
However, the average myelin water content at different transverse slices revealed a significant deviation between both control groups in a few slices containing the splenium of the corpus callosum. Interestingly, this difference was reduced for the absolute measurement of myelin water content, although not completely. This indicates that variations in WTotal, rather than variations in myelin water content, might be responsible for the effect. Nevertheless, it is unclear what has caused those differences. They might be attributed to the small sample size, possibly in conjunction with the gender imbalance in the Koblenz group (6 male vs. 3 female subjects). However, it was previously shown that the average total water content in white matter is independent of gender or age (Neeb et al., 2006a). Indeed, we did not observe a significant shift between the male and female data when investigating the slice dependence of WMyabs separately for both groups. Furthermore, a statistical fluctuation due to the small sample size is very unlikely given the observed consistent increase in 9 consecutive slices. In case of a statistical fluctuation, one would rather expect a randomly distributed pattern, which is, however, not observed. On the other hand, the almost perfect consistency between patient (Koblenz) and control (Bonn) data in that slice range provides additional confidence that the observed effect is due to a systematic error of the total water content measurement in the Koblenz control group. However, the reason for the observed deviation is unclear and requires further investigation.
4.2. Patient vs. control comparison
The comparison between the MS patient group and the healthy control atlas revealed a significant reduction of myelin water content in the EDSS = 0 group. For a z-cut of |zcut| > 2, the number of voxels with a reduced myelin water content is a factor ≈ 2 larger than the number of voxels with increased myelin water content (see Fig. 3d). The ratio increases to ≈ 19 for |zcut| > 4, although accompanied by a slightly reduced statistical significance. In contrast, the corresponding numbers are almost equal for the control (Koblenz) vs. control (Bonn) comparison for all cut values. Voxels with decreases myelin water content were found in the splenium of the corpus callosum and the optic radiation. Furthermore, regions of distinct myelin water content reduction were obtained from the comparison between an individual subject and the quantitative atlas. Those regions are located in white matter that appears either normal or abnormal on the corresponding T1 map. The strongest effects were observed for MS lesions, whereas normal appearing WM was less affected with respect to disease volume and myelin water content reduction.
However, one has to note the rather large false discovery rate of the current study, as no multi-comparison correction has been applied. Therefore, from a conservative perspective, we have to conclude that a significant reduction of myelin water content could be established for the EDSS = 0 cohort, whereas the information obtained about the spatial location has to be interpreted with care. To be more concrete, approx. one third of the “significant voxels” for |zcut| > 2 and ≈ 20% for |zcut| > 3 are false positive. As such, the difference between up- and downregulated voxels would be the most proper biomarker for the investigation of myelin water content changes based on the method employed here.
Similar to our study, Kolind et al. (2012) has recently described alterations of the spatial myelin water content in 17 MS patients, based on the comparison with a quantitative atlas. However, their objective was to assess the primary progressive subtype only so that patients with higher EDSS (median = 5.5) were included. In contrast, the current study focused on the detection of brain myelin water content changes in early stage patients with an EDSS score of zero. As a negative correlation between parenchymal volume fraction and EDSS exists (Kitzler et al., 2012), a group with constant EDSS should minimise differences introduced during the normalisation of data and should therefore result in a more reliable comparison between patients and control subjects.
4.3. Absolute vs. relative measurement of myelin water content
The relative measurement of myelin water content, which has been employed in most previous studies, appears to work well for normal appearing white matter as the corresponding total water content is strongly regulated in a healthy control population (Neeb et al., 2006a). The same applies for NAWM of subjects with low grade MS where no significant difference between the absolute and relative quantification was observed in the current study. However, the relative measurement results in larger “disease volumes” with a correspondingly stronger reduction of the apparent tissue myelination. Similar to the disease volume parameter defined in the current study, a deficient myelin water fraction volume has recently been introduced as marker for the differentiation between CIS patients and a control population (Kitzler et al., 2012). Furthermore, their measure allowed for the discrimination between relapsing–remitting and secondary progressive disease courses. As no corrections for total water content changes were made, it remains unclear if the discrimination results from demyelination, oedema or a combination of both. Indeed, we have observed an overestimation of disease volume by approx. 6% when the calculations were based on a relative measurement. Therefore, an absolute measurement is indispensable for the accurate determination of demyelination of MS lesions that are accompanied by oedema.
The results obtained for the relative myelin water content in white matter (8–14%) are consistent with results obtained by other relaxation based approaches (Laule et al., 2004; Du et al., 2007; Oh et al., 2007; Hwang et al., 2010; Hwang et al., 2011; Nguyen et al., 2012), whereas the work of Kolind et al. (2012) reports values which are approx. 100% larger (15%–25%). These authors have presented a myelin water content atlas which is based on data acquired with the mcDESPOT scheme(Deoni et al., 2008; Kolind et al., 2012). However, due to the inconsistent results obtained, this otherwise elegant and efficient model-based approach does not allow for a direct comparison between the corresponding atlas and patient data acquired with relaxation based methods, including the de facto gold-standard introduced by MacKay et al. (Laule et al., 2004).
4.4. Limitations
The main limitation of the current study is related to the relatively large statistical error of the myelin water content measurement, which is approximately ± 28% in white matter. This is mainly caused by (1) the small voxel volume of 2 mm3 and (2) the sparse sampling of the T2* decay curve (Tonkova et al., 2012). A straightforward remedy would be an increase of the voxel volume. Indeed, many researchers employ larger volumes when using 2D sequences, which typically range between 3.5 mm3 and 20 mm3 (Laule et al., 2004; Du et al., 2007; Oh et al., 2007; Hwang et al., 2010). The corresponding error would indeed drop to ± 16% when scaled to the voxel volume of 3.5 mm3, which was previously used by Du et al. (Du et al., 2007). However, as the protocol allows for high resolution T1, T2* and total water content mapping, a reduced resolution would adversely affect both image registration and segmentation which are based on those parameters. Therefore, the myelin water content maps were smoothed during post-processing. However, smoothing schemes other than the straightforward application of a Gaussian filter might further improve the results. Recently, Hwang et al. have presented a spatially regularised nonnegative least squares approach (Hwang et al., 2011). Their work is based on diffusion-filtered images to iteratively constraint the fit. A similar scheme can easily be incorporated in our method by adding additional constraints during optimisation. Here, the main challenge will be related to the optimisation of the anisotropic diffusion filter in order to control systematic errors, especially in small regions of focal demyelination.
The relatively low precision is not a real problem for the atlas generation as long as the accuracy is high. The latter has been demonstrated previously if the SNR of the shortest TE image exceeds 30–40 (Tonkova et al., 2012). As the relative deviation of a measurement decreases as , a low precision in the myelin maps can be compensated by an increase of the number of subjects, N. In the current work, the relative error is reduced by a factor of . Even though the variance can be further reduced by increasing N, a significantly reduced myelin water content could already be established in the EDSS = 0 cohort. Furthermore, regions with reduced myelin water content were observed in the comparison between individual subjects and the atlas. Those regions were mostly associated with visible lesions where a reduction of myelin water content has also been observed before (Laule et al., 2004; Du et al., 2007; Oh et al., 2007; Hwang et al., 2010, 2011; Nguyen et al., 2012; Vavasour et al., 2009). However, as already stated above, the limited precision currently limits a deeper analysis of the spatial distribution of WMyabs. Improved smoothing schemes might help to overcome this problem in the future.
As a 2D sequence has been employed in the current work, magnetisation transfer might be a potential bias that decreases the measurement accuracy. Indeed, rather fast cross-relaxation times between solid myelin and myelin water of approx. 70 − 140 ms have been observed both in vivo and in excised bovine brain (Kalantari et al., 2011; Bjarnason et al., 2005). Given the TR of 42 ms employed in the current study, one could expect that magnetisation transfer between those two compartments might play a significant role. However, one has to consider the acquisition order of the different slices, which followed an interleaved scheme in the current study: 1, 3, …, (N − 1), 2, 4, … N. Given the width of the solid myelin peak of approx. 40 ppm (Wilhelm et al., 2012) and the acquisition parameters of our measurement (z-gradient approx. 30 mT/mm; slice thickness 2 mm and spacing between adjacent slices = 3 mm), it is straightforward to prove that the solid myelin pool of the ith slice is mainly excited by off-resonance pulses from the two neighbours, i.e. slices i − 1 and i + 1. Therefore, the effective TR between an excitation of solid myelin and myelin water is ≈ 1 s for the interleaved scheme employed here. Based on this experimental setup, we have solved the Bloch-equations using a four-pool model of white matter, in complete analogy to the work of Kalantari et al. (2011) and using the parameters specified therein (results not shown) The basic result is that the bias introduced by magnetisation transfer between solid myelin and myelin water is negligible (systematic error approx. 1–4%) as T1 relaxation has recovered most of the signal within an effective TR of 1 s. However, this result is only preliminary and requires further validation in vivo, which is outside the scope of the current work.
The gradient echo sequences employed in the current work are sensitive to spatially varying static magnetic field inhomogeneities, . Different factors contribute to an inhomogeneous B0, such as susceptibility gradients or imperfect shimming. The field homogeneity is further reduced by internal sources resulting e.g. from the deposition of paramagnetic substances. Indeed, a significant accumulation of iron in deep grey matter has been observed in subjects with MS (Ge et al., 2007). In a gradient echo experiment, all spatially varying static components of result in a more rapid signal decay. Therefore, the separation between fast and slow component decreases, resulting in a potential overestimation of myelin water content. As already stated above, the myelin water content measurement is significantly biassed if the slow relaxation time decreases below ≈ 35 ms (Tonkova et al., 2012). In our cohort, a T2* of < 35 ms was exclusively observed within the globus pallidus. Therefore, the corresponding myelin water content within that region has to be interpreted with care. It should be noted that spin-echo based approaches might be the preferable choice for the study of myelin water content within the globus pallidus as they are largely immune against static field inhomogeneities.
Another potential drawback of the current study is the possibly improper removal of MR visible lesions. Nevertheless, this might not severely impair the conclusions drawn as (1) all lesion masks where checked and manually corrected whenever necessary and (2) lesions in individual patients typically occur at different locations in space, therefore partly averaging the effect out. We have observed that the simple and fast approach for lesion segmentation based on quantitative T1 and T2* atlases works very efficient and allows for the detection of most lesions. However, grey matter partial volume effects, resulting from a non-perfect normalisation, are classified as lesion due to the increased T1 and T2* of grey matter with respect to white matter. Even though this might impair the accurate lesion detection, the removal of such regions is advantageous for the group comparison as is reduces partial volume misclassifications. We are currently working on an improved automated scheme to identify regions with MR visible lesions in order to further suppress the potential systematic error introduced by their possible negligence.
4.5. Summary
In summary, the current study has demonstrated that a quantitative absolute myelin water content atlas has the potential to identify distinct regions of demyelination, even in patients with mild disease. Moreover, such a comparison might be performed for data acquired at different centres. This is an important requirement for the objective assessment of new myelin water content mapping approaches before they can be translated into a clinical setting. It was shown that an absolute quantification of myelin water content is superior over a relative measurement if significant oedema is present. The results obtained by our method are consistent with literature reports which demonstrate that a reproducible absolute myelin water content mapping with high resolution and full brain coverage can be performed in approx. 10 min.
Acknowledgements
The authors wish to thank Dr. Andreas Böer for his support in patient recruitment.
Footnotes
This is an open-access article distributed under the terms of the Creative Commons Attribution-NonCommercial-No Derivative Works License, which permits non-commercial use, distribution, and reproduction in any medium, provided the original author and source are credited.
The full atlases can be downloaded from the link given in Neeb (2012).
References
- Andrews T., Lancaster J.L., Dodd S.J., Contreras-Sesvold C., Fox P.T. Testing the three-pool white matter model adapted for use with T2 relaxometry. Magnetic Resonance in Medicine. 2005;54:449–454. doi: 10.1002/mrm.20599. [DOI] [PubMed] [Google Scholar]
- Bjarnason T.A., Vavasour I.M., Chia C.L.L., MacKay A.L. Characterisation of the NMR behaviour of white matter in bovine brain. Magnetic Resonance in Medicine. 2005;54:1072–1081. doi: 10.1002/mrm.20680. [DOI] [PubMed] [Google Scholar]
- Brandt S. 3rd ed. Springer; New York, NY, USA: 1998. Data Analysis. (1998) [Google Scholar]
- Deoni S.C., Rutt B.K., Arun T., Pierpaoli C., Jones D.K. Gleaning multicomponent T1 and T2 information from steady-state imaging data. Magnetic Resonance in Medicine. 2008;60:1372–1387. doi: 10.1002/mrm.21704. [DOI] [PubMed] [Google Scholar]
- Du Y.P., Chu R., Hwang D., Brown M.S., Kleinschmidt-DeMasters B.K., Singel D., Simon J.H. Fast multislice mapping of the myelin water fraction using multicompartment analysis of T2* decay at 3T: a preliminary postmortem study. Magnetic Resonance in Medicine. 2007;58:865–870. doi: 10.1002/mrm.21409. [DOI] [PubMed] [Google Scholar]
- Ge Y., Jensen J.H., Lu H., Helpern J.A., Miles L., Inglese M., Babb J.S., Herbert J., Grossman R.I. Quantitative assessment of iron accumulation in the deep gray matter of multiple sclerosis by magnetic field correlation imaging. American Journal of Neuroradiology. 2007;28:1639–1644. doi: 10.3174/ajnr.A0646. [DOI] [PMC free article] [PubMed] [Google Scholar]
- Haacke E.M. J. Wiley & Sons; 1999. Magnetic Resonance Imaging. [Google Scholar]
- Hwang D., Kim D.H., Du Y.P. In vivo multi-slice mapping of myelin water content using T2* decay. NeuroImage. 2010;52:198–204. doi: 10.1016/j.neuroimage.2010.04.023. [DOI] [PubMed] [Google Scholar]
- Hwang D., Chung H., Nam Y., Du Y.P., Jang U. Robust mapping of the myelin water fraction in the presence of noise: synergic combination of anisotropic diffusion filter and spatially regularized nonnegative least squares algorithm. Journal of Magnetic Resonance Imaging. 2011;34:189–195. doi: 10.1002/jmri.22586. [DOI] [PubMed] [Google Scholar]
- Kalantari S., Laula C., Bjarnason T.A., Vavasour I.M., MacKay A.L. Insight into in vivo magnetisation exchange in human white matter regions. Magnetic Resonance in Medicine. 2011;66:1142–1151. doi: 10.1002/mrm.22873. [DOI] [PubMed] [Google Scholar]
- Kitzler H.H., Su J., Zeineh M., Harper-Little C., Leung A., Kremenchutzky M., Deoni S.C., Rutt B.K. Deficient MWF mapping in multiple sclerosis using 3D whole-brain multi-component relaxation MRI. NeuroImage. 2012;59:2670-2670. doi: 10.1016/j.neuroimage.2011.08.052. [DOI] [PMC free article] [PubMed] [Google Scholar]
- Kolind S., Matthews L., Johansen-Berg H., Leite M.I., Williams S.C.R., Deoni S.C., Palace J. Myelin water imaging reflects clinical variability in multiple sclerosis. NeuroImage. 2012;60:263–270. doi: 10.1016/j.neuroimage.2011.11.070. [DOI] [PMC free article] [PubMed] [Google Scholar]
- Lankford C.L., Does M.D. On the inherent precision of mcDESPOT. Magnetic Resonance in Medicine. 2012 doi: 10.1002/mrm.24241. [DOI] [PMC free article] [PubMed] [Google Scholar]
- Laule C., Vavasour I.M., Moore G.R.W., Oger J., Li D.K.B., Paty D.W., MacKay A.L. Water content and myelin water fraction in multiple sclerosis A T2 relaxation study. Journal of Neurology. 2004;251:284–293. doi: 10.1007/s00415-004-0306-6. [DOI] [PubMed] [Google Scholar]
- Lenz C., Klarhöfer M., Scheffler K. Feasibility of in vivo myelin water imaging using 3D multigradient-echo pulse sequences. Magnetic Resonance in Medicine. 2011 doi: 10.1002/mrm.23241. [DOI] [PubMed] [Google Scholar]
- Manfredonia F., Ciccarelli O., Khaleeli Z., Tozer D.J., Sastre-Garriga, Miller D.H., Thompson A.J. Normal-appearing brain T1 relaxation time predicts disability in early primary progressive multiple sclerosis. Archives of Neurology. 2007;64:411–415. doi: 10.1001/archneur.64.3.411. [DOI] [PubMed] [Google Scholar]
- R. Mathur-De Vré. Biomedical implications of the relaxation behaviour of water related to NMR imaging, British Journal of Radiology 57 (1984) 955–976. [DOI] [PubMed]
- Neeb, H., 1998. Development of a new method for the improved estimation of statistical significances in high-energy physics and determination of upper bounds for the Ωc cross section in 330 GeV/c Σ−-nucleus interactions (in German). PhD dissertation, University of Heidelberg.
- Neeb H. Source code and compiled executables of predictMS for Macintosh, Linux and Windows systems as well as a test dataset can be obtained from. 2012. http://www.rheinahrcampus.de/Downloads.4916.0.html
- Neeb H., Shah N.J. Enhancing the precision of quantitative water content mapping by optimizing sequence parameters. Magnetic Resonance in Medicine. 2006;56:224–229. doi: 10.1002/mrm.20929. [DOI] [PubMed] [Google Scholar]
- Neeb H., Zilles K., Shah N.J. Fully automated detection of quantitative water content changes: application to the study of age-and gender related cerebral H2O patterns with quantitative MRI. NeuroImage. 2006;29:910–922. doi: 10.1016/j.neuroimage.2005.08.062. [DOI] [PubMed] [Google Scholar]
- Neeb H., Zilles K., Shah N.J. A new method for fast quantitative mapping of absolute water content in vivo. NeuroImage. 2006;31:1156–1168. doi: 10.1016/j.neuroimage.2005.12.063. [DOI] [PubMed] [Google Scholar]
- Neeb H., Ermer V., Stocker T., Shah N.J. Fast quantitative mapping of absolute water content with full brain coverage. NeuroImage. 2008;42:1094–1109. doi: 10.1016/j.neuroimage.2008.03.060. [DOI] [PubMed] [Google Scholar]
- Nguyen T.D., Wisnieff C., Cooper M.A., Kumar D., Raj A., Spincemaille P., Wang Y., Vartanian T., Gauthier S.A. T2 prep three-dimensional spiral imaging with efficient whole brain coverage for myelin water quantification at 1.5 Tesla. Magnetic Resonance in Medicine. 2012;67:614–621. doi: 10.1002/mrm.24128. [DOI] [PubMed] [Google Scholar]
- Oh J., Han E.T., Lee M.C., Nelson S.J., Pelletier D. Multislice brain myelin water fractions at 3T in multiple sclerosis. Journal of Neuroimaging. 2007;17:156–163. doi: 10.1111/j.1552-6569.2007.00098.x. [DOI] [PubMed] [Google Scholar]
- Smith S.M., Jenkinson M., Woolrich M.W., Beckmann C.F., Behrens T.E.J., Johansen-Berg H., Bannister P.R., De Luca M., Drobnjak I., Flitney D.E. Advances in functional and structural MR image analysis and implementation as FSL. NeuroImage. 2004;23:208–S219. doi: 10.1016/j.neuroimage.2004.07.051. [DOI] [PubMed] [Google Scholar]
- Tofts P.S. In: Quantitative MRI of the Brain. Tofts Paul., editor. John Wiley & Sons, Ltd; 2003. [Google Scholar]
- Tonkova V., Arhelger V., Schenk J., Neeb H. Rapid myelin water content mapping on clinical MR systems. Zeitschrift für Medizinische Physik. 2012;22:133–142. doi: 10.1016/j.zemedi.2011.09.005. [DOI] [PubMed] [Google Scholar]
- Vavasour I.M., Laule C., Li D.K.B., Oger J., Moore G.R.W., Traboulsee A., MacKay A.L. Longitudinal changes in myelin water fraction in two MS patients with active disease. Journal of the Neurological Sciences. 2009;276:49–53. doi: 10.1016/j.jns.2008.08.022. [DOI] [PubMed] [Google Scholar]
- Vrenken H., Geurts J.J.G., Knol D.L., Noor van Dijk L., Dattola V., Jasperse B., van Schijndel R.A., Polman C.H., Castelijns J.A., Barkhof F., Pouwels P.J.W. Whole-brain T1 mapping in multiple sclerosis: global changes of normal-appearing gray and white matter. Radiology. 2006;240:811–820. doi: 10.1148/radiol.2403050569. [DOI] [PubMed] [Google Scholar]
- Vrenken H., Rombouts S.A.R.B., Pouwels P.H.W., Barkhof F. Voxel-based analysis of quantitative T1 maps demonstrates that multiple sclerosis acts throughout the normal-appearing white matter. American Journal of Neuroradiology. 2006;27:868–874. [PMC free article] [PubMed] [Google Scholar]
- Warntjes J.B.M., Dahlquist Leinhard O., West J., Lundberg P. Rapid magnetic resonance quantification on the brain: optimization for clinical usage. Magnetic Resonance in Medicine. 2008;60:320–329. doi: 10.1002/mrm.21635. [DOI] [PubMed] [Google Scholar]
- Wilhelm M.J., Ong H.H., Wehrli S.L., Li C., Tasi P.-H., Hackneyy D.B., Wehrli F.W. Direct magnetic resonance detection of myelin and prospects for quantitative imaging of myelin density. PNAS. 2012;109:9605–9610. doi: 10.1073/pnas.1115107109. [DOI] [PMC free article] [PubMed] [Google Scholar]