

Abstract
Studies attempting to map post-stroke cognitive or motor symptoms to lesion location have been available in the literature for over 150 years. In the last two decades, two computational techniques have been developed to identify the lesion sites associated with behavioural impairments. Voxel Based Morphometry (VBM) has now been used extensively for this purpose in many different patient populations. More recently, Voxel-based Lesion Symptom Mapping (VLSM) was developed specifically for the purpose of identifying lesion–symptom relationships in stroke patients, and has been used extensively to study, among others functions, language, motor abilities and attention. However, no studies have compared the results of these two techniques so far. In this study we compared VLSM and VBM in a cohort of 20 patients with chronic post-stroke aphasia. Comparison of the two techniques showed overlap in regions previously found to be relevant for the tasks used, suggesting that using both techniques and looking for overlaps between them can increase the reliability of the results obtained. However, overall VBM and VLSM provided only partially concordant results and the differences between the two techniques are discussed.
Keywords: VBM, VLSM, Stroke, Lesion
Highlights
► VBM and VLSM are both used for lesion–symptom mapping in stroke. ► No studies have compared the results of these two methods so far. ► Here, VLSM and VBM were compared in a cohort of patients with post-stroke aphasia. ► VBM and VLSM provide only partially concordant results.
1. Introduction
The anatomical correlates of cognitive functions have been discussed in Western literature for many years, with the early works by Broca and Wernicke being some of the most famous ones. Until recently, two main methodologies dominated the scene of mapping symptoms to lesions. In the older, ‘lesion-defined’ technique, two groups of patients with different types of lesions (for example, perisylvian versus extra-sylvian, as in Rapcsak et al., 2009) are compared on behavioural measurements. If one group is significantly more impaired on a specific behavioural measurement, then this behaviour is typically attributed to the relevant brain area. Although widely used, this method has a few major caveats. Firstly, by only analysing chosen areas in the brain, one might overlook the importance of areas outside these regions, as well as the distinct importance of subareas within the region. Secondly, this technique requires two groups of relatively homogenous populations with regard to the site of stroke, which is often not possible or realistic given the variability in stroke topography. The second, more recent technique groups patients according to behavioural deficit rather than lesion site. Using this method, one would compare two groups of patients with different behavioural abilities, examining whether they also differ in the site of lesion (for an example see Dronkers, 1996). This approach has caveats as well, with the main one being that behavioural symptoms need to be defined as either preserved or impaired. Clearly, most behavioural measurements are more complex and therefore by examining binary behavioural scores, crucial and interesting data can be overlooked. Moreover, the cut-off point can be arbitrary at times, resulting in different outcomes when using different cut-off points. As a consequence, researchers often tend to study groups of patients showing extreme behavioural profiles; patients with substantial impairment versus those with no impairment at all. By doing so, again, essential data are lost and the study cannot be easily generalised to untested patient populations.
Building on this clear need for an improvement on the existing techniques, Bates et al. (2003) have developed the Voxel-based Lesion Symptom Mapping (VLSM) which is a modification on the second group of techniques mentioned above which associate behaviour to lesion site, on a voxel-by-voxel basis. In VLSM, lesioned areas are defined and for each voxel, patients are then divided into two groups according to whether they do or do not have a lesion affecting this particular voxel. Behavioural scores are then compared for these two groups, yielding a t-statistic for that voxel. The procedure is then repeated across all voxels lesioned in one or more patients. This method deals with some of the caveats of previous techniques; the difficulty in finding patients with similar lesions, the disadvantage of analysing lesions which cover large areas without distinguishing sub-regions within the lesion, and the loss of information when using binary behavioural data.
VLSM is an efficient method for mapping behaviour onto lesions in chronic stroke patients and many studies have used it to study language impairments (Baldo and Dronkers, 2007; Baldo et al., 2006; Bates et al., 2003; Borovsky et al., 2007; Dick et al., 2007; Dronkers et al., 2004; Piras and Marangolo, 2007; Richter et al., 2007; Saygin et al., 2004; Wilson and Saygin, 2004), attention (Grandjean et al., 2008; Molenberghs et al., 2008), executive functions (Ploner et al., 2005), motion detection (Saygin, 2007) and motor deficits (Schoch et al., 2006), amongst other functions.
Another voxel-based method that has been used to map the relationship between lesions and behaviour is Voxel Based Morphometry (VBM) (Ashburner and Friston, 2000). VBM is a fully automated technique which aims at identifying local differences in tissue composition, after discarding gross anatomical differences between individuals (Ashburner and Friston, 2000; Mechelli et al., 2005). Voxel intensities are measured with a continuous parameter, and compared between groups or correlated with behavioural or other measurements, in order to define brain regions that are relevant for the behaviour in question (Ashburner and Friston, 2000). It is possible to analyse the entire brain or focus on specific ROIs. Since its inception, VBM has been used extensively to identify the structural integrity of brain tissue in neurologically impaired patients (Baron et al., 2001; Gitelman et al., 2001; Karas et al., 2003; Kassubek et al., 2002; Mummery et al., 2000; Rosen et al., 2002). VBM has also been used to investigate lesion–symptom mappings in stroke patients with a variety of behavioural impairments, such as language and working memory (Leff et al., 2009; Rowan et al., 2007), motor function (Gauthier et al., 2008; Price et al., 2010) and cognitive impairment (Grau-Olivares et al., 2007; Stebbins et al., 2008).
While VBM and VLSM may be used for similar purposes, differences in their implementation can be substantial. The first is that in VLSM voxels are classified in a binary fashion (lesioned or not lesioned), while in VBM voxels have a value along a continuous parameter. The use of continuous lesion measures could be more sensitive in some contexts (if it correlates linearly with behaviour) but less sensitive in other contexts (if there is a non-linear relationship between lesion and behaviour). Secondly, lesion reconstruction prior to implementing VLSM has traditionally used manual tracing of the lesion; whereas VBM defines voxel intensity automatically, for each voxel separately. Drawing lesions manually for VLSM is highly time-consuming and potentially somewhat subjective. Moreover, VLSM when based on manual lesion reconstruction can only analyse areas where the lesion was defined as present in at least one participant, and therefore, one cannot draw conclusions about areas which are not analysed but might be relevant for the specific function. For example, after stroke, and especially in the chronic stages, remote areas might show Wallerian degeneration. These areas might not be easily distinguishable on the structural brain images and are therefore less likely to be included in the manual lesion definition, although they possibly influence the behaviour under investigation. VBM, on the other hand, can employ a whole brain analysis, and potentially, can identify subtle differences in tissue composition. Additionally, a bias in the selection of areas in VLSM might arise from a few different sources. For example, in the chronic stage after stroke there is often a distortion of the grey and white matter due to gliosis, atrophy and collapse, with changes in the shape and relative size of the ventricles. However, when drawing the lesion, enlarged ventricles may or may not be included in the lesion. When not included, periventricular areas which are damaged in many patients will be excluded from the analysis.
In summary, both techniques can be used to relate structure to function, and the results of both can be easily compared to findings from studies of healthy participants, since both techniques generate statistical maps in normalised space. However, although the two techniques are often used for the same purposes, to date, no studies have directly compared them. We therefore explored the differences between the two imaging analysis techniques in a cohort of chronic stroke patients with language impairment following a left Middle Cerebral Artery (MCA) territory stroke. We examined three language abilities: auditory sentence comprehension, word repetition and object naming. These three tasks represent different aspects of language processing which were widely studied in the past using various techniques (Bates et al., 2003; Friederici, 2002; Martin, 2003; Price, 2010; Price et al., 2005; Richardson and Price, 2009).
2. Materials and methods
2.1. Participants
21 patients with chronic stroke (at least 6 months post-stroke) participated in the study (14 M/7 F; age range: 21–81; mean age: 64 ± 15; mean number of years of education: 12 ± 3; mean time since last stroke: 27 ± 21 months). All developed aphasia following a left MCA territory stroke, were above 18 years of age, and were native speakers of English. The diagnosis of aphasia was based on the convergence of clinical consensus and the results of a standardised aphasia examination — the Comprehensive Aphasia Test (CAT, Swinburn et al., 2004). All patients had comprehension level which allowed them to give consent to the study and understand the behavioural tasks. Patients had no history of other neurological or psychiatric disorders and no major cognitive impairment. Table 1 presents additional demographic and clinical information. The study was approved by the Cambridge Research Ethics Committee and all participants read an information sheet and gave written consent.
Table 1.
Demographic and clinical information.
| Nu. | Age | Years of formal education | Sex | Type of stroke | Time between last stroke and behavioural assessment (months)a | Time between last assessment and MRI scan (months:days) | Scanner | Handednessb | Auditory sentence comprehension | Object naming | Word repetition |
|---|---|---|---|---|---|---|---|---|---|---|---|
| 1 | 66 | 13 | m | ischaemic | 11 | 02:04 | 3 T MRI | R | 30 | 18 | 12 |
| 2 | 69 | 16 | m | ischaemic | 22 | 00:27 | 3 T MRI | R | 18 | 0 | 0 |
| 3 | 73 | 6 | m | ischaemic | 18 (29, R, i) | 00:26 | 3 T MRI | L | 28 | 43 | 29 |
| 4 | 62 | 16 | m | haemorrhagic | 10 | 08:01 | 3 T MRI | R | 32 | 48 | 32 |
| 5 | 78 | 12 | m | ischaemic | 64 (92, R, i) | 00:17 | 3 T MRI | A (− 0.1) | 20 | 14 | 6 |
| 6 | 69 | 13 | m | ischaemic | 25 (several TIAs) | 00:07 | 3 T MRI | R | 30 | 46 | 30 |
| 7 | 78 | 9 | f | ischaemic | 9 | 08:17 | 3 T MRI | R | 30 | 45 | 32 |
| 8 | 78 | 9 | m | ischaemic | 20 (50, L, i) | 01:10 | 3 T MRI | L | 16 | 24 | 25 |
| 9 | 73 | 11 | m | ischaemic | 10 | 02:10 | 1.5 T MRI | R | 32 | 46 | 32 |
| 10 | 21 | 13 | f | ischaemic | 15 | 02:22 | 1.5 T MRI | R | 28 | 40 | 32 |
| 11 | 42 | 13 | f | ischaemic | 13 | 04:14 | 3 T MRI | R | 27 | 40 | 32 |
| 12 | 81 | 11 | m | ischaemic | 19 (72, L, i) | 00:12 | 3 T MRI | R | 18 | 13 | 26 |
| 13 | 62 | 20 | m | ischaemic | 16 | 09:03 | 3 T MRI | R | 27 | 45 | 30 |
| 14 | 65 | 10 | f | haemorrhagic | 24 | 12:27 | 1.5 T MRI | R | 28 | 34 | 18 |
| 15 | 71 | 10 | m | ischaemic | 59 | 02:19 | 1.5 T MRI | R | 6 | 11 | 7 |
| 16 | 79 | 14 | m | ischaemic | 8 (120, R, i) | 00:22 | 3 T MRI | L | 28 | 46 | 32 |
| 17 | 49 | 15 | f | ischaemic | 20 | 01:20 | 3 T MRI | R | 26 | 46 | 32 |
| 18 | 70 | 11 | m | ischaemic | 87 | 00:20 | 3 T MRI | R | 23 | 8 | 5 |
| 19 | 53 | 16 | f | ischaemic | 36 | 02:20 | 3 T MRI | R | 15 | 15 | 29 |
| 20 | 55 | 11 | m | ischaemic | 48 | 00:29 | 3 T MRI | R | 18 | 35 | 31 |
| 21 | 51 | 7 | f | ischaemic | 24 | 00:14 | 3 T MRI | R | 22 | 33 | 20 |
For patients who had more than one stroke, time since the first stroke is indicated in brackets, followed by the type of stroke (i = ischaemic; h = haemorrhagic, R = right hemisphere; L = left hemisphere).
In brackets: the score received on the Edinburgh Handedness Inventory for ambidextrous subjects; − 1 = strongly left handed, 1 = strongly right handed, 0 = completely ambidextrous.
2.2. Behavioural testing
Patients were tested on the Comprehensive Aphasia Test (Swinburn et al., 2004) and the Apraxia Battery for Adults (Dabul, 1979). They were also given a set of cognitive tests, including the Brixton Test of executive functions (Burgess and Shallice, 1997), the Raven Matrices (for measuring non-verbal IQ, Raven, 1938), the Rey–Osterreith Complex Figure Test (testing visual long-term memory, Meyers and Meyers, 1995) and parts of the Addenbrooke's Cognitive Examination-Revised (ACE-R), testing visual-spatial abilities (Mathuranath et al., 2000). The cognitive tests were administered in order to exclude patients who, due to cognitive or sensory impairments, could not perform the tasks reliably. Tests were administered in 2–3 sessions, depending on the patient's ability. Behavioural test sessions took place either at Addenbrooke's Hospital or at the patient's home, according to the patient's preference. The following tasks from the Comprehensive Aphasia Test were analysed: 1) Auditory sentence comprehension: participants were read a sentence and were asked to point to one of four pictures which best fitted the sentence. The task had 16 trials. 2) Word repetition: participants were asked to repeat words read out by the examiner. This task included 16 short words. 3) Object naming: participants were asked to name 24 pictures of objects. In all tasks, a correct answer was given 2 points. A delayed answer or a correct answer following self-correction was given 1 point. In the auditory sentence comprehension and the word repetition tasks, if the participant asked the examiner to repeat the question, and this was followed by a correct answer, 1 point was given as well. Maximum possible scores and the cut-off score for defining impaired function are presented in Fig. 1.
Fig. 1.

Behavioural scores for all patients in the various language tasks. Red lines represent the cut-off score for defining impaired function in each task.
2.3. Imaging data acquisition
Imaging was performed using a 3 T Siemens Magentom Trio Tim MRI scanner (Munich, Germany). Four patients could not undergo a 3 T MRI scan due to cardiac stents (n = 2) or PFO devices (n = 2) which were not 3 T compatible. These four patients were scanned using a 1.5 T MRI Siemens scanner (Erlangen, Germany) and the effect of using a different scanner on the results was considered (see below). The imaging protocol included Proton Density (PD) and T2-weighted scans (TR: 4.6 s, TE: 12 ms for PD, 104 ms for T2, FOV: 168 × 224 mm, matrix: 240 × 320, axial plane, slice thickness: 5 mm, 27 slices), a Magnetization-Prepared Rapid-Acquisition Gradient Echo (MPRAGE) scan (TR: 2.3 s, TE: 2.98 ms, FOV: 240 × 256 mm, sagittal plane, slice thickness: 1 mm, 176 slices) and a Fluid-Attenuated Inversion Recovery (FLAIR) scan (TR: 7.84 s, TE: 95 ms, FOV: 256 × 320 mm, axial plane; slice thickness: 4 mm; 27 slices).
2.4. Data pre-processing
2.4.1. Data pre-processing for VLSM
Lesions were defined using the Regions of Interest (ROI) facility in Analyze 7.5 software (Mayo Biomedical Imaging Resource, Mayo Clinic, MN). One author (SG) traced the lesions manually on patient's individual T2-weighted scans, in native space, while consulting the other coregistered sequences (FLAIR, PD and MPRAGE). Contours of the lesion were drawn on the outer borders of hyper-intense regions while observing similar changes of intensities in the other modalities. The lesions were identified on a slice by slice basis. Widened sulci were included in the lesion definition only in those cases where there was a clear asymmetry in sulci width between the lesioned and non-lesioned hemisphere. Periventricular regions were defined as lesioned only when there was a clear signal intensity change in the area and the cortical lesion extended all the way to the periventricular space. Areas surrounding enlarged ventricles with normal signal intensity, or periventricular white matter ischemic changes appearing on both hemispheres were not defined as lesioned. The drawn lesions were validated by a trained neurologist (EAW) who was blinded to the patients' diagnoses. A lesion overlap map is shown in Fig. 2. Binary masks were made from the lesions (Brett et al., 2001) using MRIcron (MRIcron 2009, Rorden et al., 2007).
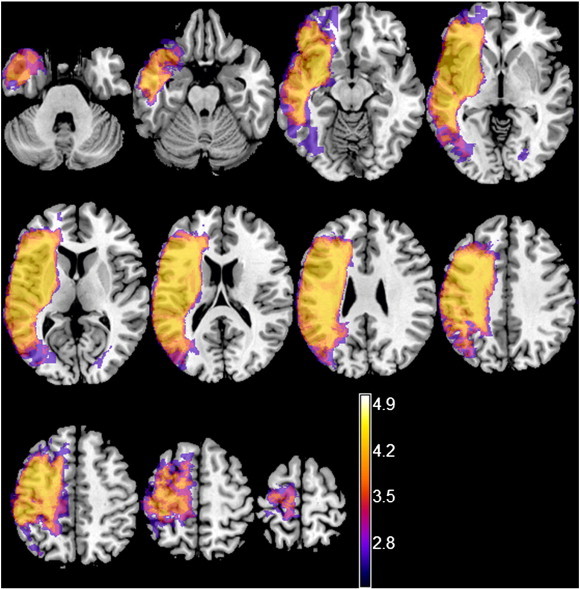
Fig. 2.
An overlay of all patients' lesions. Colours represent number of patients with a lesion to a specific voxel. Warmer areas indicate areas of greater lesion overlap. Colour range runs from 1 (the lowest value in the image) to 14 (the highest value in the image).
MPRAGE images were normalised and segmented into grey matter (GM), white matter (WM) and cerebro-spinal fluid (CSF) probability maps, in the standard Montreal Neurological Institute (MNI) stereotactic space, using the unified segmentation-normalisation algorithm (Ashburner and Friston, 2005) of the Statistical Parametric Mapping software (SPM8, Wellcome Department of Cognitive Neurology, UCL) implemented in the Matlab (2006b, The MathWorks Inc.) environment. Lesion masks were used to mask out abnormal tissue from the spatial normalisation routine and the spatial parameter files were then applied to the original drawn lesion which resulted in a spatially normalised binary lesion definition for each patient.
2.4.2. VBM
2.4.2.1. Creation of masks
To create a binary lesion map that is representative of the lesions in all patients, we added together all the lesions drawn manually for VLSM. This binary lesion map included all voxels which were defined as damaged in at least one patient, and excluded all voxels which were defined as intact in all patients.
The binary lesion map was used to modify the GM and WM templates used in VBM and provided in SPM8. These templates were thresholded at voxel intensity equals to, or higher than, 0.2, and combined with the binary lesion map. This resulted in two binary masks (GM and WM) that were limited to lesioned tissue, and represented the overlap between the GM or WM templates and the lesions-based binary map.
Using these GM and WM binary masks in the VBM analyses ensured that it inspected the same regions as those analysed in the VLSM analysis.
2.4.2.2. Data pre-processing for VBM
Images were normalised as described above, just without an explicit mask. Normalised modulated GM and WM images were visually inspected for quality of the segmentation-normalisation process, and smoothed with a Gaussian kernel of 12 mm full-width-at-half-maximum.
The statistical analysis was conducted after applying the binary GM or WM masks that only include the lesioned tissue identified in the VLSM procedure (see above). GM and WM maps were analysed separately as is typical in most VBM studies to date.
2.5. Data analysis
For statistical analysis, all voxels in which at least 5% of the patients had a lesion (i.e. 1/20) were included in the analysis. Each covariate of interest was examined by itself and a t-statistic was calculated and corrected for multiple comparisons.
For VLSM we used the non-parametric mapping (NPM) software package (Rorden et al., 2007) and correction for multiple comparisons was achieved by employing the non-parametric permutation test, as recommended for medium-sized samples (Kimberg et al., 2007; Medina et al., 2010). An effective coverage map can be found in the supplementary material (Fig. 1). The map defines the regions where it was or was not possible to detect effects at a given significance threshold of α = 0.05. The map was calculated based on the number of patients who have a lesion in each voxel and their distribution of behavioural scores (Rudrauf et al., 2008). Data were permuted 1000 times with each permutation resulting in a calculated cut-off t-value with α = 0.05. The distribution of those t-statistics was used to determine the cut-off score at p < 0.05.
Fig. 1.
Effective coverage map for the auditory comprehension task, for voxels in which at least 5% of patients had a lesion, thresholded at p < 0.05 (Z score = 2.11). Colours represent Z-scores.
For VLSM we used the non-parametric mapping (NPM) software package (Rorden et al., 2007) and correction for multiple comparisons was achieved by employing the non-parametric permutation test, as recommended for medium-sized samples (Kimberg et al., 2007; Medina et al., 2010). An effective coverage map can be found in the supplementary material (Fig. 1). The map defines the regions where it was or was not possible to detect effects at a given significance threshold of α = 0.05. The map was calculated based on the number of patients who have a lesion in each voxel and their distribution of behavioural scores (Rudrauf et al., 2008). Data were permuted 1000 times with each permutation resulting in a calculated cut-off t-value with α = 0.05. The distribution of those t-statistics was used to determine the cut-off score at p < 0.05.
For VBM analysis, GM or WM images were entered into a multiple regression model in SPM8, where voxel intensities were correlated with behavioural measurements. The covariates of interest were examined using t-tests and Family Wise Error (FWE) corrected threshold of p < 0.05.
To allow direct comparison between VBM and VLSM, we also applied a parametric test to both analysis techniques, therefore equating the statistical procedure used. Significant results are reported at p < 0.05 and the False Discovery Rate (FDR) correction for multiple comparisons.
To illustrate the overlaps and differences between the two methods, the statistical maps were thresholded at p < 0.05, FDR correction, and the images were binarised. We then looked for areas which were significant only in the VBM analysis, areas which were significant only in the VLSM analysis; and areas which were significant in both analyses. We further illustrate the differences between the methods by plotting the voxel intensity (in VBM) and voxel status (lesioned or not lesioned, according to the manual definition used for VLSM), against the behavioural performance, in three voxels: a VBM local maximum which was not significant in VLSM, a VLSM local maximum which was not significant in VBM, and a voxel which represented a local maximum in both methods.
2.5.1. Analysis of variations of parameters/covariates
2.5.1.1. Whole brain analysis
In order to explore whether an unmasked VBM analysis will reveal areas where performance significantly predict signal intensity outside the manually defined lesions, we analysed the data without the masks used above.
2.5.1.2. Effects of scanner type
To evaluate the influence of scanner type on the VBM analysis, all analyses were also run after adding scanner type as a covariate, or by excluding the 4 patients who were scanned on a 1.5 T scanner.
2.5.1.3. Effects of number of voxels analysed
To evaluate the influence of the voxels included we also run both the VBM and VLSM analyses only on voxels which were damaged in at least 20% of patients (i.e. 4/20). In the VBM analysis this was achieved by modifying the binary lesion map to include only voxels damaged in at least 20% of patients. This new binary lesion map was used to modify the GM and WM templates, as described above, resulting in two new binary masks (GM and WM).
3. Results
Behavioural results are presented in Fig. 1. There were technical problems with the scan of one patient (patient nu. 9, scanned at 1.5 T) and the data of this patient was excluded from all analyses. Results are reported for the remaining 20 patients. All areas listed in the lesion analyses below were in the left hemisphere, and coordinates are reported in MNI space. Results of the imaging analyses are presented in Fig. 3 and in the supplementary material.
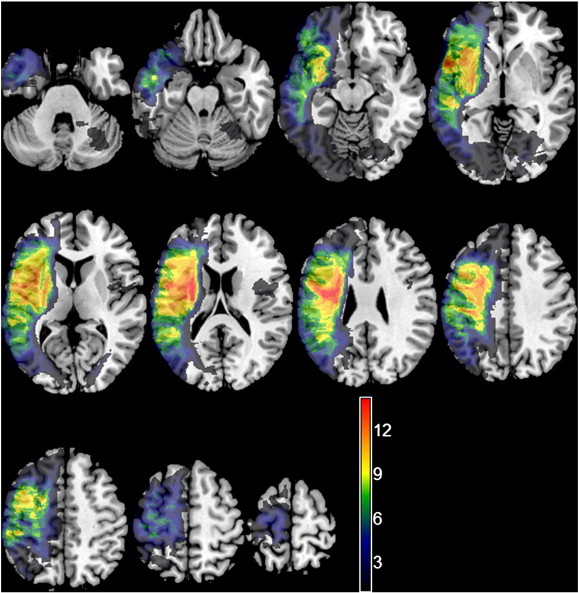
Fig. 3.

Colour maps of significant regions in the VBM (top); VLSM (middle); and both methods (bottom) in the auditory sentence comprehension task (p < 0.05, FDR correction). All voxels lesioned in at least 5% of patients are included. Colours represent Z-scores.
3.1. Comparison between VBM and VLSM
3.1.1. Auditory sentence comprehension
In both the VBM and VLSM, areas in the superior and middle temporal gyri (STG/MTG) were most significantly associated with auditory sentence comprehension. Specifically, in the VBM analysis, poorer performance significantly predicted lower GM voxel intensity on the border between the STG and MTG and lower WM voxel intensity in an area medial to the GM cluster (p < 0.05, FWE correction, Fig. 3, top panel). In the VLSM analysis, poor performance on the task was significantly associated with lesions in the MTG, extending slightly into the inferior region of the STG (Z score > 4.04, p < 0.05, permutation correction, Fig. 3, middle panel). Adding age as a covariate reduced the power of both types of analyses, without changing the pattern of results in either.
Looking at the differences between the methods, VBM found this cluster to extend more laterally and medially, therefore including the post-central gyrus and the supramarginal gyrus (SMG; p < 0.05, FDR correction; Fig. 3, top panel), while the cluster defined by VLSM extended more posteriorly, to include the post-central gyrus, superior parietal lobule and SMG; and superiorly, to include the pre-central gyrus, inferior frontal gyrus (IFG) and the insula (Z score > 2.12, p < 0.05, FDR correction; Fig. 3, middle panel).
We then plotted performance on the auditory sentence comprehension task against signal intensity, while distinguishing the voxel status (lesioned vs. not lesioned). Voxel [− 60, − 6, − 6] (anterior part of the MTG/BA 22) was a significant local maximum in both analyses (VLSM analysis Z score = 3.12; VBM analysis Z score = 4.26), as can be seen in Fig. 3. Fig. 4a demonstrates the linear correlation between signal intensity and performance (Pearson's r = 0.77, p < 0.001) and the significant difference between the ‘Lesion’ and ‘No Lesion’ groups (independent sample t-test, t = 3.65, p = 0.002) in this voxel.
Fig. 4.
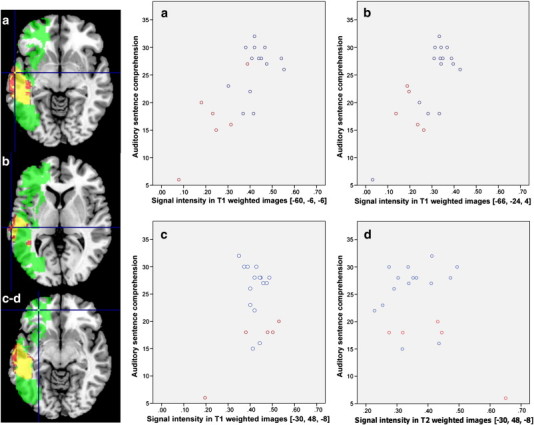
Performance on the auditory sentence comprehension task, plotted against signal intensity of T1/T2-weighted images of each participant, distinguishing the voxel status (not lesioned – in blue, vs. lesioned – in red). The location of the voxel is shown on the axial slices, where the binary thresholded maps from the VLSM analysis (green), VBM analysis (red) and both methods (yellow) are overlayed. All voxels are in the GM. (a) Behavioural performance plotted against signal intensity of T1-weighted images of each participant, at [− 60, − 6, − 6]. This voxel was significantly associated with behaviour in both the VLSM analysis (Z score = 3.12) and the VBM analysis (Z score = 4.26). (b) Behavioural performance plotted against signal intensity of T1-weighted images of each participant, at [− 66, − 24, 4]. Signal intensity in this voxel was significantly correlated with behaviour in the VBM analysis (Z score = 4.42), but not in the VLSM analysis. (c–d) Behavioural performance plotted against signal intensity of T1-weighted images (c) and T2-weighted images (d) of each participant, at [− 30, 48, − 8]. This voxel was significantly associated with behaviour in the VLSM analysis (Z score = 3.19), but not in the VBM analysis.
A voxel which was located posteriorly to it, at [− 66, − 24, 4] was found to be significantly associated with performance only in the VBM analysis (VBM Z score = 4.42). There was a significant linear correlation between signal intensity and performance in this voxel (Pearson's r = 0.77, p < 0.001), while no significant difference was found when comparing the ‘Lesion’ and ‘No Lesion’ groups (independent sample t-test, t = 1.94, p = 0.068) (Fig. 4b).
Lastly, voxel [− 30, 48, − 8] in the frontal lobe (mid orbitofrontal gyrus/BA 47), was found to be significantly associated with task performance only in the VLSM analysis (VLSM Z score = 3.19). Note that this voxel is in a large cluster which was found to be significant in the VLSM, but not in the VBM analysis. No linear correlation was found between T1- or T2-weighed images signal intensity and performance even at uncorrected threshold (p < 0.01). The ‘Lesion’ and ‘No Lesion’ groups differed significantly (independent sample t-test, t = 3.77, p = 0.001; Fig. 4c–d).
In order to verify that the differences found between VBM and VLSM were not specific to one task, we analysed two more tasks: word repetition and object naming. Below are descriptions of the results for these tasks.
3.1.2. Word repetition
In the word repetition task, the overlap between VBM and VLSM was limited to a small area within the SMG/BA 40 and STG/BA 42 (supplementary material, Fig. 2a, bottom panel).
Fig. 2.

Colour maps of significant regions in the VBM (top); VLSM (middle); and both methods (bottom) in the Word Repetition (a); and Object Naming (b) tasks (p < 0.05, FDR correction). All voxels lesioned in at least 5% of patients are included.
In the word repetition task, the overlap between VBM and VLSM was limited to a small area within the SMG/BA 40 and STG/BA 42 (supplementary material, Fig. 2a, bottom panel).
Looking at the differences between the two methods, it was found that VBM highlighted a large cluster including the insula and the IFG, as well as the pre-central gyrus and some subcortical regions. Specifically, poorer performance significantly predicted lower GM voxel intensity in the pre-central gyrus/IFG (p < 0.05, FWE correction), and when using FDR correction, this GM cluster extended anteriorly into the IFG and the insula, inferiorly into the STG, and posteriorly into the SMG. Significant correlation was also found in the putamen (p < 0.05, FDR correction; supplementary material, Fig. 2a, top panel). Lower voxel intensity in the white matter was predicted by poorer performance in a small cluster in the pre-central gyrus, only at uncorrected p < 0.001.
Looking at the differences between the two methods, it was found that VBM highlighted a large cluster including the insula and the IFG, as well as the pre-central gyrus and some subcortical regions. Specifically, poorer performance significantly predicted lower GM voxel intensity in the pre-central gyrus/IFG (p < 0.05, FWE correction), and when using FDR correction, this GM cluster extended anteriorly into the IFG and the insula, inferiorly into the STG, and posteriorly into the SMG. Significant correlation was also found in the putamen (p < 0.05, FDR correction; supplementary material, Fig. 2a, top panel). Lower voxel intensity in the white matter was predicted by poorer performance in a small cluster in the pre-central gyrus, only at uncorrected p < 0.001.
VLSM, but not VBM, identified a few small unconnected regions in the frontal and parietal lobes to be significantly associated with performance. Specifically, poorer performance was associated with lesions to the pre-central gyrus, as well as to the middle frontal gyrus (Z score > 4.78, p < 0.05, permutation correction). When looking at the results with FDR correction (Z score > 2.84) areas of significant association were also found in the pre-central gyrus and the IFG (pars opercularis and orbitalis) (p < 0.05, FDR correction; supplementary material, Fig. 2a, middle panel).
VLSM, but not VBM, identified a few small unconnected clusters in the frontal and parietal lobes to be significantly associated with performance. Specifically, poorer performance was associated with lesions to the pre-central gyrus, as well as to the middle frontal gyrus (Z score > 4.78, p < 0.05, permutation correction). When looking at the results with FDR correction (Z score > 2.84) areas of significant association were also found in the pre-central gyrus and the IFG (pars opercularis and orbitalis) (p < 0.05, FDR correction; supplementary material, Fig. 2a, middle panel).
3.1.3. Object naming
Comparing the two methods directly, it was found that poorer performance on the object naming task was significantly associated in both methods with the IFG (mainly pars orbitalis/BA 47) and the insula, extending posteriorly into the STG/BA 22 and SMG/BA 40. (Supplementary material, Fig. 2b, bottom panel).
Comparing the two methods directly, it was found that poorer performance on the object naming task was significantly associated in both methods with the IFG (mainly pars orbitalis/BA 47) and the insula, extending posteriorly into the STG/BA 22 and SMG/BA 40. (Supplementary material, Fig. 2b, bottom panel).
Specifically, in the VBM analysis poorer performance significantly predicted lower GM voxel intensity in a small area within the rolandic operculum (p < 0.05, FWE correction), and in a larger cluster which included the IFG and the insula, the SMG and the temporal pole (p < 0.05, FDR correction; supplementary material, Fig. 2b, top panel). In the WM analysis, poorer performance predicted lower voxel intensity in the white matter adjacent to the rolandic operculum, but only at uncorrected p < 0.001.
Specifically, in the VBM analysis poorer performance significantly predicted lower GM voxel intensity in a small area within the rolandic operculum (p < 0.05, FWE correction), and in a larger cluster which included the IFG and the insula, the SMG and the temporal pole (p < 0.05, FDR correction; supplementary material, Fig. 2b, top panel). In the WM analysis, poorer performance predicted lower voxel intensity in the white matter adjacent to the rolandic operculum, but only at uncorrected p < 0.001.
In the VLSM analysis, poor performance was significantly associated with lesions in small areas within the IFG (Z score > 4.61, p < 0.05, FWE correction). With FDR correction, poor performance was significantly associated with lesions to the IFG, the anterior insula, the SMG and the planum temporale, extending posteriorly into the STG and MTG (Z score > 2.36, p < 0.05, FDR correction; supplementary material, Fig. 2b, middle panel).
In the VLSM analysis, poor performance was significantly associated with lesions in small areas within the IFG (Z score > 4.61, p < 0.05, FWE correction). With FDR correction, poor performance was significantly associated with lesions to the IFG, the anterior insula, the SMG and the planum temporale, extending posteriorly into the STG and MTG (Z score > 2.36, p < 0.05, FDR correction; supplementary material, Fig. 2b, middle panel).
Looking at the differences between the techniques it was found that VBM, but not VLSM, found the IFG pars triangularis/BA 45 to be significantly associated with object naming as well. In addition, the VBM analysis highlighted subcortical regions (putamen, p < 0.05, FDR correction; supplementary material, Fig. 2b, top panel). VLSM, but not VBM, found that lesions to white matter regions were significantly associated with performance (Z score > 2.36, p < 0.05, FDR correction). Lastly, areas within the post-central gyrus were found to be significantly associated with behaviour in both methods, however, these areas did not fully overlap (p < 0.05, FDR correction; supplementary material, Fig. 2b, bottom panel).
Looking at the differences between the techniques it was found that VBM, but not VLSM, found the IFG pars triangularis/BA 45 to be significantly associated with object naming as well. In addition, the VBM analysis highlighted subcortical regions (putamen, p < 0.05, FDR correction; supplementary material, Fig. 2b, top panel). VLSM, but not VBM, found that lesions to white matter regions were significantly associated with performance (Z score > 2.36, p < 0.05, FDR correction; supplementary material, Fig.2b middle panel). Lastly, areas within the post-central gyrus were found to be significantly associated with behaviour in both methods, however, these areas did not fully overlap (p < 0.05, FDR correction; supplementary material, Fig. 2b, bottom panel).
3.2. Analysis of variations of parameters/covariates
3.2.1. Whole brain VBM analysis
3.2.1.1. Auditory sentence comprehension
No areas significantly correlated with performance at p < 0.05, FWE or FDR correction. At uncorrected threshold, poorer performance predicted lower GM intensity in a large cluster in the medial section of the superior frontal gyrus, bilaterally, and in a WM cluster in the pons and the midline of the cerebellar hemisphere and vermis (p < 0.001, uncorrected). These areas are outside the mask used in the above analysis. Correlation was also found in the left temporal lobe and the left SMG (p < 0.001, uncorrected), as in the masked analysis.
3.2.1.2. Word repetition
Poorer performance predicted lower GM intensity in the left pre-central gyrus (p < 0.05, FWE correction) and in the WM medial to it, but only at uncorrected threshold (p < 0.001, uncorrected). Using FDR correction, results of the GM unmasked analysis were similar to the ones described in the masked analysis. In summary, the unmasked analysis of the word repetition task did not find any regions outside the mask to be significantly associated with task performance.
3.2.1.3. Object naming
Poorer performance on the object naming task predicted lower GM intensity in the region described in the masked analysis, although in the unmasked analysis the cluster was smaller and did not extend medially as far as in the masked analysis (p < 0.05, FDR correction). WM intensity was predicted by behaviour in a region adjacent to the left superior temporal gyrus and in the pons, but only at p < 0.001, uncorrected.
In summary, the unmasked VBM analysis revealed areas that were significantly predicted by performance, outside the mask, but only when using uncorrected thresholds.
3.2.2. Effects of scanner type
Adding a covariate which describes the scanner type did not affect the results of any of the analyses. Running the VBM analyses only with patients scanned on the 3 T scanner (n = 17) resulted in similar results, only Z scores were lower. In particular, results described above were only significant at p < 0.001, uncorrected. This suggests that the type of scanner used did not have a biasing effect on the results.
3.2.3. Effects of number of voxels analysed
We compared the analyses of voxels damaged in 5% and 20% of patients. In VLSM, the two analyses did not differ in any brain regions when using permutation correction (Z score > 4.04, p < 0.05, permutation correction). That is, areas which were significant in one analysis were also significant in the second analysis. Looking at a lower threshold (Z score > 2.12, p < 0.05, FDR correction; supplementary material, Fig. 3), it was found that areas in the middle and superior frontal gyrus and inferior temporal lobe/inferior occipital lobe were significantly associated with behavioural performance only in the analysis of voxels damaged in at least 5% of patients. These areas were excluded from the analysis of voxels damaged in at least 20% of patients, since they were damaged only in a few patients, as can be seen in the lesion overlap map (purple areas, Fig. 2).
Fig. 3.

Colour maps of significant regions in the VBM (top); VLSM (middle); and both methods (bottom) in the Auditory Sentence Comprehension task (p < 0.05, FDR correction). All voxels lesioned in at least 20% of patients are included.
We compared the analyses of voxels damaged in 5% and 20% of patients. In VLSM, the two analyses did not differ in any brain regions when using permutation correction (Z score > 4.04, p < 0.05, permutation correction). That is, areas which were significant in one analysis were also significant in the second analysis. Looking at a lower threshold (Z score > 2.12, p < 0.05, FDR correction; supplementary material, Fig. 3), it was found that areas in the middle and superior frontal gyrus and inferior temporal lobe/inferior occipital lobe were significantly associated with behavioural performance on the auditory sentence comprehension task only in the analysis of voxels damaged in at least 5% of patients. These areas were excluded from the analysis of voxels damaged in at least 20% of patients, since they were damaged only in a few patients, as can be seen in the lesion overlap map (purple areas, Fig. 2).
In the VBM analysis, significant clusters were larger, when analysing only those voxels damaged in 20% of patients, compared to the analysis which included voxels damaged in at least 5% of patients (p < 0.05, FWE or FDR correction; supplementary material, Fig. 3).
In the VBM analysis, significant clusters were larger, when analysing only those voxels damaged in 20% of patients, compared to the analysis which included voxels damaged in at least 5% of patients (p < 0.05, FWE or FDR correction; supplementary material, Fig. 3).
There was no change for the local and global maxima of either analysis (supplementary material, Fig. 3). Importantly, significance levels of the three voxels analysed above did not change: voxel [− 60, − 6, − 6] remained a significant local maximum in both analyses (VLSM analysis Z score = 3.12; VBM analysis Z score = 4.25); voxel [− 66, − 24, 4], was only significantly associated with performance in the VBM analysis (VBM Z score = 4.41); and lastly, voxel [− 30, 48, − 8] was found to be significantly associated with task performance only in the VLSM analysis (VLSM Z score = 3.19).
There was no change for the local and global maxima of either analysis (supplementary material, Fig. 3). Importantly, significance levels of the three voxels analysed above did not change: voxel [− 60, − 6, − 6] remained a significant local maximum in both analyses (VLSM analysis Z score = 3.12; VBM analysis Z score = 4.25); voxel [− 66, − 24, 4] was only significantly associated with performance in the VBM analysis (VBM Z score = 4.41); and lastly, voxel [− 30, 48, − 8] was found to be significantly associated with task performance only in the VLSM analysis (VLSM Z score = 3.19).
4. Discussion
This study is the first to look at the differences and overlaps between the results obtained with two commonly used voxel-based lesion–behaviour mapping techniques: VLSM and VBM. The results obtained with the two methods largely, though not completely, overlapped. In the primary analysis, we ensured that the same areas were analysed in the two techniques, by applying a mask in the VBM analysis which included only areas marked as lesioned for the VLSM analysis. The VBM and VLSM analyses showed areas of overlap in all three tasks. These areas were previously shown to be relevant for the tasks used. Specifically, the MTG/STG was previously found to support auditory sentence comprehension (reviewed in Boatman, 2004; Hickok and Poeppel, 2007; Martin, 2003; Saur et al., 2009); word repetition was previously found to be supported by the SMG/BA 40 and STG/BA 42 (Anderson et al., 1999; Quigg et al., 2006; Saur et al., 2008); and object naming was previously found to be supported by the IFG and the insula (Price, 2000; Wise et al., 1999). This suggests that using both techniques and looking for overlaps between them can increase the reliability of the results obtained.
We then performed a whole brain VBM analysis (without a mask). This analysis found areas in which signal intensity was significantly predicted by behaviour although these areas were not part of the lesion. We report this to demonstrate that VBM can detect small changes in tissue composition which might not be visible to the naked eye, but can still potentially influence behavioural performance. However, this result should be treated with caution since it was obtained only when applying an uncorrected p-value. Consequently, these findings will not be discussed further.
Looking at the differences between the two techniques we have found some areas to be significantly associated with behaviour in one method but not the other. One of the reasons for this discrepancy might be that even when applying the mask derived from the manual lesion definition to the VBM analysis, different areas might be analysed in the two methods. This is because using a VLSM derived mask in a VBM analysis does not exclude the possibility that areas which were not defined as an infarct in the manual VLSM lesion definition, influenced the VBM analysis. This can happen, for example, in cases where some patients have degeneration in regions where other patients had a lesion. For example, the IFG was included in the lesion definition of some, but not all, patients. In the VLSM analysis only patients for whom the IFG was defined as lesioned, were classified as such. In the VBM analysis, on the other hand, the IFG was investigated for all patients, since it was included in our mask. A patient with a posterior lesion might demonstrate Wallerian degeneration in white matter regions adjacent to the IFG which will result in WM voxels receiving low values (signifying low intensity). As a result, these remote voxels may be classified as being intact in manual lesion tracing for VLSM analysis but their low signal intensity may contribute to the identification of lesion–symptom associations in the VBM analysis. Moreover, voxels which are on the edge of the lesion might not be included in the manual lesion definition due to the manual nature of the masking, but identified as having low intensity in VBM. An example can be found when looking at the relationship between signal intensity in voxel [− 66, − 24, 4] and the behavioural scores (described in the results). Here, performance on the auditory sentence comprehension task significantly predicted signal intensity in VBM, but was not significantly associated with lesion in VLSM. It is suggested that this voxel was not significant in the VLSM analysis due to the classification of this voxel as being intact in one patient who performed poorly (score = 5) on the task (see Fig. 4b). Hence, in this case VBM might have given a more reliable result.
Secondly, as mentioned in the introduction, enlarged ventricles can sometimes cause a distortion of the adjacent grey matter, although this is not part of the lesion itself. In such cases, the periventricular area might not be classified as lesioned in the manual tracing used for VLSM. In this study, periventricular regions were classified as lesioned only in the few cases where the lesion extended all the way to the periventricular area. As a result, these areas were not found to be significant in any of the VLSM analyses. To date, there are no clear guidelines for the manual delineation of lesions. We therefore recommend that researchers describe the manual lesion delineation strategies used in order to ease comparison between studies and stimulate debate. In addition, it should be noted that today there are semi-automated (Wilke et al., 2011) and automated (Schormann and Kraemer, 2003; Seghier et al., 2008; Stamatakis and Tyler, 2005) methods for lesion reconstruction (see Wilke et al., 2011 for a comparison between manual, semi-automated and automated lesion tracing techniques). In the VBM analyses, on the other hand, signal intensity in the putamen was found to be significantly predicted by behavioural scores in both the word repetition and the object naming tasks (see supplementary material). This suggests that the VBM analysis might be more sensitive to periventricular regions. On the other hand, periventricular regions are more likely to be subject to errors in the spatial normalisation routine in stroke patients with large lesions due to the extremely abnormal shape of the ventricles. Moreover, the striatum is not well segmented in VBM (Helms et al., 2009; Igual et al., 2011). Together, these make the VBM results in the periventricular regions potentially less reliable. It is therefore suggested that results obtained in periventricular regions be treated with caution.
A major difference between the techniques is that while VLSM uses binary data, VBM uses continuous data (notice that the recent version of VLSM (version 2.3, Bates et al., 2003; http://www.neuroling.arizona.edu/resources.html) allows analysing data using both VLSM or VBM). The use of continuous lesion measures could be more sensitive when the correlation with behaviour is linear. The effect of continuous versus binary measures cannot be simply tested by analysing binary images using VBM, because binary signal intensities are not normally distributed, therefore violating the assumptions of normality that are required for the parametric statistical analyses used in VBM, necessitating the use of non-parametric statistics as used in VLSM (Medina et al., 2010; Rorden et al., 2007). In our study, auditory sentence comprehension was associated with lesion occurrence in voxel [− 30, 48, − 8] in the VLSM analysis (Fig. 4c). At the same time, signal intensity in this voxel was not predicted by behavioural scores in the VBM analysis. This example highlights the limitation of VBM in cases where there is no linear relation between behaviour and tissue damage.
This example also relates to another issue in VLSM studies: VLSM studies typically include only voxels with a minimum number of patients in each group (with or without a lesion). Unfortunately, there is no agreement as to what the cut-off point should be, and studies differ on this figure, ranging from the inclusion of all voxels damaged in at least one patient (for example, Piras and Marangolo, 2007; Richter et al., 2007; Wilson and Saygin, 2004); voxels damaged in 10–15% of patients (for example, Borovsky et al., 2007; Dronkers et al., 2004); and voxels damaged in 20–25% of patients (for example, Baldo and Dronkers, 2007; Geva et al., 2011). Here, we compared different cut-off points: in the high threshold analysis, we included only those voxels damaged in at least 20% of patients, while in the low threshold analysis we included all voxels damaged in at least 5% of patients. We demonstrated that this change of threshold affected the two techniques in opposite directions. In the VLSM analysis, analysing a smaller area of the brain resulted in shrinkage of the significant clusters. Some of the areas found to be significant in the low threshold analysis were excluded from the high threshold analysis, and naturally, could not be significant. In the VBM analysis, on the other hand, analysing a smaller area of the brain resulted in the expansion of the significant clusters. This might be due to the fact that bringing the threshold up means analysing fewer voxels, therefore reducing the number of multiple comparisons, which in turn allows voxels with lower Z scores to become significant.
Another difference between VBM and VLSM is also related to the use of parametric versus non-parametric statistics. Parametric VBM requires smoothing of the image. Apart from the obvious issue of reducing spatial resolution, a problem which is not special to VBM, smoothing also shifts the local maximum slightly towards areas of low tissue variance, thus further distorting the map and making it difficult to give accurate localisation (Mechelli et al., 2005). In VLSM, smoothing is not an essential part of the images processing. In this study, the potential influence of the smoothing process is easily visible when looking at the statistical maps. For example, in the word repetition task, a small cluster in the IFG was found to be significant in the VLSM analysis. This cluster was not anatomically connected to other clusters. In the VBM analysis, a partially overlapping cluster was found in the IFG, but in this case, it connected to areas in the pre- and post-central gyri, among others. This might be a result of spatial smoothing, rather than a genuine result. Changing the smoothing level did not significantly alter the results (see supplementary material).
A related issue is the sensitivity of each technique to outliers. As can be seen in Fig. 4, all graphs contain an outlier. Testing the sensitivity to an outlier in VLSM is relatively simple, and can be done by excluding participants with outlier behaviour. In VBM, on the other hand, a participant might be defined as an outlier based on either behavioural scores, or signal intensity. An outlier behavioural score can easily be defined, but an outlier in signal intensity can potentially differ between voxels, making it more difficult to test the influence of the outlier in a whole-brain analysis.
Lastly, the VLSM analyses found lesions to white matter regions to be significantly associated with behaviour in all tasks, while in the VBM analyses, white matter voxel intensity was rarely found to be significantly predicted by behaviour. The differences between VBM and VLSM in this respect might be reduced by combining GM and WM lesion images into a single lesion image prior to the VBM analysis. An analysis technique specific to white matter (for example, one that uses Diffusion Tensor Imaging data) could shed further light on the relationship between white matter structural integrity and behavioural abilities.
A few general issues should be mentioned with regard to the differences between the two techniques. Firstly, traditional lesion–symptom mapping techniques are aimed at revealing those areas which are necessary for a specific cognitive function. By analysing areas outside the individual's patient lesion, VBM diverges from this original purpose, and might highlight also areas which simply contribute to the cognitive function in question.
Secondly, VBM analyses voxel intensity. In lesioned brains, the relation between voxel intensity and the fate of the tissue is not fully understood. For example, it has not been examined whether higher intensity means a larger number of functioning neurons, particularly within an infarct. Furthermore, lesion studies typically examine stroke patients in the chronic phase, when lesions usually appear to be dark on T1-weighted MRI scans. This can lead to WM or CSF being classified as GM. This might be dealt with by adding an additional tissue class (prior) into the segmentation-normalisation process as suggested by Seghier et al. (2008). This procedure identifies outlier voxels in lesioned brains and classifies them as ‘Lesion’ (not GM, WM or CSF). Nevertheless, even with normal healthy brains, it is unclear whether structural variation identified with VBM is related to changes in neuropil, neuronal size, dendritic arborisation, axonal arborisation or other morphological differences.
Thirdly, for manual lesion reconstruction for VLSM we used T2-weighted images while consulting all other images available. VBM, on the other hand, typically relies on information from high resolution T1-weighted images. Studies have demonstrated correlations between T2-weighted signal intensities and tissue damage (reviewed in Dijkhuizen and Nicolay, 2003) leading to the current use of T2-, and not T1-weighted images for clinical purposes, even though T2-weighted images are often acquired with lower resolution. For example, a study of ischaemic stroke in rats has found extremely high correlations between lesion volumes as measured manually on T2-weighted images, and lesion volumes calculated from post mortem histological brain slices. Moreover, T2-, but not T1-weighted images, had good lesion signal-to-noise ratio (Ashioti et al., 2007). Similar studies in humans are not available. Developing a computational algorithm which combines the information provided by sequences other than high resolution T1-weighted images (for example, see studies by Lu et al., 2005; Soltanian-Zadeh et al., 2003) may potentially enhance the validity of VBM studies of stroke.
4.1. Study caveats
Three patients were scanned on a 1.5 T scanner while the rest of the participants were scanned using a 3 T scanner. This can potentially introduce noise, or even systematic errors, into the data. The source of such noise can be, for example, the difference in the magnet field strength, noise of the electronics of the MRI which can vary between scanners, and differences in participants' positioning in the scanner (Stonnington et al., 2008). These effects will have a greater impact on VBM, which relies on signal intensity measures, than on VLSM that is based on the subjective identification of the lesion by eye which is likely to be similar on images produced with 1.5 T and 3 T MRI scanners. A comparison between scanners could not be achieved because of the small number of participants scanned on one of the scanners. Therefore, to obtain some estimation of the influence of this variable on the results, scanner type was added as a covariate to the general linear model. The results were then compared to the initial analyses, showing that scanner type did not influence the results. We then repeated our analyses while removing the three patients who were scanned on 1.5 T scanner from the analysis. This resulted in loss of power (less significant effects in all analyses), although the patterns of the results remained the same. Together, this suggests that combining images from the two different scanners did not bias our results. This conclusion is supported by a previous study showing that volumetric measurements did not differ between 1.5 T and 3 T scanners (Briellmann et al., 2001). Moreover, Stonnington et al. (2008) have shown that in a multi-centre study, the effect of disease (in this case, Alzheimer's Disease) was far greater than the effect of scanner, and they go further to suggest that pooling data from 1.5 T and 3 T scanners should be viable in VBM studies which use SPM5 and above.
Firstly, patients with multiple strokes were not excluded here, meaning that in some cases language assessment scores might have been affected by a previous stroke, especially if the stroke affected the language system. This inclusion criterion differs from many lesion–symptom mapping studies of aphasia which are available in the literature. However, the voxel-based analyses used here do not take into account how the effect of damage to one voxel depends on the effect of damage to other, remotely located, voxels. Rather, both VBM and VLSM look for the most significant correlations between behaviour and damage, irrespective of damage to other remote brain regions. Hence, the inclusion of patients with multiple strokes is not critical for the purpose of this study.
Secondly, not all participants were right-handed pre-morbidly. This differs from many other studies of aphasia in which right-handedness is an inclusion criterion. However, this is not critical for the purpose of this study, since the study did not focus on the anatomical underpinning of language function.
The population characteristics mentioned above (multiple lesions, handedness) add to the heterogeneity of the patient group. The large age range in our group of participants also contributes to the group heterogeneity, although notice that adding age as a covariate to the analysis did not change the pattern of results in either technique. Lastly, the sample size in this study was relatively small. Studies exploring cognitive and motor functions using VLSM or VBM should aim at studying more homogenous, though at the same time larger, patient groups.
5. Conclusions
We compared the use of VBM and VLSM in the study of language impairments in a cohort of chronic stroke patients. Areas where the two techniques gave overlapping results are those areas previously shown to be relevant for the cognitive functions tested. This suggests that using both techniques and looking for overlaps can potentially increase results reliability when seeking to map cognitive functions in the brain. However, the two techniques do not produce precisely the same results and potentially answer somewhat different questions. Since each method has some clear advantages over the other, we suggest that in future studies of chronic stroke patients, researchers consider the differences between the techniques when evaluating results and their implications.
The following are the supplementary data related to this article.
Supplementary materials.
Supplementary data to this article can be found online at http://dx.doi.org/10.1016/j.nicl.2012.08.003.
Acknowledgements
We thank Tulasi Marrapu for helping with the analysis, and to our three anonymous reviewers for their helpful comments. SG was supported by the Pinsent-Darwin Fellowship, Wingate scholarship, The Cambridge Overseas Trust and B'nai Brith Scholarship. PSJ was funded by the Cambridge Comprehensive Biomedical Research Centre. EAW received support from the Biomedical Centre Grant (BMC) to Cambridge from the UK National Institute of Health Research (NIHR). Imaging was funded by the MRC grant no. G0500874.
Footnotes
This is an open-access article distributed under the terms of the Creative Commons Attribution-NonCommercial-ShareAlike License, which permits non-commercial use, distribution, and reproduction in any medium, provided the original author and source are credited.
Contributor Information
Sharon Geva, Email: sharon.geva@cantab.net.
Jean-Claude Baron, Email: jcb54@cam.ac.uk.
P. Simon Jones, Email: spj24@cam.ac.uk.
Cathy J. Price, Email: c.j.price@ucl.ac.uk.
Elizabeth A. Warburton, Email: eaw23@medschl.cam.ac.uk.
References
- Anderson J.M., Gilmore R., Roper S., Crosson B., Bauer R.M., Nadeau S., Beversdorf D.Q., Cibula J., Rogish M., Kortencamp S., Hughes J.D., Rothi L.J.G., Heilman K.M. Conduction aphasia and the arcuate fasciculus: a reexamination of the Wernicke-Geschwind model. Brain and Language. 1999;70:1–12. doi: 10.1006/brln.1999.2135. [DOI] [PubMed] [Google Scholar]
- Ashburner J., Friston K.J. Voxel-based morphometry — the methods. NeuroImage. 2000;11:805–821. doi: 10.1006/nimg.2000.0582. [DOI] [PubMed] [Google Scholar]
- Ashburner J., Friston K.J. Unified segmentation. NeuroImage. 2005;26:839–851. doi: 10.1016/j.neuroimage.2005.02.018. [DOI] [PubMed] [Google Scholar]
- Ashioti M., Beech J.S., Lowe A.S., Hesselink M.B., Modo M., Williams S.C.R. Multi-modal characterisation of the neocortical clip model of focal cerebral ischaemia by MRI, behaviour and immunohistochemistry. Brain Research. 2007;1145:177–189. doi: 10.1016/j.brainres.2007.01.111. [DOI] [PubMed] [Google Scholar]
- Baldo J.V., Dronkers N.F. Neural correlates of arithmetic and language comprehension: a common substrate? Neuropsychologia. 2007;45:229–235. doi: 10.1016/j.neuropsychologia.2006.07.014. [DOI] [PubMed] [Google Scholar]
- Baldo J.V., Schwartz S., Wilkins D., Dronkers N.F. Role of frontal versus temporal cortex in verbal fluency as revealed by voxel-based lesion symptom mapping. Journal of the International Neuropsychological Society. 2006;12:896–900. doi: 10.1017/S1355617706061078. [DOI] [PubMed] [Google Scholar]
- Baron J.C., Chetelat G., Desgranges B., Perchey G., Landeau B., de la Sayette V., Eustache F. In vivo mapping of gray matter loss with voxel-based morphometry in mild Alzheimer's disease. NeuroImage. 2001;14:298–309. doi: 10.1006/nimg.2001.0848. [DOI] [PubMed] [Google Scholar]
- Bates E., Wilson S.M., Saygin A.P., Dick F., Sereno M.I., Knight R.T., Dronkers N.F. Voxel-based lesion–symptom mapping. Nature Neuroscience. 2003;6:448–450. doi: 10.1038/nn1050. [DOI] [PubMed] [Google Scholar]
- Boatman D. Cortical bases of speech perception: evidence from functional lesion studies. Cognition. 2004;92:47–65. doi: 10.1016/j.cognition.2003.09.010. [DOI] [PubMed] [Google Scholar]
- Borovsky A., Saygin A.P., Bates E., Dronkers N. Lesion correlates of conversational speech production deficits. Neuropsychologia. 2007;45:2525–2533. doi: 10.1016/j.neuropsychologia.2007.03.023. [DOI] [PMC free article] [PubMed] [Google Scholar]
- Brett M., Leff A.P., Rorden C., Ashburner J. Spatial normalization of brain images with focal lesions using cost function masking. NeuroImage. 2001;14:486–500. doi: 10.1006/nimg.2001.0845. [DOI] [PubMed] [Google Scholar]
- Briellmann R.S., Syngeniotis A., Jackson G.D. Comparison of hippocampal volumetry at 1.5 tesla and at 3 tesla. Epilepsia. 2001;42:1021–1024. doi: 10.1046/j.1528-1157.2001.0420081021.x. [DOI] [PubMed] [Google Scholar]
- Burgess P., Shallice T. Thames Valley Test Company; Bury St Edmunds, UK: 1997. The Hayling and Brixton Tests. Test manual. [Google Scholar]
- Dabul B.L. C.C. Publications, Inc.; USA: 1979. Apraxia Battery for Adults (ABA) [Google Scholar]
- Dick F., Saygin A.P., Galati G., Pitzalis S., Bentrovato S., D'Amico S., Wilson S., Bates E., Pizzamiglio L. What is involved and what is necessary for complex linguistic and nonlinguistic auditory processing: evidence from functional magnetic resonance imaging and lesion data. Journal of Cognitive Neuroscience. 2007;19:799–816. doi: 10.1162/jocn.2007.19.5.799. [DOI] [PubMed] [Google Scholar]
- Dijkhuizen R.M., Nicolay K. Magnetic resonance imaging in experimental models of brain disorders. Journal of Cerebral Blood Flow and Metabolism. 2003;23:1383–1402. doi: 10.1097/01.WCB.0000100341.78607.EB. [DOI] [PubMed] [Google Scholar]
- Dronkers N.F. A new brain region for coordinating speech articulation. Nature. 1996;384:159–161. doi: 10.1038/384159a0. [DOI] [PubMed] [Google Scholar]
- Dronkers N.F., Wilkins D.P., Van Valin R.D., Redfern B.B., Jaeger J.J. Lesion analysis of the brain areas involved in language comprehension. Cognition. 2004;92:145–177. doi: 10.1016/j.cognition.2003.11.002. [DOI] [PubMed] [Google Scholar]
- Friederici A.D. Towards a neural basis of auditory sentence processing. Trends in Cognitive Sciences. 2002;6:78–84. doi: 10.1016/s1364-6613(00)01839-8. [DOI] [PubMed] [Google Scholar]
- Gauthier L.V., Taub E., Perkins C., Ortmann M., Mark V.W., Uswatte G. Remodeling the brain — plastic structural brain changes produced by different motor therapies after stroke. Stroke. 2008;39:1520–1525. doi: 10.1161/STROKEAHA.107.502229. [DOI] [PMC free article] [PubMed] [Google Scholar]
- Geva S., Jones P.S., Crinion J.T., Price C.J., Baron J.C., Warburton E.A. The neural correlates of inner speech defined by voxel-based lesion–symptom mapping. Brain. 2011;134:3071–3082. doi: 10.1093/brain/awr232. [DOI] [PMC free article] [PubMed] [Google Scholar]
- Gitelman D.R., Ashburner J., Friston K.J., Tyler L.K., Price C.J. Voxel-based morphometry of herpes simplex encephalitis. NeuroImage. 2001;13:623–631. doi: 10.1006/nimg.2000.0734. [DOI] [PubMed] [Google Scholar]
- Grandjean D., Sander D., Lucas N., Scherer K.R., Vuilleumier P. Effects of emotional prosody on auditory extinction for voices in patients with spatial neglect. Neuropsychologia. 2008;46:487–496. doi: 10.1016/j.neuropsychologia.2007.08.025. [DOI] [PubMed] [Google Scholar]
- Grau-Olivares M., Bartres-Faz D., Arboix A., Soliva J.C., Rovira M., Targa C., Junque C. Mild cognitive impairment after lacunar infarction: voxel-based morphometry and neuropsychological assessment. Cerebrovascular Diseases. 2007;23:353–361. doi: 10.1159/000099134. [DOI] [PubMed] [Google Scholar]
- Helms G., Draganski B., Frackowiak R., Ashburner J., Weiskopf N. Improved segmentation of deep brain grey matter structures using magnetization transfer (MT) parameter maps. NeuroImage. 2009;47:194–198. doi: 10.1016/j.neuroimage.2009.03.053. [DOI] [PMC free article] [PubMed] [Google Scholar]
- Hickok G., Poeppel D. Opinion — the cortical organization of speech processing. Nature Reviews Neuroscience. 2007;8:393–402. doi: 10.1038/nrn2113. [DOI] [PubMed] [Google Scholar]
- Igual L., Soliva J.C., Hernandez-Vela A., Escalera S., Jimenez X., Vilarroya O., Radeva P. A fully-automatic caudate nucleus segmentation of brain MRI: application in volumetric analysis of pediatric attention-deficit/hyperactivity disorder. Biomedical Engineering Online. 2011;10 doi: 10.1186/1475-925X-10-105. [DOI] [PMC free article] [PubMed] [Google Scholar]
- Karas G.B., Burton E.J., Rombouts S.A., van Schijndel R.A., O'Brien J.T., Scheltens P., McKeith I.G., Williams D., Ballard C., Barkhof F. A comprehensive study of gray matter loss in patients with Alzheimer's disease using optimized voxel-based morphometry. NeuroImage. 2003;18:895–907. doi: 10.1016/s1053-8119(03)00041-7. [DOI] [PubMed] [Google Scholar]
- Kassubek J., Juengling F.D., Hellwig B., Spreer J., Lucking C.H. Thalamic gray matter changes in unilateral Parkinsonian resting tremor: a voxel-based morphometric analysis of 3-dimensional magnetic resonance imaging. Neuroscience Letters. 2002;323:29–32. doi: 10.1016/s0304-3940(02)00111-8. [DOI] [PubMed] [Google Scholar]
- Kimberg D.Y., Coslett H.B., Schwartz M.F. Power in voxel-based lesion–symptom mapping. Journal of Cognitive Neuroscience. 2007;19:1067–1080. doi: 10.1162/jocn.2007.19.7.1067. [DOI] [PubMed] [Google Scholar]
- Leff A.P., Schofield T.M., Crinion J.T., Seghier M.L., Grogan A., Green D.W., Price C.J. The left superior temporal gyrus is a shared substrate for auditory short-term memory and speech comprehension: evidence from 210 patients with stroke. Brain. 2009;132:3401–3410. doi: 10.1093/brain/awp273. [DOI] [PMC free article] [PubMed] [Google Scholar]
- Lu M., Mitsias P.D., Ewing J.R., Soltanian-Zadeh H., Bagher-Ebadian H., Zhao Q.M., Oja-Tebbe N., Patel S.C., Chopp M. Predicting final infarct size using acute and subacute multiparametric MRI measurements in patients with ischemic stroke. Journal of Magnetic Resonance Imaging. 2005;21:495–502. doi: 10.1002/jmri.20313. [DOI] [PubMed] [Google Scholar]
- Martin R.C. Language processing: functional organization and neuroanatomical basis. Annual Review of Psychology. 2003;54:55–89. doi: 10.1146/annurev.psych.54.101601.145201. [DOI] [PubMed] [Google Scholar]
- Mathuranath P.S., Nestor P.J., Berrios G.E., Rakowicz W., Hodges J.R. A brief cognitive test battery to differentiate Alzheimer's disease and frontotemporal dementia. Neurology. 2000;55:1613–1620. doi: 10.1212/01.wnl.0000434309.85312.19. [DOI] [PubMed] [Google Scholar]
- Mechelli A., Price C.J., Friston K.J., Ashburner J. Voxel-based morphometry of the human brain: methods and applications. Current Medical Imaging Reviews. 2005;1:105–113. [Google Scholar]
- Medina J., Kimberg D.Y., Chatterjee A., Coslett H.B. Inappropriate usage of the Brunner–Munzel test in recent voxel-based lesion–symptom mapping studies. Neuropsychologia. 2010;48:341–343. doi: 10.1016/j.neuropsychologia.2009.09.016. [DOI] [PMC free article] [PubMed] [Google Scholar]
- Meyers J.E., Meyers K.R. Psychological Assessment Resource, Inc.; Odessa, Florida, USA: 1995. Rey Complex Figure Test and Recognition Trial. [Google Scholar]
- Molenberghs P., Gillebert C.R., Peeters R., Vandenberghe R. Convergence between lesion–symptom mapping and functional magnetic resonance imaging of spatially selective attention in the intact brain. Journal of Neuroscience. 2008;28:3359–3373. doi: 10.1523/JNEUROSCI.5247-07.2008. [DOI] [PMC free article] [PubMed] [Google Scholar]
- Mummery C.J., Patterson K., Price C.J., Ashburner J., Frackowiak R.S., Hodges J.R. A voxel-based morphometry study of semantic dementia: relationship between temporal lobe atrophy and semantic memory. Annals of Neurology. 2000;47:36–45. [PubMed] [Google Scholar]
- Piras F., Marangolo P. Noun-verb naming in aphasia: a voxel-based lesion–symptom mapping study. Neuroreport. 2007;18:1455–1458. doi: 10.1097/WNR.0b013e3282ef6fc9. [DOI] [PubMed] [Google Scholar]
- Ploner C.J., Gaymard B.M., Rivaud-Pechoux S., Pierrot-Deseilligny C. The prefrontal substrate of reflexive saccade inhibition in humans. Biological Psychiatry. 2005;57:1159–1165. doi: 10.1016/j.biopsych.2005.02.017. [DOI] [PubMed] [Google Scholar]
- Price C.J. The anatomy of language: contributions from functional neuroimaging. Journal of Anatomy. 2000;197:335–359. doi: 10.1046/j.1469-7580.2000.19730335.x. [DOI] [PMC free article] [PubMed] [Google Scholar]
- Price C.J. The Anatomy of Language: A review of 100 fMRI Studies Published in 2009. Annals of the New York Academy of Sciences. 2010;1191:62–88. doi: 10.1111/j.1749-6632.2010.05444.x. [DOI] [PubMed] [Google Scholar]
- Price C.J., Devlin J.T., Moore C.J., Morton C., Laird A.R. Meta-analyses of object naming: effect of baseline. Human Brain Mapping. 2005;25:70–82. doi: 10.1002/hbm.20132. [DOI] [PMC free article] [PubMed] [Google Scholar]
- Price C.J., Crinion J.T., Leff A.P., Richardson F.M., Schofield T.M., Prejawa S., Ramsden S., Gazarian K., Lawrence M., Ambridge L., Andric M., Small S.L., Seghier M.L. Lesion sites that predict the ability to gesture how an object is used. Archives Italiennes de Biologie. 2010;148:243–258. [PubMed] [Google Scholar]
- Quigg M., Geldmacher D.S., Elias W.J. Conduction aphasia as a function of the dominant posterior perisylvian cortex — report of two cases. Journal of Neurosurgery. 2006;104:845–848. doi: 10.3171/jns.2006.104.5.845. [DOI] [PubMed] [Google Scholar]
- Rapcsak S.Z., Beeson P.M., Henry M.L., Leyden A., Kim E., Rising K., Andersen S., Cho H. Phonological dyslexia and dysgraphia: cognitive mechanisms and neural substrates. Cortex. 2009;45:575–591. doi: 10.1016/j.cortex.2008.04.006. [DOI] [PMC free article] [PubMed] [Google Scholar]
- Raven J.C. Harcourt Assessment; 1938. Raven's Progressive Matrices. [Google Scholar]
- Richardson F.M., Price C.J. Structural MRI studies of language function in the undamaged brain. Brain Structure & Function. 2009;213:511–523. doi: 10.1007/s00429-009-0211-y. [DOI] [PMC free article] [PubMed] [Google Scholar]
- Richter S., Gerwig M., Aslan B., Wilhelm H., Schoch B., Dimitrova A., Gizewski E.R., Ziegler W., Karnath H.O., Timmann D. Cognitive functions in patients with MR-defined chronic focal cerebellar lesions. Journal of Neurology. 2007;254:1193–1203. doi: 10.1007/s00415-006-0500-9. [DOI] [PubMed] [Google Scholar]
- Rorden C., Karnath H.O., Bonilha L. Improving lesion–symptom mapping. Journal of Cognitive Neuroscience. 2007;19(7):1081–1088. doi: 10.1162/jocn.2007.19.7.1081. [DOI] [PubMed] [Google Scholar]
- Rosen H.J., Gorno-Tempini M.L., Goldman W.P., Perry R.J., Schuff N., Weiner M., Feiwell R., Kramer J.H., Miller B.L. Patterns of brain atrophy in frontotemporal dementia and semantic dementia. Neurology. 2002;58:198–208. doi: 10.1212/wnl.58.2.198. [DOI] [PubMed] [Google Scholar]
- Rowan A., Vargha-Khadem F., Calamante F., Tournier J.D., Kirkham F.J., Chong W.K., Baldeweg T., Connelly A., Gadian D.G. Cortical abnormalities and language function in young patients with basal ganglia stroke. NeuroImage. 2007;36:431–440. doi: 10.1016/j.neuroimage.2007.02.051. [DOI] [PubMed] [Google Scholar]
- Rudrauf D., Mehta S., Bruss J., Tranel D., Damasio H., Grabowski T.J. Thresholding lesion overlap difference maps: application to category-related naming and recognition deficits. NeuroImage. 2008;41:970–984. doi: 10.1016/j.neuroimage.2007.12.033. [DOI] [PMC free article] [PubMed] [Google Scholar]
- Saur D., Kreher B.W., Schnell S., Kummerer D., Kellmeyer P., Vry M.S., Umarova R., Musso M., Glauche V., Abel S., Huber W., Rijntjes M., Hennig J., Weiller C. Ventral and dorsal pathways for language. Proceedings of the National Academy of Sciences of the United States of America. 2008;105:18035–18040. doi: 10.1073/pnas.0805234105. [DOI] [PMC free article] [PubMed] [Google Scholar]
- Saur D., Schelter B., Schnell S., Kratochvil D., Küpper H., Kellmeyer P., Kümmerer D., Klöppel S., Glauche V., Lange R., Mader W., Feess D., Timmer J., Weiller C. Combining functional and anatomical connectivity reveals brain networks for auditory language comprehension. NeuroImage. 2009;49:3187–3197. doi: 10.1016/j.neuroimage.2009.11.009. [DOI] [PubMed] [Google Scholar]
- Saygin A.P. Superior temporal and premotor brain areas necessary for biological motion perception. Brain. 2007;130:2452–2461. doi: 10.1093/brain/awm162. [DOI] [PubMed] [Google Scholar]
- Saygin A.P., Wilson S.M., Dronkers N.F., Bates E. Action comprehension in aphasia: linguistic and non-linguistic deficits and their lesion correlates. Neuropsychologia. 2004;42:1788–1804. doi: 10.1016/j.neuropsychologia.2004.04.016. [DOI] [PubMed] [Google Scholar]
- Schoch B., Dimitrova A., Gizewski E.R., Timmann D. Functional localization in the human cerebellum based on voxelwise statistical analysis: a study of 90 patients. NeuroImage. 2006;30:36–51. doi: 10.1016/j.neuroimage.2005.09.018. [DOI] [PubMed] [Google Scholar]
- Schormann T., Kraemer M. Voxel-guided morphometry (“VGM”) and application to stroke. IEEE Transactions on Medical Imaging. 2003;22:62–74. doi: 10.1109/TMI.2002.806571. [DOI] [PubMed] [Google Scholar]
- Seghier M.L., Ramlackhansingh A., Crinion J., Leff A., Price C.J. Lesion identification using unified segmentation–normalisation models and fuzzy clustering. NeuroImage. 2008;41:1253–1266. doi: 10.1016/j.neuroimage.2008.03.028. [DOI] [PMC free article] [PubMed] [Google Scholar]
- Soltanian-Zadeh H., Pasnoor M., Hammoud R., Jacobs M.A., Patel S.C., Mitsias P.D., Knight R.A., Zheng Z.G., Lu M., Chopp M. MRI tissue characterization of experimental cerebral ischemia in rat. Journal of Magnetic Resonance Imaging. 2003;17:398–409. doi: 10.1002/jmri.10256. [DOI] [PubMed] [Google Scholar]
- Stamatakis E.A., Tyler L.K. Identifying lesions on structural brain images — validation of the method and application to neuropsychological patients. Brain and Language. 2005;94:167–177. doi: 10.1016/j.bandl.2004.12.010. [DOI] [PubMed] [Google Scholar]
- Stebbins G.T., Nyenhuis D.L., Wang C., Cox J.L., Freels S., Bangen K., DeToledo-Morrell L., Sripathirathan K., Moseley M., Turner D.A., Gabrieli J.D.E., Gorelick P.B. Gray matter atrophy in patients with ischemic stroke with cognitive impairment. Stroke. 2008;39:785–793. doi: 10.1161/STROKEAHA.107.507392. [DOI] [PubMed] [Google Scholar]
- Stonnington C.M., Tan G., Kloeppel S., Chu C., Draganski B., Jack C.R., Chen K., Ashburner J., Frackowiak R.S.J. Interpreting scan data acquired from multiple scanners: a study with Alzheimer's disease. NeuroImage. 2008;39:1180–1185. doi: 10.1016/j.neuroimage.2007.09.066. [DOI] [PMC free article] [PubMed] [Google Scholar]
- Swinburn K., Porter G., Howard D. Psychology Press; East Sussex, UK: 2004. Comprehensive Aphasia Test. [Google Scholar]
- Wilke M., de Haan B., Juenger H., Karnath H.O. Manual, semi-automated, and automated delineation of chronic brain lesions: a comparison of methods. NeuroImage. 2011;56:2038–2046. doi: 10.1016/j.neuroimage.2011.04.014. [DOI] [PubMed] [Google Scholar]
- Wilson S.M., Saygin A.P. Grammaticality judgment in aphasia: deficits are not specific to syntactic structures, aphasic syndromes, or lesion sites. Journal of Cognitive Neuroscience. 2004;16:238–252. doi: 10.1162/089892904322984535. [DOI] [PubMed] [Google Scholar]
- Wise R.J.S., Greene J., Buchel C., Scott S.K. Brain regions involved in articulation. Lancet. 1999;353:1057–1061. doi: 10.1016/s0140-6736(98)07491-1. [DOI] [PubMed] [Google Scholar]
Associated Data
This section collects any data citations, data availability statements, or supplementary materials included in this article.
Supplementary Materials
Supplementary materials.