

Abstract
Cerebral magnetic resonance elastography (MRE) measures the viscoelastic properties of brain tissues in vivo. It was recently shown that brain viscoelasticity is reduced in patients with multiple sclerosis (MS), highlighting the potential of cerebral MRE to detect tissue pathology during neuroinflammation. To further investigate the relationship between inflammation and brain viscoelasticity, we applied MRE to a mouse model of MS, experimental autoimmune encephalomyelitis (EAE). EAE was induced and monitored by MRE in a 7-tesla animal MRI scanner over 4 weeks. At the peak of the disease (day 14 after immunization), we detected a significant decrease in both the storage modulus (G′) and the loss modulus (G″), indicating that both the elasticity and the viscosity of the brain are reduced during acute inflammation. Interestingly, these parameters normalized at a later time point (day 28) corresponding to the clinical recovery phase. Consistent with this, we observed a clear correlation between viscoelastic tissue alteration and the magnitude of perivascular T cell infiltration at both day 14 and day 28. Hence, acute neuroinflammation is associated with reduced mechanical cohesion of brain tissues. Moreover, the reduction of brain viscoelasticity appears to be a reversible process, which is restored when inflammation resolves. For the first time, our study has demonstrated the applicability of cerebral MRE in EAE, and showed that this novel imaging technology is highly sensitive to early tissue alterations resulting from the inflammatory processes. Thus, MRE may serve to monitor early stages of perivascular immune infiltration during neuroinflammation.
Keywords: Magnetic resonance elastography, Experimental autoimmune encephalomyelitis, Neuroinflammation
1. Introduction
In multiple sclerosis (MS), diffuse brain parenchymal damage appears to be present from the very onset of the disease and may represent a major cause of clinical symptoms. Magnetic resonance imaging (MRI) is limited in identifying diffuse patterns of brain pathology in MS (Miller et al., 2003), and conventional MRI relies on the quantification and characterization of lesions, which are often poorly correlated with clinical disease manifestations (Barkhof, 2002). Consequently, there is a need to develop alternative MRI approaches, and to further improve the diagnostic specificity and predictive value of MRI in MS.
Magnetic resonance elastography (MRE) represents one of the emerging alternative approaches to MRI (Muthupillai et al., 1995). MRE is capable of measuring the effective viscoelastic constants of the living brain (Green et al., 2008; Klatt et al., 2007; Kruse et al., 2008). This yields information on the physico-mechanical properties of the tissue, i.e. its relative “softness” or “rigidness”. In the brain, the viscoelastic constants are dictated by the mechanical properties and interactions of neurons, glial cells (Lu et al., 2006) and the vascular tree. Interstitial fluid pressure, as well as vascular- and CSF-pressures, influences the mechanical properties of brain tissues (Tully and Ventikos, 2011). Thus, the elastographic properties of brain tissues are sensitive to disruptions of the complex interactions between brain constituents that occur during neuropathophysiological processes.
Recently, we and others have reported that the tissue integrity of the human brain is reduced in the course of physiological aging (Sack et al., 2011), and as a consequence of diseases such as hydrocephalus (Streitberger et al., 2011) and Alzheimer's disease (Murphy et al., 2011). Importantly, we recently showed that this is also the case in MS (Streitberger et al., 2012; Wuerfel et al., 2010). Nevertheless, the histopathologic alterations that may account for this reported loss in brain elasticity are still undefined. It may be that a common process of mechanical degradation underlies several neurological disorders, or that similar viscoelastic alterations in the brain are the result of distinct disorder-specific pathophysiological mechanisms. To unravel this question, it is necessary to extend MRE investigations to animal disease models (Atay et al., 2008; Clayton et al., 2011; Pattison et al., 2010).
Mouse MRE is similar to MRE in humans, despite a smaller field of view. Harmonic vibrations from an external source are applied to the animal in the scanner, and shear waves are induced in the tissue. These waves are detected by motion-sensitive MRI sequences, and the data processed to yield the shear modulus, G* (Mariappan et al., 2010). The shear modulus is a complex number: the real part, G′, is referred to as the storage modulus, and the imaginary part, G″ is called the loss modulus. The storage modulus G′ reflects the elasticity of the tissue, and is related to the inherent mechanical rigidity of the tissue matrix. The loss modulus G″ reflects the viscosity of the tissue, related to both the mechanical rigidity and the tissue architecture. The ratio of G″/G′ reflects the complexity of the tissue architecture — this can be understood as the density and topological arrangement of structural interactions between cellular and non-cellular components of biological tissues, which collectively gives rise to the mechanical properties of a given tissue.
Histopathophysiological processes disrupt these intricate structural interactions resulting in a transient (acute) or sustained (chronic) alteration of the mechanical properties of tissues. These alterations can be detected by changes in the elastographic parameters using MRE. A reduction in the values of G′ and G″, while maintaining a constant ratio of these parameters, is interpreted as a “weakening” or “softening” of the mechanical rigidity of tissue, depicted schematically in Fig. 1A. An alteration of the ratio of G′ and G″ is interpreted as a change in the complexity of the tissue architecture, which could be indicative of a more severe degradation of the tissue structure (Fig. 1A). This interpretation implies that G″/G′ is constant with excitation frequency — a condition which is fulfilled if the tissue's viscoelastic response can be described by a powerlaw |G * | ~ ωα with ω being the angular drive frequency and α ∼ arctan(G ″/G ′). Such a powerlaw model has been applied in multiple studies of MRE of muscle (Klatt et al., 2010), liver (Asbach et al., 2010) and brain (Sack et al., 2009) and has recently been analyzed in terms of structural parameters such as network density and network fractal dimensions (Guo et al., 2012; Posnansky et al., 2012).
Fig. 1.
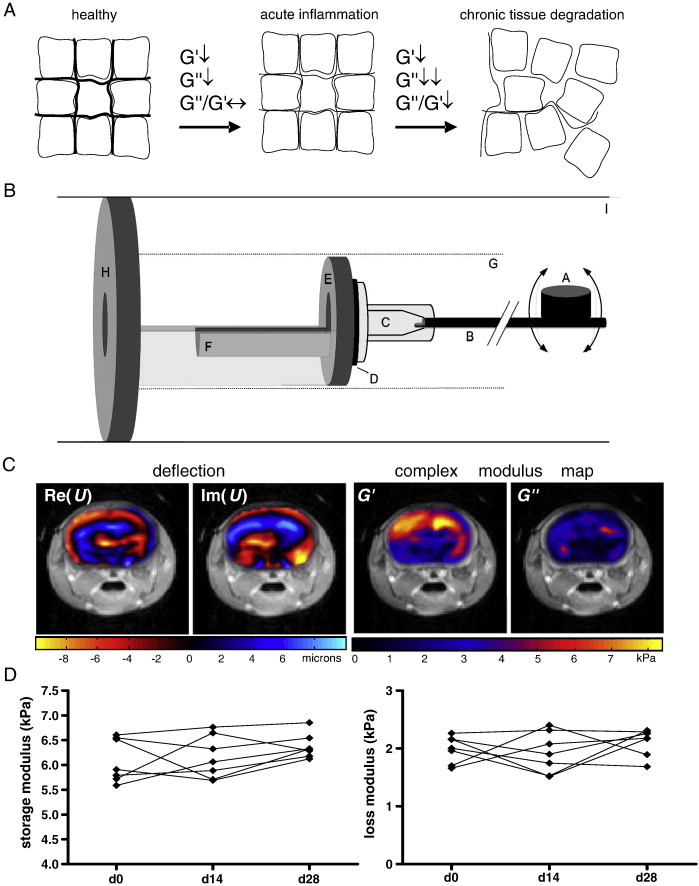
Hypothesis, experimental setup and baseline measurements for studying EAE with MRE in the mouse. A. Conceptual diagram illustrating the interpretation of the elastography parameters. A reduction in the storage (G′), and loss (G″) moduli, while maintaining a constant ratio of these terms, is indicative of reduced mechanical rigidity of the tissue, which can be associated with acute pathological processes leading to tissue alteration. A change in the ratio G″/G′ reflects alteration of the structural complexity of the tissue architecture, which can be associated with severe tissue degradation in pathological states. B. A schematic of the mouse MRE apparatus: (A) driving coil; (B) carbon fiber piston; (C) respiratory mask; (D) rubber bearing; (E) retaining bracket; (F) mouse bed; (G) magnet bore; (H) plastic disk; (I) Lorentz coil. C. Representative wave (deflection) images and complex modulus maps, superimposed on T2-weighted anatomical scans of the mouse head. D. Plots of the storage and loss moduli of healthy mice show no significant changes over 28 days.
Our recent findings (Streitberger et al., 2012; Wuerfel et al., 2010) indicate that G′, G″ and the ratio G″/G″ can provide information about histological alterations of the brain associated with MS. Based on this, we hypothesize that alterations in these parameters may occur also in the animal model when neuroinflammation is present.
Therefore, we applied MRE to study possible neuroinflammation-associated alterations of mechanical properties of mouse brain tissue, and to determine the viscoelastic changes over the course of experimental autoimmune encephalomyelitis (EAE), the animal model of MS. The flexibility of the animal model affords the possibility to examine how histopathological features relate to MRE measurements, and to expand the utility of MRE as a tool to monitor cellular and molecular changes in the pathology of MS.
2. Material and methods
2.1. Animals
All procedures were performed in accordance with protocols approved by the local animal welfare committee in accordance to national and international guidelines to minimize discomfort to animals (86/609/EEC). SJL mice were purchased from Charles River Laboratories, (Sulzfeld, Germany) and were housed under standard conditions.
2.2. Experimental autoimmune encephalomyelitis
SJL mice were immunized subcutaneously with 250 mg of proteolipid protein (PLP) peptide 139–151 (purity 95%; Pepceuticals, Leicester, UK) emulsified in an equal volume of PBS and complete Freund's adjuvant containing 6 mg/ml Mycobacterium tuberculosis H37Ra (Difco, Franklin Lakes, NJ). Pertussis toxin (200 ng per mouse; List) was injected intraperitoneally on the day of immunization (day 0) and again 2 days later. After immunization, mice were monitored daily for clinical signs and scored as follows: 0, no disease; 1, tail paralysis; 2, paraparesis; 3, paraplegia; 4, paraplegia with forelimb weakness or paralysis; and 5, moribund or dead animals. The experimental design is illustrated in the Appendix (Fig. S1).
Fig. S1.
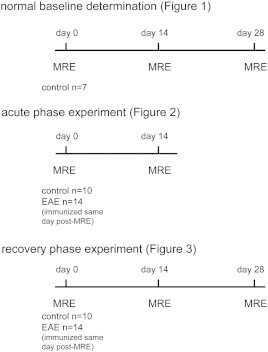
Schematic of MRE experimental design.
SJL mice were immunized subcutaneously with 250 mg of proteolipid protein (PLP) peptide 139–151 (purity 95%; Pepceuticals, Leicester, UK) emulsified in an equal volume of PBS and complete Freund's adjuvant containing 6 mg/ml Mycobacterium tuberculosis H37Ra (Difco, Franklin Lakes, NJ). Pertussis toxin (200 ng per mouse; List) was injected intraperitoneally on the day of immunization (day 0) and again 2 days later. After immunization, mice were monitored daily for clinical signs and scored as follows: 0, no disease; 1, tail paralysis; 2, paraparesis; 3, paraplegia; 4, paraplegia with forelimb weakness or paralysis; and 5, moribund or dead animals. The experimental design is illustrated in the Appendix (Fig. S1).
2.3. Magnetic resonance elastography: data acquisition and processing
2.3.1. Mechanical stimulation
A schematic of the experimental setup is shown in Fig. 1B. The vibration source was an electromagnetic coil (A) attached to a carbon fiber piston (B), the end of which was mounted to the respiratory mask with bite-bar transducer (C). The transducer was gimballed through a rubber bearing (D) and retaining bracket (E) at the tempered mouse bed (F). The entire setup was held in the center of the magnet bore (G) by a plastic disk (H). Vibrations were produced by applying a sinusoidal current of 900 Hz frequency to an air-cooled Lorentz coil (I) in the fringe field of the MRI scanner. Frequency, amplitude, and number of the sinusoidal oscillation cycles were controlled by an arbitrary function generator connected via an audio amplifier to the driving coil. The main polarization of the vibration was transverse to the principal axis of the magnet field, with amplitudes on the order of tens of micrometers.
2.3.2. Data acquisition
All measurements were performed on a 7 T scanner (Bruker PharmaScan 70/16, Ettlingen, Germany) running ParaVision 4.0 software and using a 20 mm diameter mouse head coil. The vibration was initiated by a trigger pulse from the control unit of the scanner, the timing of which was defined by a customized FLASH sequence. The imaging sequence was modified for MRE by a sinusoidal motion sensitizing gradient (MSG) in the through-plane direction, as described elsewhere (Riek et al., 2011). The MSG strength was 285 mT/m, with a frequency of 900 Hz, and 9 periods. To compensate for static phase contributions, phase difference images were calculated from two images differing in the sign of the MSG. Further imaging parameters were: a 128 × 128 matrix, 25 mm FoV, 14.3 ms echo time (TE), 116.2 ms repetition time (TR), eight dynamic scans over a vibration period, one transverse 2-mm slice, and an acquisition time of 20 min.
2.3.3. Data analysis
Image preprocessing involved subtraction of complex wave images for eliminating static phase shifts, phase unwrapping, and conversion of phases to deflections (in units of microns) by a coefficient incorporating vibration frequency and MSG characteristics (Asbach et al., 2008).
The resulting wave images u(x,y,t), with x and y as spatial coordinates and t as time variable of the propagating shear waves, were temporally Fourier-transformed. To remove noise and contributions of compression waves, the resulting complex wave images U(x,y,ω) were filtered using a Butterworth bandpass between the thresholds of 0.00135 m and 0.0124 m wavelengths. A 2D-Helmholtz inversion was applied to the filtered data, yielding the complex shear modulus, G * (x,y) = − ρω2U(x,y)/ΔU(x,y). Herein, Δ denotes the 2D-Laplace operator, while ρ is the mass density which was set to 1000 kg/m3. G * (x,y,w) was spatially averaged over the brain parenchyma displayed in the image. We further analyzed spatially averaged G*-values represented by the real part of G *, G ′ = Re(G *), known as storage modulus, the imaginary part G ″ = Im(G *), which is the loss modulus, the magnitude |G * | = abs(G *) and the loss factor given by the ratio G ″/G ′ = Im(G *)/Re(G *). The storage, loss and magnitude moduli are expressed in kilopascals (kPa). Fig. 1C shows real and imaginary parts of complex wave images U(x,y) and complex modulus images G*(x,y) in a representative mouse.
2.4. Histology
Mice were transcardially perfused with zinc fixative (0.5% zinc acetate, 0.5% zinc chloride, 0.05% calcium acetate). The brains were removed and postfixed for 3 days at room temperature with zinc fixative, cryoprotected by incubation overnight at 4 degrees in 30% sucrose in PBS, then embedded in Tissue Tek O.C.T. (Optimal Cutting Temperature) compound, and frozen in methylbutane with dry ice. The frozen tissues were cut into 12 μm cryosections and stained with hematoxylin and eosin (H&E) to assess inflammation and with luxol fast blue to assess demyelination. For immunostaining, tissue sections were blocked with avidin, biotin, and normal goat serum, then incubated overnight at 4 °C with rat anti-mouse CD3 antibody (BD Pharmingen). The sections were then incubated with biotinylated goat anti-rat IgG antibody (Vector Laboratories), then streptavidin-conjugated peroxidase, and visualized with Vector NovaRED Peroxidase substrate (Vector Laboratories) and counterstained with hematoxylin.
2.5. Quantitative RT PCR
After cryostat sections were prepared, the residual brain tissue was reserved for RNA. Total RNA was extracted from the cerebellar tissue by the guanidinium thiocyanate method, with the peqGOLD TriFast reagent (Peqlab, Erlangen, Germany), according to the manufacturer's instructions. The RNA was reverse transcribed, and quantitative PCR (qPCR) carried out as described previously, using an ABI Prism 7000 Sequence Detection System (Applied Biosystems) (Millward et al., 2007). Primers and probes were from Eurofins MWG Operon (Ebersberg, Germany), and the sequences used were as follows: CD3epsilon: forward 5′-CCT CCT AGC TGT TGG CAC TTG-3′, reverse 5′-CAC TGG TTC CTG AGA TGG AGA CT-3′, probe 5′FAM-CAG GAC GAT GCC GAG AAC ATT GAA TAC A-3′TAMRA. Cycle threshold values were converted to arbitrary units using a standard curve, and data are reported as the ratio of target gene expression over 18s rRNA, which served as the endogenous reference.
2.6. Statistics
Elastography parameters were analyzed by paired t-test or 1-way ANOVA with the Tukey's post hoc test, after verifying that the data had a Gaussian distribution. Cumulative disease activity scores (dimensionless) were derived from calculating the area under the curve of the score-by-day plots for each individual mouse (Fleming et al., 2005). Pearson correlations between the elastography parameters and the PCR data were assessed. p-Values < 0.05 were considered significant. Calculations were done using GraphPad Prism v.4 (GraphPad software).
3. Results
3.1. Viscoelasticity of normal mouse brain
To generate baseline values of viscoelasticity measurements in the healthy mouse brain, and to assess the accuracy and reproducibility of our MRE investigations, we monitored seven wildtype mice. Representative color coded wave (deflection) images and complex modulus maps are shown in Fig. 1C, superimposed on T2-weighted anatomical images of the mouse head. Both the real and imaginary parts of the complex wave and shear moduli are shown, after Fourier transform (900 Hz component). The values for G′ and G″ were obtained from averaging over the color coded region. The mean storage modulus G′ was 6.098 ± 0.167 kPa, and the mean loss modulus G″ was 1.987 ± 0.081 kPa (Fig. 1D). To evaluate the consistency of these measurements, the same seven unmanipulated wildtype mice were measured again at two time points, 14 and 28 days after the initial measurements. For both the storage and loss moduli, these later time points showed no significant difference from the baseline measurements (p = 0.3804, p = 0.4686, respectively, ANOVA). Thus, in our hands, MRE measurements in the mouse brain are reliable and reproducible both intra- and inter-individually over this timescale.
3.2. Brain viscoelasticity in mice is reduced during the acute phase of EAE
Next, we investigated how brain viscoelasticity is affected in mice with EAE. MRE was performed at day 0, before immunization (to establish a baseline), and at day 14 post-immunization, when disease was well established. Immunized mice started to develop EAE around 6–7 days after PLP-immunization (Fig. 2A). Four out of 14 immunized mice showed no disease signs, as reflected by the cumulative disease activity plot of each individual mouse (mean ± sem 6.464 ± 1.371, Fig. 2B). We observed a significant reduction in G′ (5.988 ± 0.1647 vs. 5.301 ± 0.1620, mean kPa ± sem), G″ (1.881 ± 0.1121 vs. 1.617 ± 0.0909) and |G * | (6151 ± 185.1 vs. 5500 ± 179.1) in the EAE mice at day 14 compared to day 0 (Figs. 2C–E). In contrast, we saw no change in these parameters in 10 healthy non-immunized control mice measured at the same time points (mean kPa ± sem d0 vs. d14, G′: 6.048 ± 0.1202 vs. 6.034 ± 0.1346; G″: 2.005 ± 0.0710 vs. 1.885 ± 0.0995; |G*|: 6289 ± 125.1 vs. 6264 ± 160.2). As well, there were no significant differences between the EAE and control mice in the baseline measurements (prior to immunization). In both EAE and control mice, there was no difference in the ratio G″/G′ (EAE: 0.2991 ± 0.01175 vs. 0.3025 ± 0.01007; control: 0.3334 ± 0.00834 vs. 0.3099 ± 0.00889, Fig. 2F). As mentioned above, changes in the ratio G″/G′ reflects alterations in the complexity of the structural interactions in the tissue. Thus, during the early acute EAE phase, rigidity of the tissue is reduced, without affecting the tissue architecture.
Fig. 2.
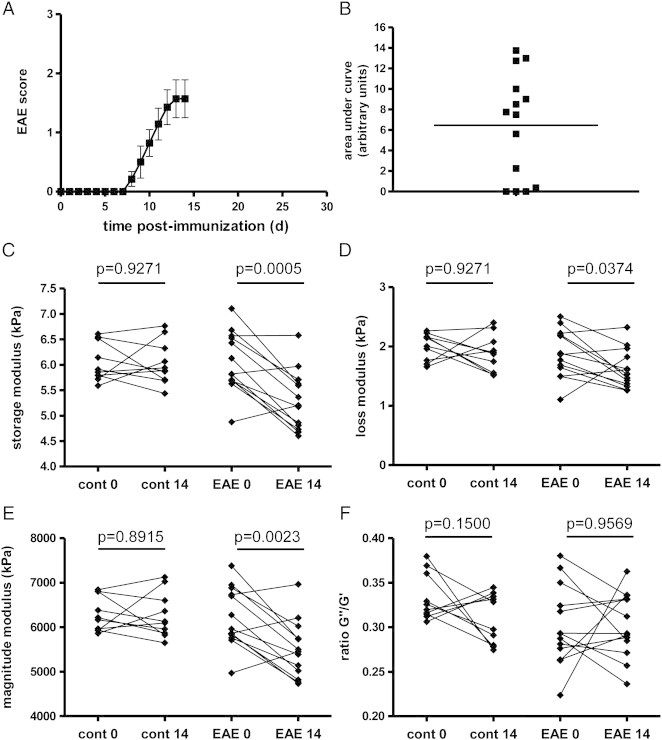
Brain viscoelasticity is reduced during acute inflammation. The EAE clinical course and plot of cumulative disease activity are shown in A and B. Significant reductions in the storage modulus (elasticity) C, loss modulus (viscosity) D, and the magnitude modulus E at day 14 are seen in EAE mice, but not in controls. No change is seen in the ratio of G″/G′, F. n = 10 and n = 14 for controls and EAE group, respectively.
Interestingly, when analyzing only those mice which were immunized but which failed to develop clinically detectable signs of EAE, we still observed statistically significant reductions in the same elastography parameters as when considering the entire group of EAE mice. Furthermore, we did not observe any statistically significant correlation between the storage or loss moduli and either the cumulative disease activity (calculated as the area under the curve of the clinical score plots for each individual EAE mouse), or the clinical score at time of MRE measurements (Appendix Fig. S2).
Fig. S2.
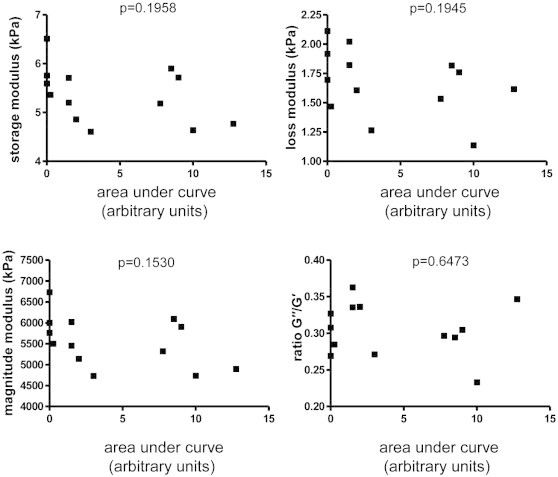
Elastography parameters are not correlated with EAE severity. The cumulative disease activity did not show any statistically significant correlation with any of the elastography parameters (Pearson correlation). Depicted here are representative data from the EAE recovery phase experiment (shown in Fig. 3).
Interestingly, when analyzing only those mice which were immunized but which failed to develop clinically detectable signs of EAE, we still observed statistically significant reductions in the same elastography parameters as when considering the entire group of EAE mice. Furthermore, we did not observe any statistically significant correlation between the storage or loss moduli and either the cumulative disease activity (calculated as the area under the curve of the clinical score plots for each individual EAE mouse), or the clinical score at time of MRE measurements (Appendix Fig. S2).
3.3. Normalization of brain viscoelastic properties during the recovery phase of EAE
PLP-induced EAE in SJL mice is characterized by a relapsing–remitting course. To investigate the stability of the observed elastographic changes over time during different EAE phases, we performed additional experiments with sequential MRE measurements at day 0 and 14, as well as at 28 days post immunization — a time when the clinical severity of EAE in SJL mice generally subsides from its peak intensity in most animals (Fig. 3A). These mice also showed a wide range of disease severity, indicated in the cumulative disease activity plot (mean ± sem = 12.77 ± 3.21, Fig. 3B). Five of the immunized mice were removed from the data set due to premature death from EAE, or MRE measurement error. As previously observed, there was a statistically significant reduction in the storage (mean kPa ± sem 6.058 ± 0.1137 vs. 5.237 ± 0.1985), loss (2.033 ± 0.0845 vs. 1.542 ± 0.0789) and magnitude (6274 ± 185.7 vs. 5489 ± 0.00924) moduli at day 14. However, during the recovery phase of the disease, these parameters increased (d28 G′: 5.526 ± 0.1595; G″: 1.697 ± 0.0969; |G*|: 5793 ± 237.2, Figs. 3C–E). Despite variation in individual mice, the mean values at d28 were not significantly different from the baseline measurements, suggesting that the tissue alterations reflected by changes in MRE parameters may indeed have a transitory or partially reversible nature. We did not detect any change in the ratio G″/G′ (Fig. 3F).
Fig. 3.
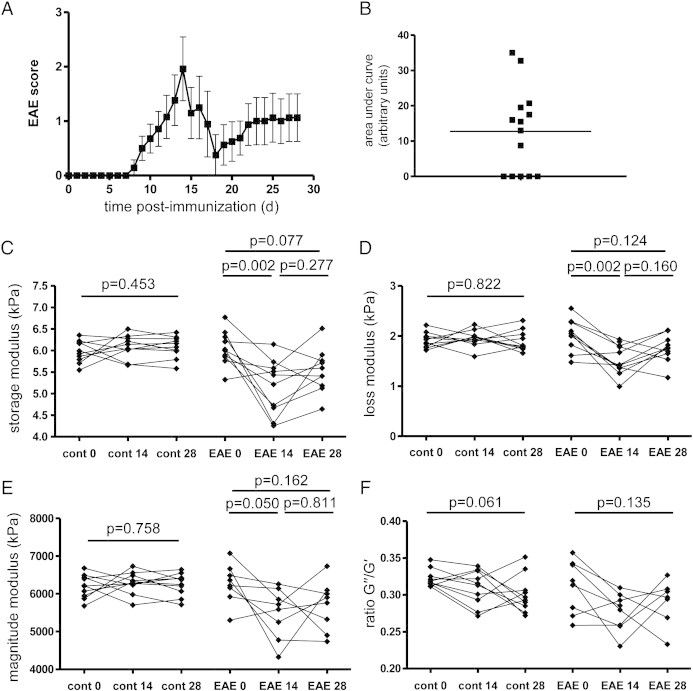
Brain viscoelasticity normalizes during the recovery phase of EAE. The EAE clinical course and plot of cumulative disease activity are shown in A and B. In EAE mice, the significant reductions in the storage modulus (elasticity) C, loss modulus (viscosity) D, and the magnitude modulus E seen at day 14 are normalized at day 28, and no longer significantly different from the baseline values. No change is seen in the ratio of G″/G′, F. n = 10 and n = 10 for controls and EAE group.
3.4. Changes in brain viscoelasticity correlate with the magnitude of inflammation
To determine the histological correlates of the observed reduction of the elastography parameters, we investigated the extent of inflammation and demyelination in the mouse brains extracted immediately after MRE investigations on day 14 (Fig. 4). Staining with H&E revealed brain lesions affecting principally the cerebellum as expected for this animal model. A representative image of lesions in white matter tracts in the cerebellum is shown in Fig. 4, in comparison to a healthy non-immunized control. At this time point no demyelinating lesions were observed in the brains of the EAE mice by luxol fast blue staining (Fig. 4, LFB), although demyelinating lesions were clearly present in the spinal cords of these mice (data not shown). At the day 28 time point, some animals showed a reduction in clinical disease severity which was associated with relatively mild inflammatory pathology, compared to the peak of disease. A representative image is also shown in Fig. 4. Demyelinating lesions were not observed in the brains of mice at day 28, although they were still present in the spinal cords.
Fig. 4.
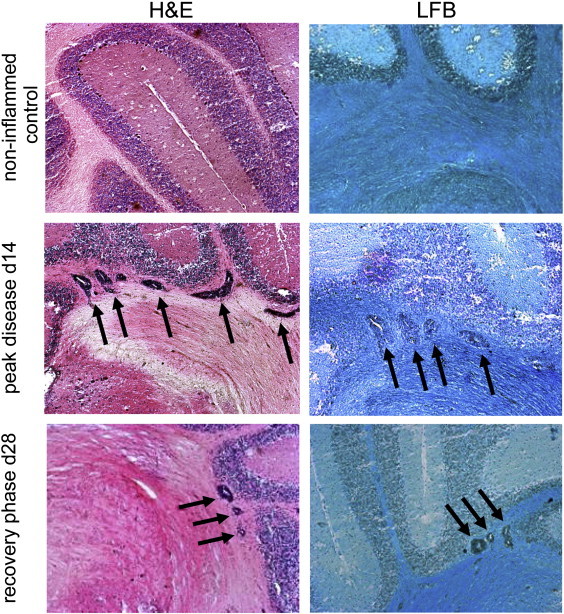
Histological features in EAE. Representative images of hematoxylin and eosin (H&E) staining show absence of pathology in healthy controls, in contrast to robust inflammatory lesions (arrows) in the cerebellum white matter at the peak of the disease (d14), and relatively milder lesions from the recovery phase (day 28). Staining with luxol fast blue (LFB) indicates that the cerebellar lesions (arrows) are not associated with demyelination.
In this model, inflammation is primarily mediated by auto-reactive T cells. Immunohistochemical staining of CD3 + T cells in inflamed areas confirmed that the majority of the infiltrated cells are indeed T lymphocytes (representative images of mild and severe lesions are shown in Figs. 5A, B). CD3 is a marker for all T cells, and in the healthy non-inflamed CNS, CD3 mRNA is below the limit of detection by quantitative real-time PCR. During EAE, T cells infiltrate the CNS in sufficient numbers allowing CD3 mRNA to be detectable. Thus the magnitude of CD3 expression can serve as an unbiased, quantitative surrogate measure of the severity of CNS inflammation (Appendix Fig. S3). Using this parameter, we found a clear, significant correlation between the degree of T cell-mediated inflammation and the changes in the elastography measurements: higher levels of CD3 expression were reflected by greater reductions in the storage (r = − 0.6197; p = 0.0181), loss (r = − 0.6199; p = 0.0180) and magnitude moduli (r = − 0.6215; p = 0.0177), as shown in Figs. 5C–E, which includes data from both the d14 and d28 time points. There was no significant correlation between CD3 expression and the G″/G′ ratio (r = − 0.2555; p = 0.3739) (Fig. 5F).
Fig. 5.
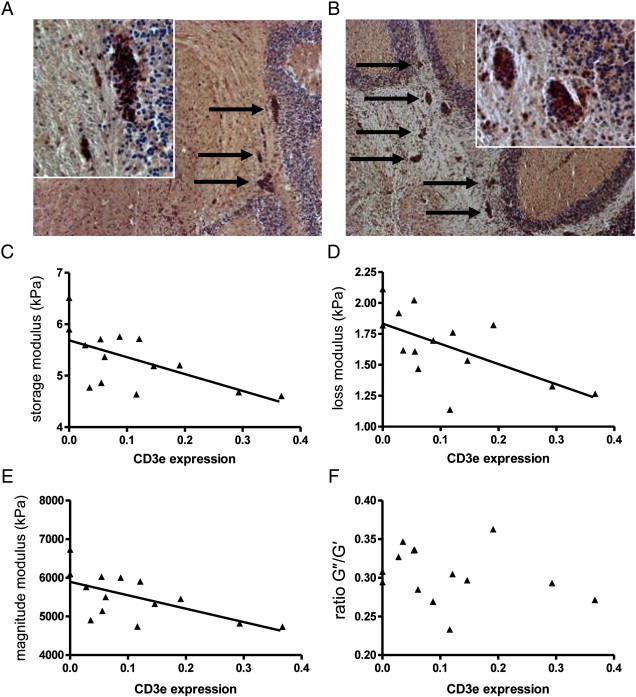
Elastographic alterations correlate with CD3 epsilon expression. Immunohistochemical staining for CD3 reveals the presence of T lymphocytes in mild, A, and severe, B cerebellar white matter lesions (arrows). The level of CD3 epsilon mRNA in the cerebellum (from both the d14 and d28 time points) detected by quantitative real-time PCR is significantly correlated with the magnitude of the storage modulus (elasticity) C, loss modulus (viscosity) D, and the magnitude modulus E values, but not with the ratio of G″/G′, F.
Fig. S3.
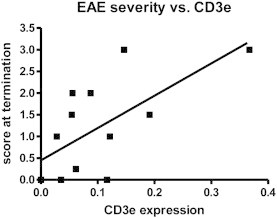
The magnitude of CD3 epsilon expression in cerebellum is significantly correlated with EAE disease severity (Spearman r = 0.6397, p = 0.0186).
In this model, inflammation is primarily mediated by auto-reactive T cells. Immunohistochemical staining of CD3 + T cells in inflamed areas confirmed that the majority of the infiltrated cells are indeed T lymphocytes (representative images of mild and severe lesions are shown in Figs. 5A, B). CD3 is a marker for all T cells, and in the healthy non-inflamed CNS, CD3 mRNA is below the limit of detection by quantitative real-time PCR. During EAE, T cells infiltrate the CNS in sufficient numbers allowing CD3 mRNA to be detectable. Thus the magnitude of CD3 expression can serve as an unbiased, quantitative surrogate measure of the severity of CNS inflammation (Appendix Fig. S3). Using this parameter, we found a clear, significant correlation between the degree of T cell-mediated inflammation and the changes in the elastography measurements: higher levels of CD3 expression were reflected by greater reductions in the storage (r = − 0.6197; p = 0.0181), loss (r = − 0.6199; p = 0.0180) and magnitude moduli (r = − 0.6215; p = 0.0177), as shown in Figs. 5C–E, which includes data from both the d14 and d28 time points. There was no significant correlation between CD3 expression and the G″/G′ ratio (r = − 0.2555; p = 0.3739) (Fig. 5F).
4. Discussion
Previous studies of MRE applied to MS patients showed a clear reduction in the viscoelasticity of diseased brains, as compared to healthy controls (Streitberger et al., 2012; Wuerfel et al., 2010). To investigate the cellular and molecular mechanisms underlying this phenomenon, it was necessary to extend these investigations into the animal model of CNS inflammation. To date, only a few studies applying MRE in the mouse brain have been published (Atay et al., 2008; Clayton et al., 2011; Schregel et al., 2011) and the present study is the first to utilize this method in the EAE model. Our results showed a robust and reproducible reduction of brain elasticity and viscosity associated with the magnitude of focal inflammation during EAE. Importantly, MRE changes appeared to partially normalize during the recovery phase of the disease, when inflammation was resolved.
The application of MRE in experimental mouse models is a field which is still under development, and standard values for the elastography parameters of the healthy non-inflamed mouse CNS have yet to be established. Therefore, in our study, we first aimed to define the normal values of viscoelastic measurements in the mouse brain, using a 7-tesla MR device. Our results show good correspondence with recent mouse MRE studies (Clayton et al., 2011; Schregel et al., 2011). However, numerous studies show discrepant results (Atay et al., 2008; Mace et al., 2011; Vappou et al., 2008), due in part to anatomical and technical differences, thus underscoring the necessity for the establishment of a “gold standard” for in vivo elastography in the mouse. Nevertheless, our measurements in healthy control mice show good consistency (Fig. 1D), reflecting sufficient shear wave penetration, appropriate filtering, and spatial averaging as applied to our data (Clayton et al., 2011).
Our results showed that at the peak of clinical severity, day 14 post-immunization, both the storage and loss moduli, as well as the magnitude modulus, were significantly reduced in the EAE animals. In contrast, the control animals showed no changes in these parameters. There was no significant change in the ratio of G″/G′, (an indicator of the complexity of cellular and non-cellular structural interactions in tissue) at the peak of EAE, indicating that acute CNS inflammation affects the viscoelastic properties independently of alterations in tissue architecture. This finding is in agreement with the observations in human MS patients that the integrity of neuronal tissue is degraded compared to healthy controls, while the structural complexity is preserved (Wuerfel et al., 2010).
Next, we aimed to determine the effects of neuroinflammatory processes on MRE parameters during the course of the disease. By day 28, the reductions in the storage, loss and magnitude moduli seen at day 14 had normalized to the point where they were not significantly different from the values at baseline. Again, no significant alterations of the G″/G′ ratio were observed. This indicates that the tissue alterations detected by MRE at peak disease are at least partially reversible.
Interestingly, we observed statistically significant alterations of the viscoelastic parameters even in mice that were immunized but that failed to develop clinically detectable signs of EAE. It is important to bear in mind that in such asymptomatic immunized mice, the absence of clinical signs does not exclude the possibility of pathological tissue alterations, comparable with the well established phenomenon in MS — the so-called “clinical–radiological paradox”, in which MRI-detectable lesions can be found in patients also in the absence of apparent clinical manifestation (Barkhof, 2002; Okuda et al., 2009).
In our study, we could not detect a statistically significant correlation between any elastography parameter and either the cumulative disease severity, or the clinical score on the day of MRE, even if the asymptomatic mice were excluded from the analysis. However, this finding is not entirely unexpected, given that the clinical scoring system for EAE reflects damage affecting the spinal cord rather than the brain (i.e. initial paresis and paralysis of the tail, followed by ascending paralysis of the hind and forelimbs). Thus, while pathology also clearly occurs in the brain in EAE, there is no standardized scoring system available to quantify brain involvement in this model. The present study is consistent with our previous study of MRE in MS patients, in which the elastographic changes did not correlate with disease severity as measured by the Expanded Disability Status Scale (EDSS) (Streitberger et al., 2012; Wuerfel et al., 2010).
While there was substantial heterogeneity in the magnitude of the pathology at both day 14 and day 28 time points, the great majority of inflammatory lesions in the brain and cerebellum had a perivascular morphology, with little or no infiltration into the CNS parenchyma. Furthermore, luxol fast blue staining showed that these lesions were not associated with demyelination. This was in contrast to the spinal cord, which showed disseminated lesions with extensive parenchymal infiltration and clear evidence of demyelination. Given that the MRE measurements focused on the brain and cerebellum exclusively, it seems likely that demyelination per se is not sufficient to explain the changes in the elastography parameters, observed at these acute time points. Furthermore, these results indicate that MRE is highly sensitive to pathological changes, in that alterations in the elastography parameters could be detected even in the absence of severe tissue damage. Thus, inflammation, rather than macroscopic tissue disruption, appears to affect MRE measurements in this animal model, at these time points.
This interpretation is supported by the clear correlation between the levels of CD3 epsilon expression and the storage, loss and magnitude moduli — higher CD3 epsilon levels were associated with greater reductions in tissue integrity. This suggests that the CNS tissue alterations revealed by MRE are indeed related to the severity of inflammation, and that MRE is sufficiently sensitive to detect such alterations even in the absence of disseminated parenchymal inflammation. Although the precise mechanisms underlying this relationship remain to be determined, one could speculate that the accumulation of immune cells in the perivascular space may lead to a transient alteration of the CNS parenchyma in the vicinity of the vessels or that MRE is sensitive enough to detect endothelial alterations in this early stage of inflammation.
The potential for MRE to reveal acute inflammatory changes in CNS tissue represents an intriguing development. MRE has already proven extremely useful for detecting tissue changes associated with chronic degenerative processes, including aging (Sack et al., 2011). Neurodegenerative processes are also implicated in EAE. Atrophy of the cerebellar cortex has been described in chronic stages of EAE, 48–56 days post-immunization (MacKenzie-Graham et al., 2006). While it is quite likely that atrophy in chronic EAE would be associated with elastographic changes, in the present study the MRE and histological assessment was completed by day 28 post-immunization, well before the reported onset of atrophy. It therefore seems unlikely that cerebellar atrophy per se can account for the MRE changes observed at day 14 after immunization. Moreover, the observations that these changes normalized with the resolution of inflammation at day 28 suggest that reversible processes are responsible for the viscoelastic alterations at day 14, rather than irreversible degeneration and atrophy, at least at this acute time point.
In the present study, we focused the MRE investigations on the brain, despite the fact, mentioned above, that the EAE model we employed here generally shows greater, though not exclusive, pathological involvement of the spinal cord. Thus it would be interesting to extend the application of MRE to other disease models such as some forms of “atypical” EAE models (Lees et al., 2008; Stromnes et al., 2008), in which the disease manifests principally in the cerebellum and brainstem, rather than the spinal cord.
With the current state of the art, MRE can provide consistent quantitative values on a global scale, i.e. considering spatially averaged constants. This permits the determination of elastographic parameters in the entire tissue, and can address diffuse pathology. The usefulness of this approach has already been demonstrated by several studies in human liver (Asbach et al., 2008; Huwart et al., 2007; Yin et al., 2007) and brain (Murphy et al., 2011; Streitberger et al., 2011; Wuerfel et al., 2010). However, at present the technology is limited in its capacity to address elastographic changes in discrete regions of the brain. Specifically, confined boundary conditions present in the murine brain may impose backscattering, which could potentially cause standing waves and wave nodes. In those regions, the wave analysis is biased and the resulting elastograms suffer from severe inversion-related artifacts. Reconstruction methods are being developed which address this issue by using advanced wave models (Baghani et al., 2011; Okamoto et al., 2011; Van Houten et al., 2011) or multifrequency inversion (Papazoglou et al., 2012). In general, the technology of MRE continues to advance, and the application of this method is expanding into new domains.
5. Conclusions
MRE holds great promise as a technique that can complement conventional MRI approaches. The results of the present study demonstrate that MRE can detect tissue alterations associated with acute inflammation in the CNS. While the mechanisms underlying these changes remain to be determined in future studies, the fact that they were observed in the absence of demyelination, and were reversible, suggests that MRE has a high sensitivity to detect relatively early and mild events in the pathological process such as perivascular immune infiltrates. This speaks to the potential clinical utility of MRE to reveal early events in CNS disease processes, and to monitor the response to therapies applied in the earliest stages of the disease, even before strong disruption of the blood brain barrier and marked clinical disability are evident.
Competing interests
The authors declare that they have no competing interests.
Abbreviations
- MRE
magnetic resonance elastography
- MS
multiple sclerosis
- EAE
experimental autoimmune encephalomyelitis
Author's contributions
C.I.-D and I. S. designed the research; K.R., J.M., I.H. and J. B. performed the research and analyzed the data; C.P and F.P contributed to the research design and data analysis. J. M., C.I.-D and I. S. wrote the paper.
The following are the supplementary data related to this article.
Supplementary data to this article can be found online at http://dx.doi.org/10.1016/j.nicl.2012.09.003.
Acknowledgments
This work was supported by the Deutsche Forschungsgemeinschaft (KFO 213, Sa901/4, Br2235/3 and Exc 257). We thank Natascha Asselborn for technical assistance.
Footnotes
This is an open-access article distributed under the terms of the Creative Commons Attribution-NonCommercial-ShareAlike License, which permits non-commercial use, distribution, and reproduction in any medium, provided the original author and source are credited.
Contributor Information
Kerstin Riek, Email: kerstin.riek@charite.de.
Jason M. Millward, Email: jason.millward@charite.de.
Isabell Hamann, Email: isabell.hamann@gmx.de.
Susanne Mueller, Email: susanne.mueller1@charite.de.
Caspar F. Pfueller, Email: caspar.pfueller@charite.de.
Jürgen Braun, Email: juergen.braun@charite.de.
Carmen Infante-Duarte, Email: carmen.infante@charite.de.
Ingolf Sack, Email: ingolf.sack@charite.de.
References
- Asbach P., Klatt D., Hamhaber U., Braun J., Somasundaram R., Hamm B., Sack I. Assessment of liver viscoelasticity using multifrequency MR elastography. Magnetic Resonance in Medicine. 2008;60:373–379. doi: 10.1002/mrm.21636. [DOI] [PubMed] [Google Scholar]
- Asbach P., Klatt D., Schlosser B., Biermer M., Muche M., Rieger A., Loddenkemper C., Somasundaram R., Berg T., Hamm B., Braun J., Sack I. Viscoelasticity-based Staging of Hepatic Fibrosis with Multifrequency MR Elastography. Radiology. 2010;257(1):80–86. doi: 10.1148/radiol.10092489. [DOI] [PubMed] [Google Scholar]
- Atay S.M., Kroenke C.D., Sabet A., Bayly P.V. Measurement of the dynamic shear modulus of mouse brain tissue in vivo by magnetic resonance elastography. Journal of Biomechanical Engineering. 2008;130:021013. doi: 10.1115/1.2899575. [DOI] [PMC free article] [PubMed] [Google Scholar]
- Baghani A., Salcudean S., Honarvar M., Sahebjavaher R.S., Rohling R., Sinkus R. Travelling wave expansion: a model fitting approach to the inverse problem of elasticity reconstruction. IEEE Transactions on Medical Imaging. 2011;30(8):1555–1565. doi: 10.1109/TMI.2011.2131674. [DOI] [PubMed] [Google Scholar]
- Barkhof F. The clinico-radiological paradox in multiple sclerosis revisited. Current Opinion in Neurology. 2002;15:239–245. doi: 10.1097/00019052-200206000-00003. [DOI] [PubMed] [Google Scholar]
- Clayton E.H., Garbow J.R., Bayly P.V. Frequency-dependent viscoelastic parameters of mouse brain tissue estimated by MR elastography. Physics in Medicine and Biology. 2011;56:2391–2406. doi: 10.1088/0031-9155/56/8/005. [DOI] [PMC free article] [PubMed] [Google Scholar]
- Fleming K.K., Bovaird J.A., Mosier M.C., Emerson M.R., LeVine S.M., Marquis J.G. Statistical analysis of data from studies on experimental autoimmune encephalomyelitis. Journal of Neuroimmunology. 2005;170:71–84. doi: 10.1016/j.jneuroim.2005.08.020. [DOI] [PubMed] [Google Scholar]
- Green M.A., Bilston L.E., Sinkus R. In vivo brain viscoelastic properties measured by magnetic resonance elastography. NMR in Biomedicine. 2008;21:755–764. doi: 10.1002/nbm.1254. [DOI] [PubMed] [Google Scholar]
- Guo J., Posnansky O., Hirsch S., Scheel M., Taupitz M., Braun J., Sack I. Fractal network dimension and viscoelastic powerlaw behavior: II. An experimental study of structure-mimicking phantoms by magnetic resonance elastography. Physics in Medicine and Biology. 2012;57(12):4041–4053. doi: 10.1088/0031-9155/57/12/4041. [DOI] [PubMed] [Google Scholar]
- Huwart L., Sempoux C., Salameh N., Jamart J., Annet L., Sinkus R., Peeters F., ter Beek L.C., Horsmans Y., Van Beers B.E. Liver fibrosis: noninvasive assessment with MR elastography versus aspartate aminotransferase-to-platelet ratio index. Radiology. 2007;245:458–466. doi: 10.1148/radiol.2452061673. [DOI] [PubMed] [Google Scholar]
- Klatt D., Hamhaber U., Asbach P., Braun J., Sack I. Noninvasive assessment of the rheological behavior of human internal organs using multifrequency MR elastography: a study of brain and liver viscoelasticity. Physics in Medicine and Biology. 2007;52:7281–7294. doi: 10.1088/0031-9155/52/24/006. [DOI] [PubMed] [Google Scholar]
- Klatt D., Papazoglou S., Braun J., Sack I. Viscoelasticity-based Magnetic resonance elastography of skeletal muscle. Physics in Medicine and Biology. 2010;55:6445–6459. doi: 10.1088/0031-9155/55/21/007. [DOI] [PubMed] [Google Scholar]
- Kruse S.A., Rose G.H., Glaser K.J., Manduca A., Felmlee J.P., Jack C.R., Jr., Ehman R.L. Magnetic resonance elastography of the brain. NeuroImage. 2008;39:231–237. doi: 10.1016/j.neuroimage.2007.08.030. [DOI] [PMC free article] [PubMed] [Google Scholar]
- Lees J.R., Golumbek P.T., Sim J., Dorsey D., Russell J.H. Regional CNS responses to IFN-gamma determine lesion localization patterns during EAE pathogenesis. The Journal of Experimental Medicine. 2008;205:2633–2642. doi: 10.1084/jem.20080155. [DOI] [PMC free article] [PubMed] [Google Scholar]
- Lu Y.B., Franze K., Seifert G., Steinhauser C., Kirchhoff F., Wolburg H., Guck J., Janmey P., Wei E.Q., Kas J., Reichenbach A. Viscoelastic properties of individual glial cells and neurons in the CNS. Proceedings of the National Academy of Sciences of the United States of America. 2006;103:17759–17764. doi: 10.1073/pnas.0606150103. [DOI] [PMC free article] [PubMed] [Google Scholar]
- Mace E., Cohen I., Montaldo G., Miles R., Fink M., Tanter M. In vivo mapping of brain elasticity in small animals using shear wave imaging. IEEE Transactions on Medical Imaging. 2011;30:550–558. doi: 10.1109/TMI.2010.2079940. [DOI] [PubMed] [Google Scholar]
- MacKenzie-Graham A., Tinsley M.R., Shah K.P., Aguilar C., Strickland L.V., Boline J., Martin M., Morales L., Shattuck D.W., Jacobs R.E., Voskuhl R.R., Toga A.W. Cerebellar cortical atrophy in experimental autoimmune encephalomyelitis. NeuroImage. 2006;32:1016–1023. doi: 10.1016/j.neuroimage.2006.05.006. [DOI] [PubMed] [Google Scholar]
- Mariappan Y.K., Glaser K.J., Ehman R.L. Magnetic resonance elastography: a review. Clinical Anatomy. 2010;23:497–511. doi: 10.1002/ca.21006. [DOI] [PMC free article] [PubMed] [Google Scholar]
- Miller D.H., Thompson A.J., Filippi M. Magnetic resonance studies of abnormalities in the normal appearing white matter and grey matter in multiple sclerosis. Journal of Neurology. 2003;250:1407–1419. doi: 10.1007/s00415-003-0243-9. [DOI] [PubMed] [Google Scholar]
- Millward J.M., Caruso M., Campbell I.L., Gauldie J., Owens T. IFN-gamma-induced chemokines synergize with pertussis toxin to promote T cell entry to the central nervous system. Journal of Immunology. 2007;178:8175–8182. doi: 10.4049/jimmunol.178.12.8175. [DOI] [PubMed] [Google Scholar]
- Murphy M.C., Huston J., III, Jack C.R., Jr., Glaser K.J., Manduca A., Felmlee J.P., Ehman R.L. Decreased brain stiffness in Alzheimer's disease determined by magnetic resonance elastography. Journal of Magnetic Resonance Imaging. 2011 doi: 10.1002/jmri.22707. [DOI] [PMC free article] [PubMed] [Google Scholar]
- Muthupillai R., Lomas D.J., Rossman P.J., Greenleaf J.F., Manduca A., Ehman R.L. Magnetic resonance elastography by direct visualization of propagating acoustic strain waves. Science. 1995;269:1854–1857. doi: 10.1126/science.7569924. [DOI] [PubMed] [Google Scholar]
- Okamoto R.J., Clayton E.H., Bayly P.V. Viscoelastic properties of soft gels: comparison of magnetic resonance elastography and dynamic shear testing in the shear wave regime. Physics in Medicine and Biology. 2011;56(19):6379–6400. doi: 10.1088/0031-9155/56/19/014. [DOI] [PMC free article] [PubMed] [Google Scholar]
- Okuda D.T., Mowry E.M., Beheshtian A., Waubant E., Baranzini S.E., Goodin D.S., Hauser S.L., Pelletier D. Incidental MRI anomalies suggestive of multiple sclerosis: the radiologically isolated syndrome. Neurology. 2009;72:800–805. doi: 10.1212/01.wnl.0000335764.14513.1a. [DOI] [PubMed] [Google Scholar]
- Papazoglou S., Hirsch S., Braun J., Sack I. Multifrequency inversion in magnetic resonance elastography. Physics in Medicine and Biolog. 2012;57(8):2329–2346. doi: 10.1088/0031-9155/57/8/2329. [DOI] [PubMed] [Google Scholar]
- Pattison A.J., Lollis S.S., Perrinez P.R., Perreard I.M., McGarry M.D., Weaver J.B., Paulsen K.D. Time-harmonic magnetic resonance elastography of the normal feline brain. Journal of Biomechanics. 2010 doi: 10.1016/j.jbiomech.2010.06.008. [DOI] [PMC free article] [PubMed] [Google Scholar]
- Posnansky O., Guo J., Hirsch S., Papazoglou S., Braun J., Sack I. Fractal network dimension and viscoelastic powerlaw behavior: I. A modeling approach based on a coarse-graining procedure combined with shear oscillatory rheometry. Physics in Medicine and Biology. 2012;57(12):4023–4040. doi: 10.1088/0031-9155/57/12/4023. [DOI] [PubMed] [Google Scholar]
- Riek K., Klatt D., Nuzha H., Mueller S., Neumann U., Sack I., Braun J. Wide-range dynamic magnetic resonance elastography. Journal of Biomechanics. 2011;44:1380–1386. doi: 10.1016/j.jbiomech.2010.12.031. [DOI] [PubMed] [Google Scholar]
- Sack I., Beierbach B., Wuerfel J., Klatt D., Hamhaber U., Papazoglou S., Martus P., Braun J. The impact of aging and gender on brain viscoelasticity. Neuroimage. 2009;46(3):652–657. doi: 10.1016/j.neuroimage.2009.02.040. [DOI] [PubMed] [Google Scholar]
- Sack I., Streitberger K.J., Krefting D., Paul F., Braun J. The influence of physiological aging and atrophy on brain viscoelastic properties in humans. PloS One. 2011;6:e23451. doi: 10.1371/journal.pone.0023451. [DOI] [PMC free article] [PubMed] [Google Scholar]
- Schregel K., Wuerfel E., Garteiser P., Prozorovskiy T., Merz H., Petersen D., Wuerfel J., Sinkus R. Proceedings 19th Scientific Meeting, International Society for Magnetic Resonance in Medicine, Montreal. 2011. Biomechanical properties quantified in vivo by Magnetic Resonance Elastography correlate with myelination and brain parenchymal properties — a combined 7 Tesla MRE and histopathology study in a mouse model of Multiple Sclerosis; p. 40. [Google Scholar]
- Streitberger K.J., Wiener E., Hoffmann J., Freimann F.B., Klatt D., Braun J., Lin K., McLaughlin J., Sprung C., Klingebiel R., Sack I. In vivo viscoelastic properties of the brain in normal pressure hydrocephalus. NMR in Biomedicine. 2011;24:385–392. doi: 10.1002/nbm.1602. [DOI] [PubMed] [Google Scholar]
- Streitberger K.J., Sack I., Krefting D., Pfuller C., Braun J., Paul F., Wuerfel J. Brain viscoelasticity alteration in chronic-progressive multiple sclerosis. PloS One. 2012;7:e29888. doi: 10.1371/journal.pone.0029888. [DOI] [PMC free article] [PubMed] [Google Scholar]
- Stromnes I.M., Cerretti L.M., Liggitt D., Harris R.A., Goverman J.M. Differential regulation of central nervous system autoimmunity by T(H)1 and T(H)17 cells. Nature Medicine. 2008;14:337–342. doi: 10.1038/nm1715. [DOI] [PMC free article] [PubMed] [Google Scholar]
- Tully B., Ventikos Y. Cerebral water transport using multiple-network poroelastic theory: application to normal pressure hydrocephalus. Journal of Fluid Mechanics. 2011;667:188–215. [Google Scholar]
- Vappou J., Breton E., Choquet P., Willinger R., Constantinesco A. Assessment of in vivo and post-mortem mechanical behavior of brain tissue using magnetic resonance elastography. Journal of Biomechanics. 2008;41:2954–2959. doi: 10.1016/j.jbiomech.2008.07.034. [DOI] [PubMed] [Google Scholar]
- Van Houten E.E., Viviers D., McGarry M.D., Perrinez P.R., Perreard I.I., Weaver J.B., Paulsen K.D. Subzone based magnetic resonance elastography using a Rayleigh damped material model. Physics in Medicine and Biology. 2011;38(4):1993–2004. doi: 10.1118/1.3557469. [DOI] [PMC free article] [PubMed] [Google Scholar]
- Wuerfel J., Paul F., Beierbach B., Hamhaber U., Klatt D., Papazoglou S., Zipp F., Martus P., Braun J., Sack I. MR-elastography reveals degradation of tissue integrity in multiple sclerosis. NeuroImage. 2010;49:2520–2525. doi: 10.1016/j.neuroimage.2009.06.018. [DOI] [PubMed] [Google Scholar]
- Yin M., Talwalkar J.A., Glaser K.J., Manduca A., Grimm R.C., Rossman P.J., Fidler J.L., Ehman R.L. Assessment of hepatic fibrosis with magnetic resonance elastography. Clinical Gastroenterology and Hepatology. 2007;5(1207–1213):e1202. doi: 10.1016/j.cgh.2007.06.012. [DOI] [PMC free article] [PubMed] [Google Scholar]