Abstract
Pulmonary hypertension (PH) often leads to dilatation of the pulmonary artery (PA), which can be measured on chest computed tomography (CT). While the predictive capability of PA dilatation is useful to distinguish PH (mean PA pressure ≥25 mmHg) from normal (mean PA pressure ≤ 20 mmHg), CT characteristics of borderline PH (mean PA pressure 21-24 mmHg) have not been described. We aimed to investigate whether patients with borderline PH already show PA dilatation and to assess the diagnostic accuracy of PA dilatation for borderline PH diagnosis. Between April 2003 and September 2008, consecutive symptomatic patients with a mean PA pressure below 25 mmHg on right heart catheterization who had a chest CT available were retrospectively included. PA diameters from chest CT were correlated with hemodynamic measurements and analyzed with respect to their accuracy of predicting borderline PH. Main PA diameters were significantly larger in 26 patients with borderline PH compared with 52 patients without PH (3.16 ± 0.53 vs. 2.78 ± 0.43 cm, P = 0.001). The main PA diameter on CT correlated with mean PA pressure (r = 0.496, P < 0.001) and pulmonary vascular resistance (r = 0.445, P < 0.001), and predicted borderline PH with sensitivity, specificity, negative and positive predictive values of 77%, 62%, 84%, and 50%, respectively, using a cutoff ≥2.9 cm. This first systematic investigation of CT parameters in symptomatic patients with mean PA pressures less than 25 mmHg could show that, even in patients with borderline PH, significant PA dilatation can be present, which was related to PA pressure and pulmonary vascular resistance. This can be useful for identification of patients with borderline PH for further study and to prompt further diagnostic work-up of possible underlying diseases.
Keywords: borderline pulmonary hypertension, computed tomography, early diagnosis, pulmonary artery dilatation, screening
Pulmonary hypertension (PH) is defined by an elevation of the mean pulmonary artery pressure (mPAP) ≥ 25 mmHg at rest on right heart catheterization[1] and carries a poor prognosis.[2,3,4,5] As the upper limit of normal for mPAP is about 20 mmHg,[6] in 2008 at the 4th World Symposium on Pulmonary Hypertension it was stated that “further studies are needed to better determine the natural history of patients with mPAP of 21 to 24 mmHg”.[1] Although there is no official definition, this range of mPAP could be referred to as “borderline PH.” As the primary complaint of patients with PH is dyspnea, many of these patients receive a computed tomography (CT) of the chest as part of the diagnostic work-up. It has been reported that easily accessible CT parameters, such as the diameter of the main pulmonary artery (PA), correlate well with hemodynamic measurements on right heart catheterization and can therefore be used to assess the probability of PH.[7,8,9,10,11,12,13] However, the difference in mPAP between patient groups with and without PH in reported studies is usually wide, and patients with an mPAP between 21 and 24 mmHg have not been specifically addressed.[11,12]
The aims of our study were to investigate whether patients with slight elevations of mPAP in a borderline range from 21 to 24 mmHg already show increased PA diameters and to assess the diagnostic accuracy of CT parameters for borderline PH diagnosis.
MATERIALS AND METHODS
All consecutive patients between April 2003 and September 2008 with a mean PA pressure below 25 mmHg on right heart catheterization who had a chest CT available within 100 days were included in this retrospective single-center study. In duplicate cases, only the first right heart catheter examination and the temporally closest CT were used. Demographic patient information and clinical diagnoses were extracted from the medical record.
Approval of the ethics committee was waived (after appropriate inquiry) due to retrospective analysis and usage of anonymized data. A subset of patients from the control group (exclusion of PH on right heart catheterization) has been investigated in another study from our group.[13]
Right heart catheter
Measurements of systolic, diastolic, and mean PA pressure, PA occlusion pressure, and right atrial pressure were performed using a Swan-Ganz catheter. Cardiac output was obtained by thermodilution technique averaging at least three consecutive measurements with a maximum deviation of 10%. Pulmonary vascular resistance was calculated as (mPAP-PA occlusion pressure) ×80/cardiac output (dyn×s×cm-5). PH was diagnosed by an mPAP ≥25 mmHg at rest and excluded by an mPAP ≤20 mmHg. Patients with an mPAP of 21-24 mmHg were diagnosed with borderline PH.
Acquisition of CT images
Images were acquired with a 16-slice multidetector CT scanner (Somatom Sensation 16, Siemens Medical Solutions, Erlangen, Germany). CT scans were obtained in supine position with breath-holding at full inspiration. The following acquisition parameters were used: Collimation 16 × 0.75 mm, rotation time 0.5 s, pitch 1.25, tube voltage 120 kV, tube current dose modulated 50-200 mAs. Contrast medium was used depending on clinical indication for the CT and kidney function. CT scans were reconstructed at contiguous section widths of 1-3 mm using a soft-tissue (B31f) and a sharp reconstruction kernel (B60f).
Measurement of CT parameters
CT scans were reviewed by an independent observer (Jaroslava Stiefel) who was blinded to clinical and hemodynamic data. The following parameters, as indicated in Figure 1, were measured in triplicate on axial sections in mediastinal window settings (center 50, width 450): (1) Widest diameter of the main PA (MPAD) within 3 cm of the bifurcation; (2) Diameter of the left and right PA at the widest portion distal to the bifurcation; and (3) Widest diameter of the ascending aorta and widest anteroposterior diameter of the thoracic vertebra (referred to as “internal standard”), each measured on the same CT section used for MPAD. The MPAD was related to diameters of ascending aorta, thoracic vertebra, and body surface area to adjust for possible influences of patient size.
Figure 1.
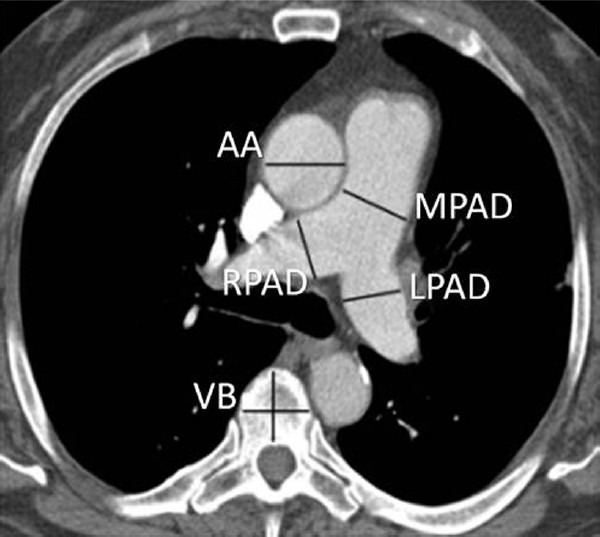
Measurement of parameters of interest on axial CT. AA: ascending aorta; LPAD: left pulmonary artery diameter; MPAD: main pulmonary artery diameter; RPAD: right pulmonary artery diameter; VB: vertebral body.
Statistical analysis
Continuous variables are given as mean, standard deviation (SD), and range where appropriate. After testing for normal distribution, we used the t-test for unpaired samples for comparison of hemodynamic and CT parameters between groups. The chi-square test was used for nonparametric comparisons. PA diameters and hemodynamic parameters (both normally distributed) were correlated using Pearson's correlation coefficient, followed by multivariate linear regression analysis. For diagnostic utility calculations, receiver operating characteristic (ROC) curves were used. Results are expressed in terms of area under the curve (AUC) and 95% confidence interval (CI) for this area. Sensitivity, specificity, negative and positive predictive values were estimated with ROC curves or calculated from 2 × 2 contingency tables (after dichotomization of variables). A two-sided P < 0.05 was considered statistically significant. For all calculations, SPSS statistic package 18 (version 18.0.0, IBM, Armonk, N.Y., USA) was used.
RESULTS
Patients
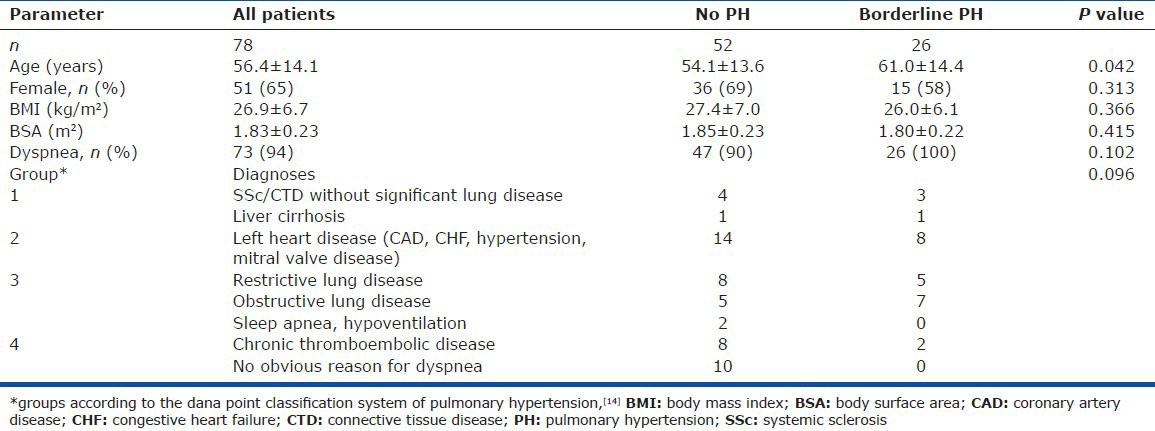
The patient selection process is displayed in Figure 2. The mean time difference between right heart catheterization and CT in the 78 patients who entered the analysis was 11.4 ± 19.7 days (range: 0-99, median three days). The baseline characteristics are given in Table 1.
Figure 2.
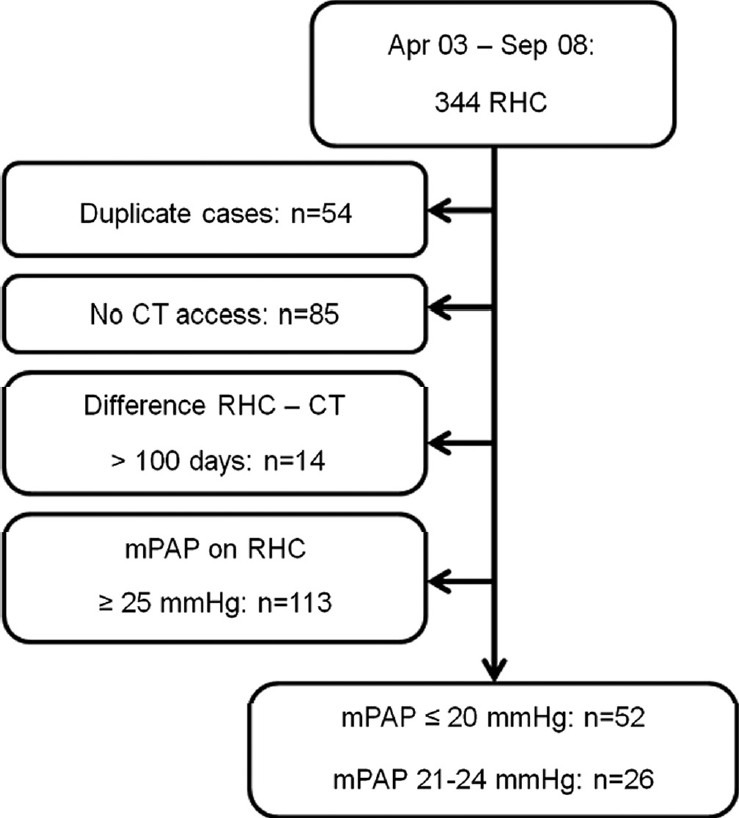
Selection process of patients under study. CT: computed tomography; mPAP: mean pulmonary artery pressure; RHC: right heart catheterization.
Table 1.
Demographic patient data and diagnoses according to patient groups
Indication for CT and right heart catheterization
Patient's major complaint (n = 73, 94%) was dyspnea, which was the primary CT indication. Five patients without reported dyspnea received an echocardiography as a routine check-up (n = 2) or for diagnostic work-up of persistent cough (n = 2) or dizziness (n = 1), showing elevated right ventricular systolic pressures. The primary clinical indication for right heart catheterization was suspected PH or reliable exclusion of PH in patients with otherwise unexplained dyspnea. Patient's diagnoses grouped according to the Dana Point classification system of PH[14] are given in Table 1.
Hemodynamic parameters
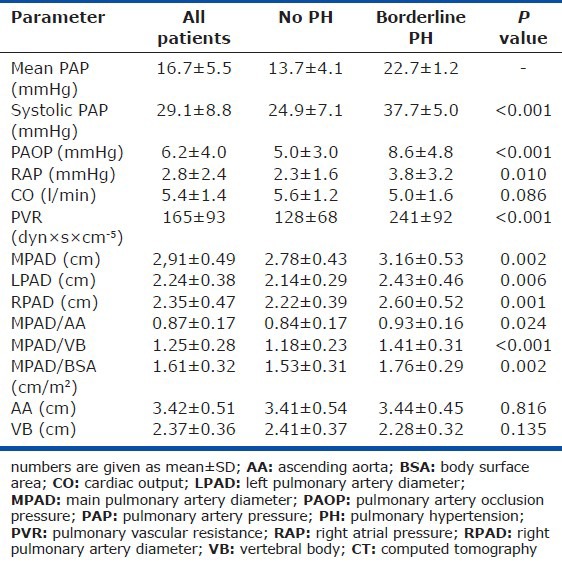
Patients were grouped according to mPAP on right heart catheterization. Hemodynamic parameters with respect to the different groups are displayed in Table 2. Patients with borderline PH had slightly but significantly higher right atrial and PA occlusion pressures. Three patients with borderline PH had a PA occlusion pressure of more than 15 mmHg (16 and 2 × 18 mmHg). Pulmonary vascular resistance was significantly higher in borderline PH patients compared to patients without PH.
Table 2.
Parameters from right heart catheterization and CT according to patient groups
CT parameters
PA diameters and ratios of MPAD to diameters of ascending aorta, thoracic vertebra, and body surface area were all significantly higher in patients with borderline PH compared with patients without PH (Table 2). As depicted in Figure 3, all CT parameters showed a moderate capability to distinguish patients with borderline PH from those without PH on ROC analysis with only slight differences. The parameter with the highest AUC was the ratio of MPAD to body surface area, which showed sensitivity, specificity, negative and positive predictive values of 85%, 52%, 87%, and 47%, respectively, using a cutoff > 1.5 cm/m2. According to AUC, the best single parameter for prediction of borderline PH was MPAD. When ≥ 2.9 cm, sensitivity, specificity, negative and positive predictive values were 77%, 62%, 84%, and 50%, respectively Figure 4.
Figure 3.
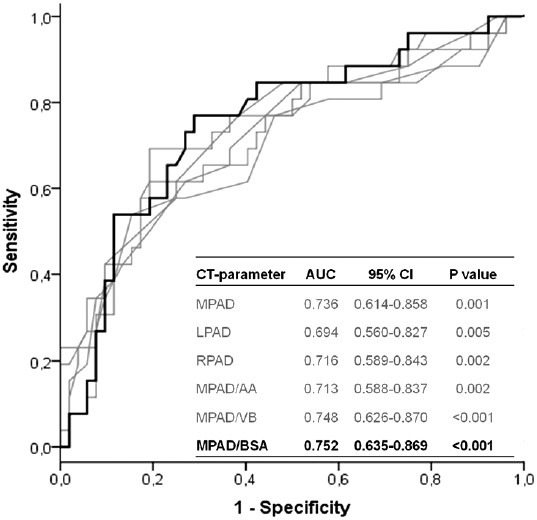
ROC analyses of CT parameters for the prediction of borderline PH. AA: ascending aorta; AUC: area under the curve; BSA: body surface area; CI: confidence interval; CT: computed tomography; LPAD: left pulmonary artery diameter; MPAD: main pulmonary artery diameter; RPAD: right pulmonary artery diameter; VB: vertebral body.
Figure 4.
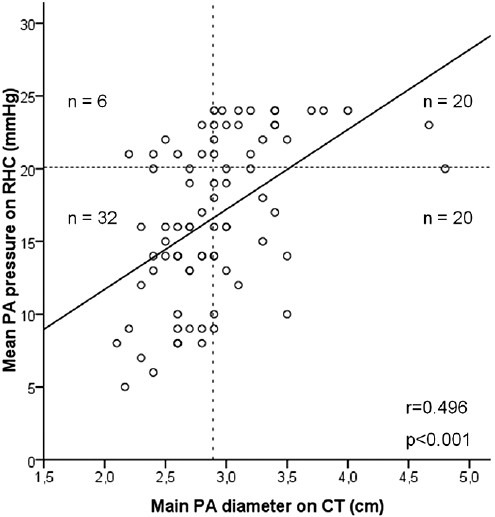
Correlation of main pulmonary artery diameter and mPAP. The dotted horizontal line indicates 20 mmHg (inclusive) as upper limit of the normal mPAP. The dotted vertical line indicates an MPAD ≥ 2.9 cm. CT: computed tomography; n: number of patients in the respective quadrant; PA: pulmonary artery; r: pearson's correlation coefficient; RHC: right heart catheterization.
The MPAD showed a moderate correlation with mPAP (r = 0.496, P < 0.001; Fig. 4) and pulmonary vascular resistence (r = 0.445, P < 0.001). Pearson's correlation coefficients between other CT-parameters and hemodynamic variables are shown in Table 3. The relations between MPAD and hemodynamic measures were still significant after adjustment for age and body size (Table 4).
Table 3.
Pearson’s correlation coefficients between CT parameters and hemodynamic variables
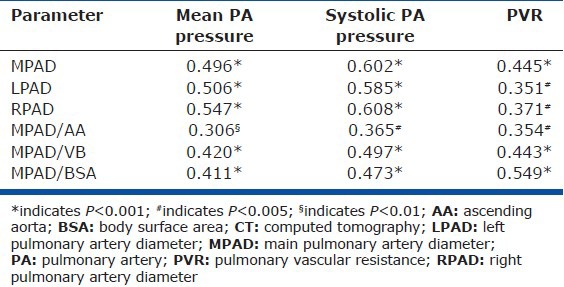
Table 4.
Predictors of hemodynamics (multivariate linear regression analysis)

DISCUSSION
To the best of our knowledge, this is the first study specifically investigating CT parameters in patients with right heart catheter-diagnosed borderline PH. We could show that PA diameters measured on chest CT can already be significantly larger in patients with borderline PH compared with symptomatic patients without PH. PA diameters were significantly and independently related to PA pressures and pulmonary vascular resistance. An MPAD of ≥ 2.9 cm was found to be a sensitive parameter for diagnosis of borderline PH with a high negative predictive value of 84%.
CT parameters in patients without PH
To recognize a pathologic dilatation of the PA, a reference value is essential. Recently, the mean MPAD in 3,171 individuals from the Framingham Heart Study was reported to be 2.51 ± 0.28 cm on unenhanced CT.[15] In this study, MPAD was larger in the minority of individuals with dyspnea, obesity, hypertension, diabetes, and cardiovascular diseases, and was weakly but significantly related to age. Patients without PH in our study had a mean MPAD of 2.78 ± 0.43 cm, which is reasonably higher compared to the Framingham collective. This could be explained by a higher mean age (54.1 ± 13.6 vs. 50.8 ± 10.3 years) and a greater proportion of patients with dyspnea (90% vs. 20.9%) and cardiovascular diseases (27% vs. 6%) in the control group of our study compared to the Framingham participants. In addition, four and eight patients in our control group had scleroderma and chronic thromboembolic disease, respectively, suggesting a possible pulmonary vascular pathology even in the absence of (borderline) PH.
CT parameters in patients with borderline PH
Patients with PH often show PA dilatation on chest CT. Although earlier studies also used a cutoff for mPAP on right heart catheterization of more than 20 mmHg for PH diagnosis, the difference in mPAP between patients with PH and controls was usually large.[11,12] For example, in the study by Edwards et al.,[12] the mean mPAP in their patients with PH was 49 mmHg (ranging from 33 to 63 mmHg) with a corresponding MPAD in patients and controls of 3.47 ± 0.33 cm and 2.72 ± 0.3 cm, respectively. Although the difference in mean mPAP between patients with borderline PH and without PH in our study was only 9 mmHg, we observed significantly larger PA diameters in patients with borderline PH. Therefore, PA dilatation seems to occur with even mild elevations in PA pressure and could be useful as an early diagnosis tool.
Patients with borderline PH were older and had higher PA occlusion pressures, which can influence PA diameters.[15] However, the almost two-fold higher mean pulmonary vascular resistance in patients with borderline PH compared with patients without PH suggests a relevant underlying pulmonary vascular pathology.
Correlation of MPAD and hemodynamic parameters
PA diameters and MPAD ratios were significantly and independently related to PA pressures and pulmonary vascular resistance (Tables 3 and 4). However, the correlations observed are considerably weaker compared to the literature. This could be explained by the narrow range in mPAP from 5 to 24 mmHg in our study. For example, the mPAP in 32 patients with a variety of heart diseases in a study by Kuriyama et al.[9] showed a wide range from 7 to 95 mmHg with a corresponding correlation between MPAD and mPAP of r = 0.83. Another important factor influencing the correlation between PA diameters and pressures is patient selection. Devaraj et al.[16] could not find a significant correlation between MPAD and mPAP in 30 patients with pulmonary fibrosis (r = 0.23, P = 0.22) compared with 47 patients without fibrosis (r = 0.67, P < 0.0001). As we analyzed consecutive patients including 13 (17%) with restrictive lung disease, this could also explain the comparatively weak correlations observed.
Diagnostic accuracy of CT parameters for prediction of borderline PH
The diagnostic accuracy of PA diameters for the prediction of PH depends upon the characteristics of patients under study. In 36 patients with PH (24 parenchymal lung disease, 12 “pulmonary vascular disease”), Tan et al.[11] found an MPAD ≥ 2.9 cm on CT to predict an mPAP ≥20 mmHg on right heart catheterization with high sensitivity and specificity of 87% and 89%, respectively. This was accomplished by comparison of patients with manifest PH (mean mPAP: 38.6 ± 12.9 mmHg) and a corresponding large mean MPAD of 3.5 ± 0.5 cm with a control group with a markedly lower mean mPAP and MPAD of 16.7 ± 2.8 mmHg and 2.7 ± 0.2 cm, respectively. Despite the small difference in mPAP of only 9 mmHg between the groups in our study, we found a reasonable diagnostic accuracy of CT parameters for the prediction of borderline PH. As a simple and sensitive parameter is needed for daily clinical use to recognize the possibility of even borderline PH in patients presenting with dyspnea, we suggest using the MPAD with a cutoff ≥ 2.9 cm for screening on routine chest CT.
Clinical relevance of borderline PH
Although to date there are not yet prognostic implications for patients with borderline PH, detection of these patients and further diagnostic work-up seems to be important. First, a potentially underlying condition (e.g., minor chronic thromboembolic disease) should be diagnosed and treated to ideally preclude further progression. Second, in patients without identifiable causes of PH, a close follow-up strategy with noninvasive tests followed by right heart catheterization when deteriorating could facilitate an early diagnosis of pulmonary arterial hypertension and initiation of targeted therapy with the potential to alter the course of the disease.[17]
Limitations
The findings of our study have to be interpreted in the light of possible limitations. First, we examined only symptomatic patients referred for CT and right heart catheterization, limiting the generalizability of our findings. Second, we did not use electrocardiography-gated CT, making our measurements prone to variability due to motion artifacts. CT parameters were assessed by one blinded investigator only. However, values were averaged from triplicate measurements showing no relevant variations (data not shown). In addition, parameters measured in our study are known to have only a small inter- and intra-observer variation.[15,16] Although we would not anticipate relevant differences in the measurement of PA diameters according to the use of contrast medium, we did not register its use, possibly influencing accuracy of measurements. The mean time difference between right heart catheterization and CT was 11.4 ± 19.7 (0-99) days with a median of three days. Despite the wide range, this seems to be acceptable compared to other studies in the field, reporting differences between CT and right heart catheterization of one to nine months.[11,16]
In this first systematic investigation of CT parameters in consecutive symptomatic patients with mPAP < 25 mmHg, we could show that even in patients with borderline PH significant PA dilatation can be present, which was related to PA pressure and pulmonary vascular resistance. Our findings facilitate the probability-assessment of borderline PH on routine chest CT scans with a reasonable diagnostic accuracy and can be useful for identification of patients with borderline PH for further study. As an MPAD of ≥ 2.9 cm on CT in dyspneic patients showed a high sensitivity and negative predictive value of 77% and 84%, respectively, we recommend this cutoff to consider the presence of borderline PH. Further stepwise diagnostic testing should then be carried out to diagnose possible underlying diseases or to enable a close follow-up strategy in patients with possible early pulmonary arterial hypertension. However, it has to be pointed out that there is no upper or lower threshold of the PA diameter for exclusion or confirmation of PH. Whenever the clinical suspicion of PH persists, a right heart catheterization as the gold standard for PH diagnosis should be performed.
Footnotes
Source of Support: None
Conflict of Interest: None declared.
REFERENCES
- 1.Badesch DB, Champion HC, Gomez Sanchez MA, Hoeper MM, Loyd JE, Manes A, et al. Diagnosis and assessment of pulmonary arterial hypertension. J Am Coll Cardiol. 2009;54:55–66. doi: 10.1016/j.jacc.2009.04.011. [DOI] [PubMed] [Google Scholar]
- 2.Oswald-Mammosser M, Weitzenblum E, Quoix E, Moser G, Chaouat A, Charpentier C, et al. Prognostic factors in COPD patients receiving long-term oxygen therapy. Importance of pulmonary artery pressure. Chest. 1995;107:1193–8. doi: 10.1378/chest.107.5.1193. [DOI] [PubMed] [Google Scholar]
- 3.Lettieri CJ, Nathan SD, Barnett SD, Ahmad S, Shorr AF. Prevalence and outcomes of pulmonary arterial hypertension in advanced idiopathic pulmonary fibrosis. Chest. 2006;129:746–52. doi: 10.1378/chest.129.3.746. [DOI] [PubMed] [Google Scholar]
- 4.Ghio S, Gavazzi A, Campana C, Inserra C, Klersy C, Sebastiani R, et al. Independent and additive prognostic value of right ventricular systolic function and pulmonary artery pressure in patients with chronic heart failure. J Am Coll Cardiol. 2001;37:183–8. doi: 10.1016/s0735-1097(00)01102-5. [DOI] [PubMed] [Google Scholar]
- 5.McLaughlin VV, Presberg KW, Doyle RL, Abman SH, McCrory DC, Fortin T, et al. Prognosis of pulmonary arterial hypertension: ACCP evidence-based clinical practice guidelines. Chest. 2004;126:78–92. doi: 10.1378/chest.126.1_suppl.78S. [DOI] [PubMed] [Google Scholar]
- 6.Kovacs G, Berghold A, Scheidl S, Olschewski H. Pulmonary arterial pressure during rest and exercise in healthy subjects: A systematic review. Eur Respir J. 2009;34:888–94. doi: 10.1183/09031936.00145608. [DOI] [PubMed] [Google Scholar]
- 7.Liu M, Ma Z, Guo X, Zhang H, Yang Y, Wang C. Computed tomographic pulmonary angiography in the assessment of severity of chronic thromboembolic pulmonary hypertension and right ventricular dysfunction. Eur J Radiol. 2011;80:462–9. doi: 10.1016/j.ejrad.2010.08.035. [DOI] [PubMed] [Google Scholar]
- 8.Liu M, Ma Z, Guo X, Chen X, Yang Y, Wang C. Cardiovascular parameters of computed tomographic pulmonary angiography to assess pulmonary vascular resistance in patients with chronic thromboembolic pulmonary hypertension. Int J Cardiol. 2013;164:295–300. doi: 10.1016/j.ijcard.2011.07.019. [DOI] [PubMed] [Google Scholar]
- 9.Kuriyama K, Gamsu G, Stern RG, Cann CE, Herfkens RJ, Brundage BH. CT-determined pulmonary artery diameters in predicting pulmonary hypertension. Invest Radiol. 1984;19:16–22. doi: 10.1097/00004424-198401000-00005. [DOI] [PubMed] [Google Scholar]
- 10.Haimovici JB, Trotman-Dickenson B, Halpern EF, Dec GW, Ginns LC, Shepard JA, et al. Relationship between pulmonary artery diameter at computed tomography and pulmonary artery pressures at right-sided heart catheterization. Massachusetts General Hospital Lung Transplantation Program. Acad Radiol. 1997;4:327–34. doi: 10.1016/s1076-6332(97)80111-0. [DOI] [PubMed] [Google Scholar]
- 11.Tan RT, Kuzo R, Goodman LR, Siegel R, Haasler GB, Presberg KW. Utility of CT scan evaluation for predicting pulmonary hypertension in patients with parenchymal lung disease. Medical College of Wisconsin Lung Transplant Group. Chest. 1998;113:1250–6. doi: 10.1378/chest.113.5.1250. [DOI] [PubMed] [Google Scholar]
- 12.Edwards PD, Bull RK, Coulden R. CT measurement of main pulmonary artery diameter. Br J Radiol. 1998;71:1018–20. doi: 10.1259/bjr.71.850.10211060. [DOI] [PubMed] [Google Scholar]
- 13.Dornia C, Lange TJ, Behrens G, Stiefel J, Müller-Wille R, Poschenrieder F, et al. Multidetector computed tomography for detection and characterization of pulmonary hypertension in consideration of WHO classification. J Comput Assist Tomogr. 2012;36:175–80. doi: 10.1097/RCT.0b013e31824afbdf. [DOI] [PubMed] [Google Scholar]
- 14.Simonneau G, Robbins IM, Beghetti M, Channick RN, Delcroix M, Denton CP, et al. Updated clinical classification of pulmonary hypertension. J Am Coll Cardiol. 2009;54:43–54. doi: 10.1016/j.jacc.2009.04.012. [DOI] [PubMed] [Google Scholar]
- 15.Truong QA, Massaro JM, Rogers IS, Mahabadi AA, Kriegel MF, Fox CS, et al. Reference values for normal pulmonary artery dimensions by noncontrast cardiac computed tomography: The Framingham Heart Study. Circ Cardiovasc Imaging. 2012;5:147–54. doi: 10.1161/CIRCIMAGING.111.968610. [DOI] [PMC free article] [PubMed] [Google Scholar]
- 16.Devaraj A, Wells AU, Meister MG, Corte TJ, Hansell DM. The effect of diffuse pulmonary fibrosis on the reliability of CT signs of pulmonary hypertension. Radiology. 2008;249:1042–9. doi: 10.1148/radiol.2492080269. [DOI] [PubMed] [Google Scholar]
- 17.Galiè N, Rubin L, Hoeper M, Jansa P, Al-Hiti H, Meyer G, et al. Treatment of patients with mildly symptomatic pulmonary arterial hypertension with bosentan (EARLY study): A double-blind, randomised controlled trial. Lancet. 2008;371:2093–100. doi: 10.1016/S0140-6736(08)60919-8. [DOI] [PubMed] [Google Scholar]


