

Abstract
Introduction:
The extraction of premolars as a practical form of orthodontic therapy has been accepted for many years, but there remains a controversy regarding the effect of premolar extraction to improve esthetics as well as dentoskeletal relationship. The esthetic impact of the soft-tissue profile might play a major role in deciding on premolar extraction or non-extraction treatment, particularly in borderline patients. This cephalometric study was undertaken to compare the post-treatment soft-tissue profiles of successfully managed Class II, Division 1 malocclusions treated with either all first premolar extractions or treatment with a non-extraction therapy.
Materials and Methods:
The sample consisted of 100 post-pubertal female patients of Class II Division I malocclusion. Group 1, treated with four first premolar extractions, consisted of 50 female patients with a mean age of 14 years 1 month. Group 2, treated without extractions, consisted of 50 patients with a mean age of 13 years 5 months. Pre-treatment and post-treatment lateral cephalometric radiographs were evaluated. The pre-treatment to post-treatment stage comparison and the intergroup comparison of the treatment changes were conducted between extraction and non-extraction groups of Class II malocclusion samples with t-tests.
Results:
The soft-tissue facial profiles of the extraction and non-extraction samples were the same following active treatment except for a more retruded lower lip and a more pronounced lower labial sulcus in those patients subjected to extraction.
Conclusions:
The extraction or non-extraction decision, if based on sound diagnostic criteria, seems to have no systematic detrimental effects on the facial profile.
Keywords: Dentoskeletal changes, extraction-non-extraction patients, standard edgewise mechanics, soft-tissue profile
Introduction
Class II malocclusions are frequently observed in orthodontic practice and are characterized by an incorrect relationship between the maxillary and mandibular arches, because of skeletal or dental problems or a combination of both.[1] Premolar extractions might be necessary for patients who have some crowding and protrusion.
Extraction patterns have changed over time. Due to the possible side effects of premolar extraction, non-extraction treatment became increasingly common in the 1970s. Until time numerous studies have compared the fluctuating patterns of positive and negative perceptions of the esthetic effects of extraction and non-extraction orthodontic treatments.[2,3,4,5] The role of facial esthetics on the extraction decision has increased in importance.[6,7] Each patient's treatment (extraction or non-extraction) Should be based on specific diagnostic criteria[8] as evaluation of the arch length discrepancy, mandibular incisor protrusion, curve of spee and lip protrusion, the indications and possibilities of securing space in the upper jaw by distalizing the upper molars; and evaluation of the general consequences on the soft-tissues of the facial profile.
Thus, the study was designed to assess whether the extraction or non-extraction treatment has an impact on facial attractiveness, by comparing orthodontic treatment outcomes in Indian female patients with border line Class II problems.
Objectives
To evaluate the treatment changes in soft-tissue variables in extraction and non-extraction groups
To compare the changes taking place in soft-tissue variables from one group to another.
Materials and Methods
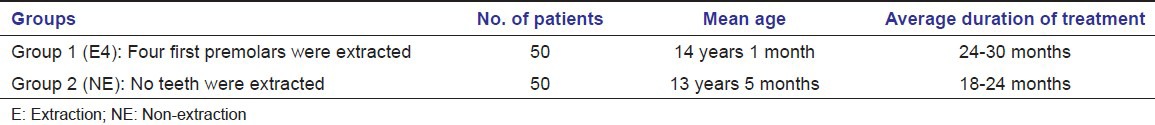
A total of 100 borderline Class II North Indian female patients were selected from the files of Orthodontics Department. Only female patients were selected, to minimize the effects attributable to residual growth and exclude possible differences in response between sexes. Patients were excluded based on their initial diagnostic record. Patients with craniofacial congenital anomalies, significant facial asymmetries, Class II Division 2 malocclusion, Class II patients with an ANB (Difference between SNA and SNB angle) angle more than 5° on the initial lateral cephalogram analysis and single arch extraction cases were excluded. All patients were to be treated with fixed edgewise mechanics. Selected samples were grouped as Table 1.
Table 1.
Group division of the selected sample
The cephalograms obtained from the department had been taken by properly positioning the patients on a universal counterbalancing type of cephalostat with the Frankfort horizontal (FH) plane parallel to the floor and the teeth in centric occlusion. All cephalograms had been taken with patients in a standing position with relaxed lips.[9]
Specific criteria for inclusion in this study included the availability of high-quality pre-treatment and post-treatment cephalometric radiographs that clearly showed the soft-tissue profile.
After placing registration points on the cephalogram, the pre-treatment and post-treatment radiographs were traced on acetate tracing sheets 0.5 μm in thickness using a sharp 4H pencil on a view box using transilluminated light in a dark room. Where there was a lack of superimposition of the right and left structural outline, the average between the two was drawn by inspection and the cephalometric points were located in reference to the arbitrary line so obtained. The linear and angular measurements were made to the nearest 0.5 mm and 0.5° respectively with the help of scale and protractor.
Method of analysis
Soft-tissue landmarks used in study are depicted in Figure 1.[10]
Figure 1.
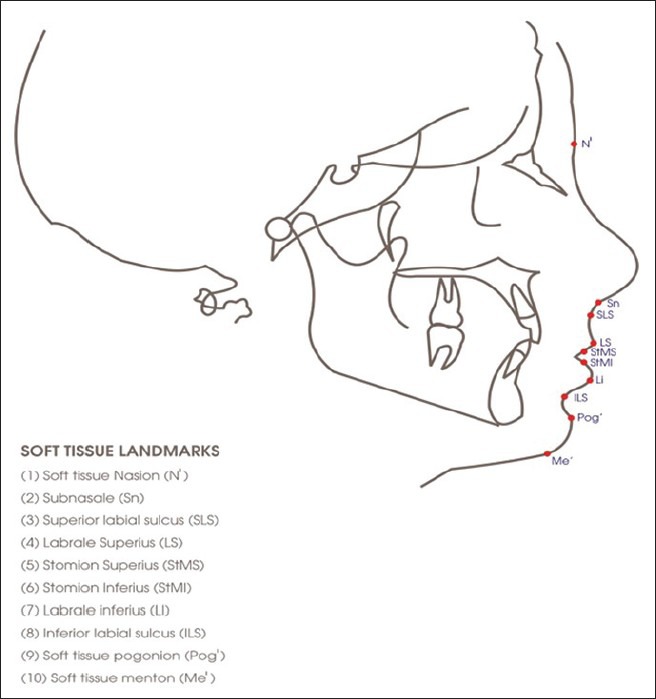
Soft-tissue landmarks used in the study
Soft-tissue measurements
Angular [Figure 2]
Figure 2.
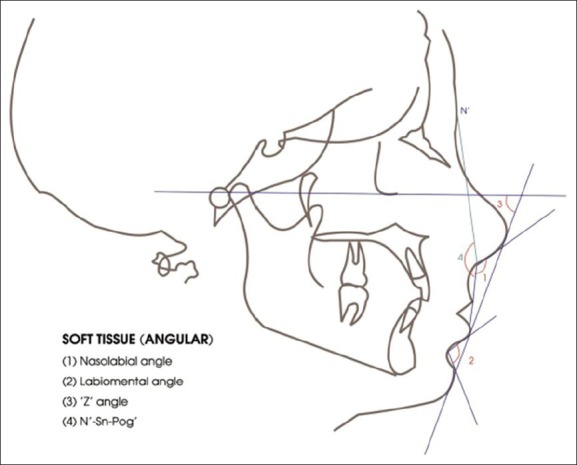
Angular variables analyzed
Nasolabial angle: Angle formed between tangent to columella and tangent to upper lip
Mentolabial angle: Angle formed between tangent to soft-tissue chin and tangent to lower lip at ILS
‘Z’ angle: Angle formed between FH plane and most protrusive lip to pog line
N’- Sn-Pog’: Facial convexity.
Linear [Figure 3]
Figure 3.
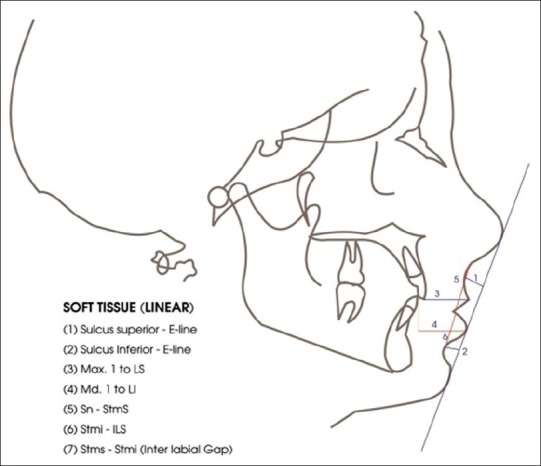
Linear variables analyzed
Sulcus superius - E line
Sulcus inferius - E line
Max. 1 to labrale superius
Md. Mandibular 1 to labrale inferius
Sn-Stms: Upper lip length
Stmi-ILS: Lower lip length
Stms-Stmi: Interlabial gap.
Reliability of landmark location and measurements
All cephalograms were obtained on the same cephalometric unit. All landmarks were identified by one investigator and checked for accuracy of location by a second investigator. The landmarks were digitized twice on separate occasions by two investigators. Allowable intra investigator and inter investigator discrepancies were pre-determined at 0.5 mm and 0.5°. The readings, which showed an increase in the post-treatment value as compared to pre-treatment values were recorded as positive while those which decreased after treatment were recorded as negative.
Statistical methods used for analysis of data
Means and standard deviations of the 11 variables previously described were calculated for both groups before and after treatment. The means and standard deviations for the differences that each treatment group experienced from pre-treatment to post-treatment were also calculated. Independent-sample t-tests were performed to test the significance of the differences between the change values of the two different treatment groups. Paired t-tests were performed to test the null hypothesis that no differences exist within the same treatment group between the onset and the end of treatment in the cephalometric measurements. The levels of significance tested were P < 0.05 and P < 0.01.
Reliability of measurement was tested by doing double determinations of 10 cephalograms randomly selected at 15 days interval from the collect sample, by the same operator and comparison was drawn between first and second determinations.
Results
All cephalograms were traced and analyzed for soft-tissue variables (4 angular and 7 linear). Pre-treatment and post-treatment mean soft-tissue profile measurements for the extraction and non-extraction groups are presented in Tables 2 and 3. A comparison of the treatment changes for the extraction and non-extraction groups was done. The results of the soft-tissue profile evaluation from the cephalometric tracings gave very similar findings for both groups [Table 4]. Significant differences between groups were found for the changes in lower lip and lower incisor only. Significantly, greater retraction of the lower lip relative to the esthetic plane was observed in the extraction group.
Table 2.
Extraction sample (group 1): Descriptive and inferential statistics of the soft-tissue analysis results (N=50)
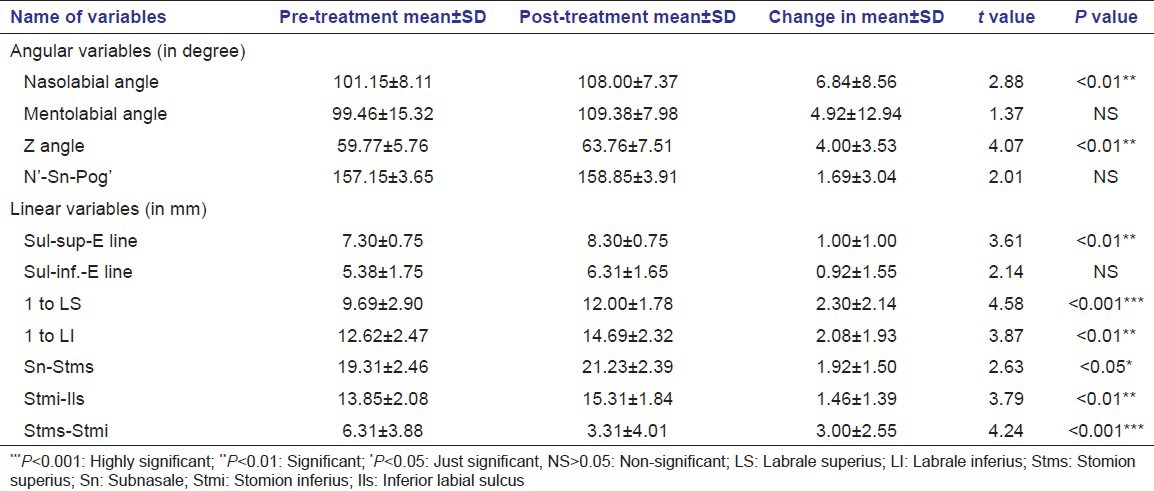
Table 3.
Non-extraction sample (group 2): Descriptive and inferential statistics of soft-tissue analysis (N=50)
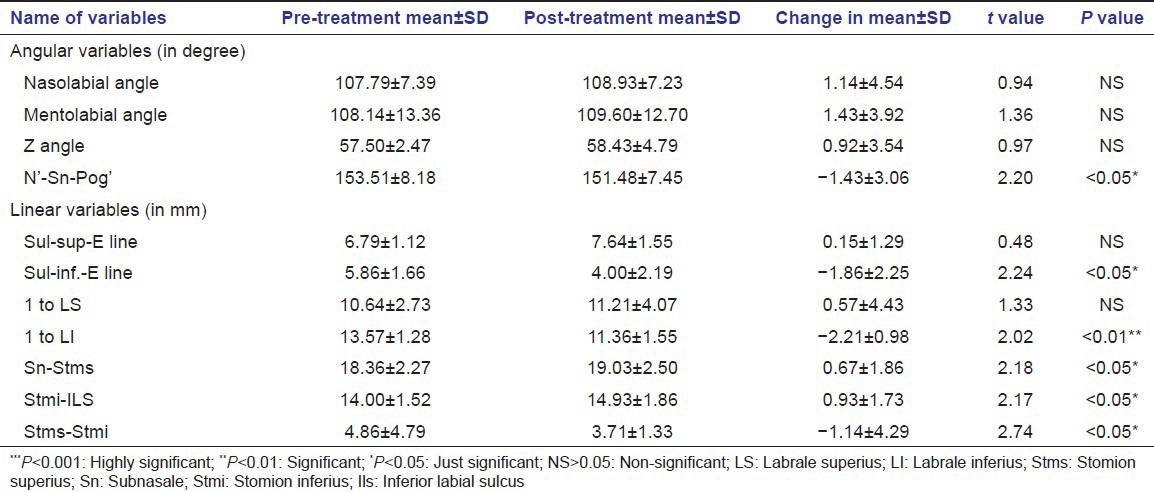
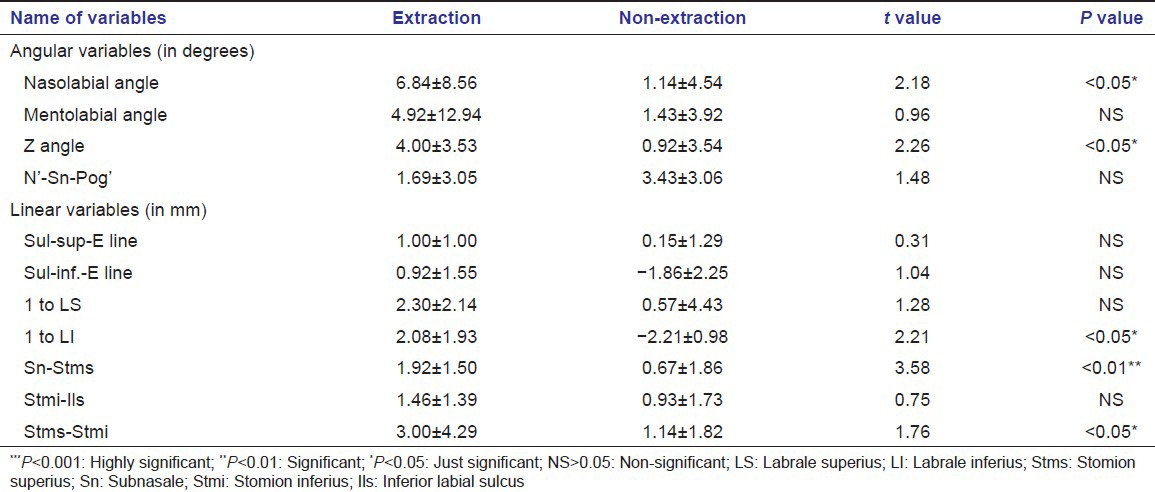
Table 4.
Extraction versus non-extraction (intergroup comparison of changes in group 1 and group 2): Descriptive and inferential statistics of mean value differences:Soft-tissue analysis post-treatment result
Discussion
Attaining (or maintaining) general harmony and balance among the various facial features by predicting the individual response to treatment becomes part of an orthodontist's responsibility.
The main purpose of the study was to compare soft-tissues profile changes occurring in Class II Division 1 patients treated orthodontically with premolar extraction with those occurring in Class II Division 1 patients treated without extraction. Chosen sample was divided in the groups on basis of patients where extractions were considered necessary and another similar sample, where reasonable doubt existed as to whether or not to perform extractions. In this latter group a more conservative treatment approach was adopted.
The decision to extract the premolar was based on the fact that how to resolve the tooth size-arch length discrepancy and assessing the final pre-determined position of the mandibular incisors without appreciable expansion of the lower arch. The maxillary incisors were supposed to be positioned in a proper relationship with the mandibular incisors.[11]
The change in the soft-tissue profile caused by tooth movement has distinct characteristics which cannot be calculated or easily described in a formula. Facial soft-tissue configuration may be as variable as malocclusion itself. Changes observed in the morphological characteristics of the soft-tissues of patients treated with extractions and non-extraction following active treatment is shown in Tables 2 and 3.
Significant mean increase [Figure 4] was observed for nasolabial angle and Z angle thus making the profile straighter and pleasing. Increase in these angles can be related to upper incisor retraction. According to Drobocky and Smith[2] normal range for nasolabial angle was between 90° and 120° with a desirable value of approximately 100-105°. This was supported by Talass et al.;[12] and Finnoy et al.[13] James[14] uses Merrifield's ‘Z’ angle to quantity and compare the pre-treatment and post-treatment profiles of the extraction and non-extraction groups used in their study and found an increase of about 6° in the value of ‘Z’ angle in extraction group. Finnoy et al.[13] observed mean changes of 6.5° for the nasolabial angle, −3.3 mm for LS to E line and −2.5 mm for LI to E line. These changes are almost close to values reported in Table 2.
Figure 4.
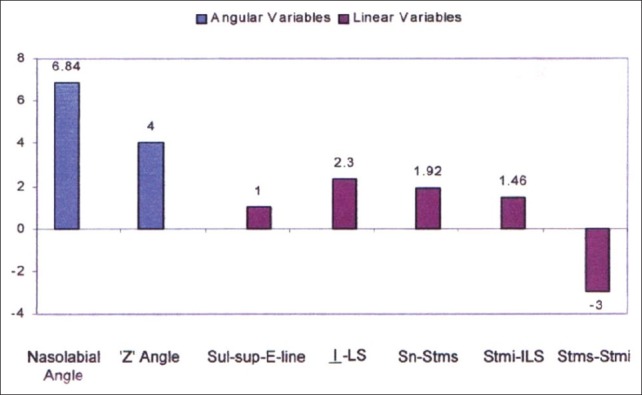
Significant post-treatment changes for soft-tissue variables in extraction group plotted on bar diagram
Findings were also in accordance with Bravo[15] who revealed that sulcus superior and sulcus inferior moved back an average of 1.6 and 2.3 mm to E line respectively. The pre-treatment position and thickness of the lip as well as the initial maxillo-mandibular skeletal relationship may be predictors of post-treatment lip position suggesting changes in the lower facial profile.
Maxillary central incisor-LS (upper lip thickness) also increased 2.30 mm following treatment. Anderson et al.[16] reported a similar finding. Ricketts reported that upper lip thickened 1 mm with 3 mm of retraction of upper incisors.
Increase in vertical lip height, is observed in this group. increase in upper lip height was about 1.92 mm while lower lip height increase was 1.46 mm that is supported by study of Abdel Kader.[17] He said vertical lip height increases with treatment but the increase is statistically insignificant at the one present level and it is significantly dependent on the reduction in over jet.
About 3 mm decrease in interlabial gap was found to be influenced uniformly by retraction of maxillary incisors. Jacobs[18] gave a similar finding and said that decrease in interlabial gap can be predicted by retraction and intrusion of maxillary incisors.
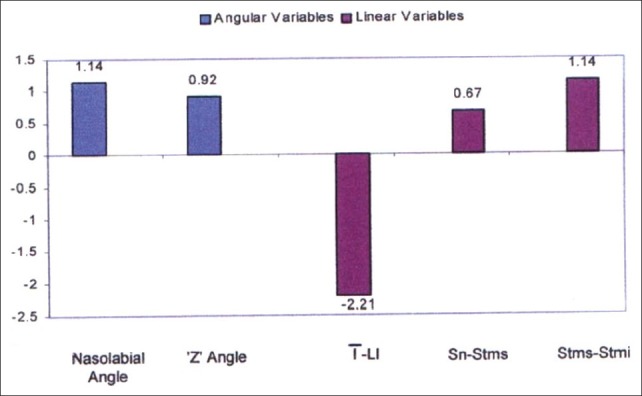
In non-extraction group [Figure 5] decrease in lower lip thickness was about 2 mm and this was due to protrusion of lower incisors. Change in vertical height of upper and lower lip was found to be statistically significant in this group. However, this is a matter of controversy and described previously.
Figure 5.
Significant post-treatment changes for soft-tissue variables in non-extraction group plotted on bar diagram
Interlaibal gap reduction was less significant. This finding is based on the facts that upper lip retraction occurred and lip strain was eliminated. Jacobs[18] and Talass et al.[12] also reported decrease in interlabial gap following retraction of maxillary incisors.
Prominence of lower lip was increased due to decrease in linear distance between -LI by about 1.86 mm, which is due to mild proclination of lower incisors in attempt to relieve the crowding in non-extraction group. Saelens and Smit[19] and Finnoy et al.[13] in their study found nasolabial angle was increased in extraction group, but the less pronounced mean increase in the non-extraction group was not significant same as in present study.
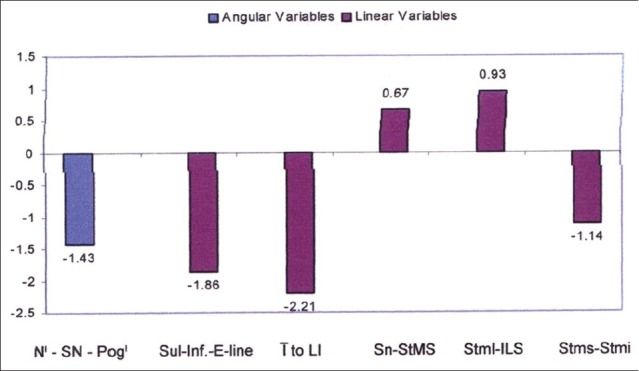
When comparison was made between extraction and non-extraction groups [Table 4, Figure 6] improvement in nose, lip, chin relationship depicted by increase in ‘Z’ angle is found to be more in extraction group (about 4°) than non-extraction group (0.92°). Findings are supported by James,[14] Saelens and Smit[19] and Finnoy et al.[13] who reported that non-extraction group completed treatment with a slightly more protrusive lip profile position than did the extraction group. Linear distance between mandibular incisormandibular incisor to LI was found to be increased in extraction group 2.08 mm, while it decreases in non-extraction group (2.21 mm). Zierhut et al.[20] and noted greater lower lip retraction relative to the esthetic plane in the extraction sample of study. Caplan and Shivpuja[21] supported the present finding and found decrease in upper and lower lip thickness during non-extraction. When profile changes from pre-treatment to post-treatment were examined, significant differences in treatment-associated changes between extraction and non-extraction groups were all related to the lower lip and chin.[22] Bowman and Johnston concluded extraction treatment producing improved facial esthetics for those patients who present with some combination of crowding and protrusion.[23]
Figure 6.
Comparison of significant soft-tissue changes between extraction and non-extraction group plotted on bar diagram
Increase in upper lip length (Sn-Stms) was found to be more in extraction group. Rains and Nanda[24] stated that upper lip response was related to both upper and lower incisor movement, mandibular rotation and lower lip. Burstone[25] and Hersery[26] proposed that the perioral soft-tissue may be self-supporting and factors other than dental movement may cause wide variability of individual response.
Decrease in interlabial gap is also more pronounced in extraction group than non-extraction group. The variable is found to be influenced uniformly by a retraction of maxillary incisors. Jacobs[18] presented a similar finding and stated decrease in inter labial gap can be predicted by retraction and intrusion of maxillary incisors, which is obviously more in extraction group. Harmony in lip posture is found by the balance of soft-tissue thickness over the skeletal framework. Yogosawa[27] stated when observing closure of the interlabial gap it is interesting to note that lower lip requires four times the upper lip movement.
Although extraction mechanotherapy has often been associated with flattening of the facial profile, the results achieved in this study showed no significant difference in lip position of premolar extraction patients when compared with those cases treated without extractions, signifying that both treatment modalities finished within the same soft-tissue parameters. Similar observations have been reported by different authors.[4,22,23,28]
Although the premolar extraction group showed greater soft-tissue changes with treatment, post-treatment comparisons showed that both groups finished within the same soft-tissue parameters.[29] The absence of significant differences between the changes in both groups could be explained by the small to moderate Class II malocclusion severity.[30]
Initial and post-treatment profiles for both groups were superimposed according to Rickett's method and found no significant difference in the post-treatment profiles [Figures 7 and 8]. According to Ricketts, a distance of −3·0 mm to ±2·0 mm from the lower lip to the E line should be considered normal in 15-year-olds. Most of patients started with satisfactory profile and after being treated with extractions or without extractions in order to enhance health and stability, the profiles were still satisfactory.
Figure 7.
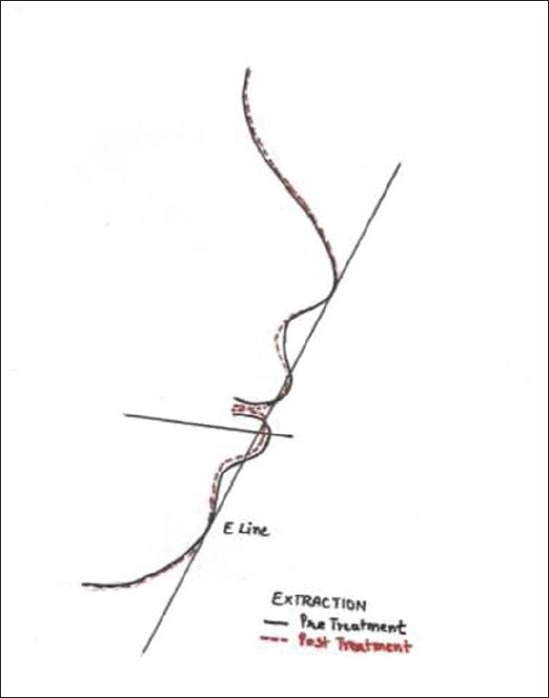
An example of the pre-treatment and post-treatment profile superimposition selected randomly from the extraction sample
Figure 8.
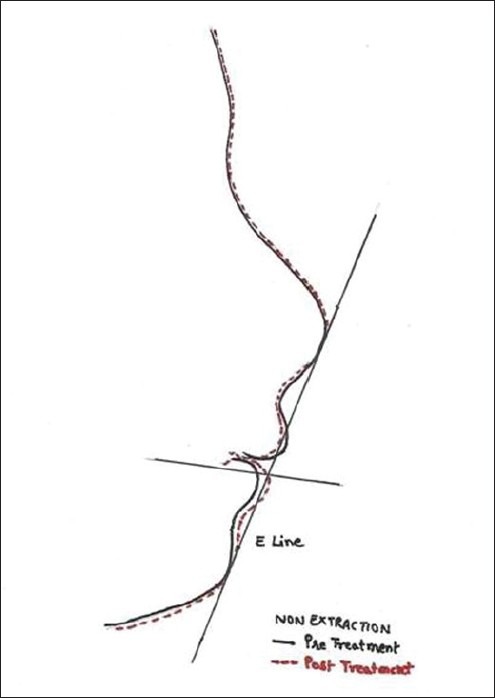
An example of the pre-treatment and post-treatment profile superimposition selected randomly from the nonextraction sample
These comparisons suggest that the extraction or non-extraction decision, if based on sound diagnostic criteria, seem to have no systematic detrimental effects on the facial profile. Satisfactory results can be obtained consistently either by extracting premolar or without extracting them. Yet clinicians should be aware of the observed changes during treatment planning of individual patients to creating any undesirable esthetic characteristics. It also needs to be remembered that the clinician's judgment is influenced by other factors including the severity of tooth size-arch length discrepancies as well as the diagnostic, mechanical and esthetic biases of each orthodontist.
Conclusion
Lip protrusion is an important pre-treatment profile characteristic that influences the extraction decision in addition to the presence of a tooth size-arch length discrepancy
After treatment, it was observed that (a) the soft-tissue convexities was straighter in extraction groups more than in the non-extraction groups; (b) the upper and lower lips were more retrusive in the extraction groups as compared to non-extraction groups. However, the mean finished profile assessment for both the groups fell within the pleasing normal range as measured by E line.
Footnotes
Source of Support: Nil
Conflict of Interest: None declared
References
- 1.Proffit WR, Fields HW, Jr, Moray LJ. Prevalence of malocclusion and orthodontic treatment need in the United States: Estimates from the NHANES III survey. Int J Adult Orthodon Orthognath Surg. 1998;13:97–106. [PubMed] [Google Scholar]
- 2.Drobocky OB, Smith RJ. Changes in facial profile during orthodontic treatment with extraction of four first premolars. Am J Orthod Dentofacial Orthop. 1989;95:220–30. doi: 10.1016/0889-5406(89)90052-8. [DOI] [PubMed] [Google Scholar]
- 3.Paquette DE, Beattie JR, Johnston LE., Jr A long-term comparison of nonextraction and premolar extraction edgewise therapy in “borderline” Class II patients. Am J Orthod Dentofacial Orthop. 1992;102:1–14. doi: 10.1016/0889-5406(92)70009-Y. [DOI] [PubMed] [Google Scholar]
- 4.Young TM, Smith RJ. Effects of orthodontics on the facial profile: A comparison of changes during nonextraction and four premolar extraction treatment. Am J Orthod Dentofacial Orthop. 1993;103:452–8. doi: 10.1016/S0889-5406(05)81796-2. [DOI] [PubMed] [Google Scholar]
- 5.Bishara SE, Cummins DM, Jakobsen JR, Zaher AR. Dentofacial and soft tissue changes in Class II, division 1 cases treated with and without extractions. Am J Orthod Dentofacial Orthop. 1995;107:28–37. doi: 10.1016/s0889-5406(95)70154-0. [DOI] [PubMed] [Google Scholar]
- 6.Peck H, Peck S. A concept of facial esthetics. Angle Orthod. 1970;40:284–318. doi: 10.1043/0003-3219(1970)040<0284:ACOFE>2.0.CO;2. [DOI] [PubMed] [Google Scholar]
- 7.Peck S, Peck L. Selected aspects of the art and science of facial esthetics. Semin Orthod. 1995;1:105–26. doi: 10.1016/s1073-8746(95)80097-2. [DOI] [PubMed] [Google Scholar]
- 8.Proffit WR. Forty-year review of extraction frequencies at a university orthodontic clinic. Angle Orthod. 1994;64:407–14. doi: 10.1043/0003-3219(1994)064<0407:FROEFA>2.0.CO;2. [DOI] [PubMed] [Google Scholar]
- 9.Burstone CJ. Lip posture and its significance in treatment planning. Am J Orthod. 1967;53:262–84. doi: 10.1016/0002-9416(67)90022-x. [DOI] [PubMed] [Google Scholar]
- 10.Jacobson A. Ilinios, USA, Chicago: Quintessence Publishing Co; 1995. Radographic Cephalometry: From Basics to Videoimagin; p. 31. [Google Scholar]
- 11.Boley JC, Pontier JP, Smith S, Fulbright M. Facial changes in extraction and nonextraction patients. Angle Orthod. 1998;68:539–46. doi: 10.1043/0003-3219(1998)068<0539:FCIEAN>2.3.CO;2. [DOI] [PubMed] [Google Scholar]
- 12.Talass MF, Talass L, Baker RC. Soft-tissue profile changes resulting from retraction of maxillary incisors. Am J Orthod Dentofacial Orthop. 1987;91:385–94. doi: 10.1016/0889-5406(87)90391-x. [DOI] [PubMed] [Google Scholar]
- 13.Finnoy JP, Wisth P, Boe OE. Changes in soft tissue profile during and after orthodontic treatment. Eur J Orthod. 1987;9:68–78. doi: 10.1093/ejo/9.1.68. [DOI] [PubMed] [Google Scholar]
- 14.James RD. A comparative study of facial profiles in extraction and nonextraction treatment. Am J Orthod Dentofacial Orthop. 1998;114:265–76. doi: 10.1016/s0889-5406(98)70208-2. [DOI] [PubMed] [Google Scholar]
- 15.Bravo LA. Soft tissue facial profile changes after orthodontic treatment with four premolars extracted. Angle Orthod. 1994;64:31–42. doi: 10.1043/0003-3219(1994)064<0031:STFPCA>2.0.CO;2. [DOI] [PubMed] [Google Scholar]
- 16.Anderson JP, Joondeph DR, Turpin DL. A cephalometric study of profile changes in orthodontically treated cases ten years out of retention. Angle Orthod. 1973;43:324–36. doi: 10.1043/0003-3219(1973)043<0324:ACSOPC>2.0.CO;2. [DOI] [PubMed] [Google Scholar]
- 17.Abdel Kader HM. Vertical lip height and dental height changes in relation to the reduction of overjet and overbite in Class II, Division 1 malocclusion. Am J Orthod. 1983;84:260–3. doi: 10.1016/0002-9416(83)90134-3. [DOI] [PubMed] [Google Scholar]
- 18.Jacobs JD. Vertical lip changes from maxillary incisor retraction. Am J Orthod. 1978;74:396–404. doi: 10.1016/0002-9416(78)90061-1. [DOI] [PubMed] [Google Scholar]
- 19.Saelens NA, De Smit AA. Therapeutic changes in extraction versus non-extraction orthodontic treatment. Eur J Orthod. 1998;20:225–36. doi: 10.1093/ejo/20.3.225. [DOI] [PubMed] [Google Scholar]
- 20.Zierhut EC, Joondeph DR, Artun J, Little RM. Long-term profile changes associated with successfully treated extraction and nonextraction Class II Division 1 malocclusions. Angle Orthod. 2000;70:208–19. doi: 10.1043/0003-3219(2000)070<0208:LTPCAW>2.0.CO;2. [DOI] [PubMed] [Google Scholar]
- 21.Caplan MJ, Shivapuja PK. The effect of premolar extractions on the soft-tissue profile in adult African American females. Angle Orthod. 1997;67:129–36. doi: 10.1043/0003-3219(1997)067<0129:TEOPEO>2.3.CO;2. [DOI] [PubMed] [Google Scholar]
- 22.Xu TM, Liu Y, Yang MZ, Huang W. Comparison of extraction versus nonextraction orthodontic treatment outcomes for borderline Chinese patients. Am J Orthod Dentofacial Orthop. 2006;129:672–7. doi: 10.1016/j.ajodo.2005.12.007. [DOI] [PubMed] [Google Scholar]
- 23.Bowman SJ, Johnston LE., Jr The esthetic impact of extraction and nonextraction treatments on Caucasian patients. Angle Orthod. 2000;70:3–10. doi: 10.1043/0003-3219(2000)070<0003:TEIOEA>2.0.CO;2. [DOI] [PubMed] [Google Scholar]
- 24.Rains MD, Nanda R. Soft-tissue changes associated with maxillary incisor retraction. Am J Orthod. 1982;81:481–8. doi: 10.1016/0002-9416(82)90427-4. [DOI] [PubMed] [Google Scholar]
- 25.Burstone CJ. The integumental profile. Am J Orthod. 1958;44:1–25. [Google Scholar]
- 26.Hershey HG. Incisor tooth retraction and subsequent profile change in postadolescent female patients. Am J Orthod. 1972;61:45–54. doi: 10.1016/0002-9416(72)90175-3. [DOI] [PubMed] [Google Scholar]
- 27.Yogosawa F. Predicting soft tissue profile changes concurrent with orthodontic treatment. Angle Orthod. 1990;60:199–206. doi: 10.1043/0003-3219(1990)060<0199:PSTPCC>2.0.CO;2. [DOI] [PubMed] [Google Scholar]
- 28.Basciftci FA, Usumez S. Effects of extraction and nonextraction treatment on class I and class II subjects. Angle Orthod. 2003;73:36–42. doi: 10.1043/0003-3219(2003)073<0036:EOEANT>2.0.CO;2. [DOI] [PubMed] [Google Scholar]
- 29.Khan M, Fida M. Soft tissue profile response in extraction versus non-extraction orthodontic treatment. J Coll Physicians Surg Pak. 2010;20:454–9. [PubMed] [Google Scholar]
- 30.Hayasaki SM, Castanha Henriques JF, Janson G, de Freitas MR. Influence of extraction and nonextraction orthodontic treatment in Japanese-Brazilians with class I and class II division 1 malocclusions. Am J Orthod Dentofacial Orthop. 2005;127:30–6. doi: 10.1016/j.ajodo.2003.10.043. [DOI] [PubMed] [Google Scholar]