Abstract
The combined effects of future ocean acidification and global warming on the hypoxia thresholds of marine biota are, to date, poorly known. Here, we show that the future warming and acidification scenario led to shorter embryonic periods, lower survival rates and the enhancement of premature hatching in the cuttlefish Sepia officinalis. Routine metabolic rates increased during the embryonic period, but environmental hypercapnia significantly depressed pre-hatchling's energy expenditures rates (independently of temperature). During embryogenesis, there was also a significant rise in the carbon dioxide partial pressure in the perivitelline fluid (PVF), bicarbonate levels, as well as a drop in pH and oxygen partial pressure (pO2). The critical partial pressure (i.e. hypoxic threshold) of the pre-hatchlings was significantly higher than the PVF oxygen partial pressure at the warmer and hypercapnic condition. Thus, the record of oxygen tensions below critical pO2 in such climate scenario indicates that the already harsh conditions inside the egg capsules are expected to be magnified in the years to come, especially in populations at the border of their thermal envelope. Such a scenario promotes untimely hatching and smaller post-hatching body sizes, thus challenging the survival and fitness of early life stages.
Keywords: hypoxia, ocean acidification, global warming, critical oxygen partial pressures, early life stages, cephalopods
1. Introduction
Global temperature is rising at a rate unprecedented in the experience of modern human society and expected to increase between 3°C and 6°C by 2100 [1], which is predicted to dictate deleterious temperature-mediated physiological responses at organism level [2–4]. At community level, profound impacts on phenology, diversity and biogeography are also likely to occur [5–7]. In coastal areas, many organisms already live close to their thermal tolerance limits [8,9] and ocean warming will negatively impact their performance and survival. Moreover, since the industrial revolution, [CO2]atm has increased from 280 ppm to levels now exceeding 380 ppm [10] and is expected to rise to 730–1020 ppm by the year 2100 [1]. Carbon dioxide reacts with seawater resulting in a net increase in the concentrations of H+ (lowered pH), H2CO3 and HCO3− while decreasing CO32−. This process, termed ocean acidification, is projected to decrease the pH of surface waters between 0.14 and 0.5 units, depending on emission scenario, by the end of the twenty-first century [1]. These future changes in the ocean's chemistry are expected to pose particular problems for key calcifying organisms [11,12]. Yet, elevated CO2 has also been shown to have detrimental effects on the survival, growth and respiratory physiology of marine animals more broadly [2,13,14] (but also see [15]). Concomitantly, in the past few decades, marine hypoxia has also become one of the major ecological concerns in the world [16], because of the: (i) increase of excessive anthropogenic input of nutrients and organic matter into coastal ecosystems, especially in estuaries and semi-enclosed seas, and (ii) climate-related expansion of oceanic-oxygen-minimum zones that can cause upwelling-driven shelf hypoxia [17,18]. Low oxygen episodes lead to major losses in local biodiversity, with extreme hypoxia causing the so-called dead-zones devoid of higher marine life. Non-migrating organisms surviving in hypoxia usually experience sublethal physiological stresses followed by reduced growth and reproductive potential [16,19]. Moreover, early life stages are assumed to be more sensitive to oxygen stress than older life stages [20], but while most research has been conducted on the latter stages, the former are expected to be more vulnerable to these new climate-change-related conditions. Ultimately, oxygen stress promoted by shifting climate conditions may constitute a major bottleneck for species survival.
The combined effects of temperature and elevated CO2 on hypoxic thresholds of marine biota are, to date, poorly known. Here, we report the oxygen thresholds for hypoxia (critical pO2) in the early stages (developing/intermediate embryos and pre-hatchlings) of the common cuttlefish (Sepia officinalis) acclimated to the environmental hypercapnia (0.16% CO2, approx. 1600 ppmv; ΔpH = 0.5) and warming (+4°C) as expected for the end of this century. Besides the quantification of routine metabolic rates (RMRs) and thermal sensitivity (Q10 values), we also evaluated the abiotic conditions (pH, pCO2, pO2, [HCO3−]) inside the egg capsules (i.e. in the perivitelline fluid, PVF).
2. Material and methods
(a). Egg collection and incubation
Recently spawned, stage I [21], egg masses of common cuttlefish (S. officinalis) were collected, between August and October 2012, in Caldeira de Tróia, a shallow water habitat near the mouth of the Sado estuary (38°29′18.42″ N; 8°53′15.12″ O), in the west coast off Portugal. After collection, eggs were immediately transferred to the aquaculture facilities in Laboratório Marítimo da Guia, Cascais. It is worth noting that the Portuguese western coast is situated in the Western Iberian Upwelling Ecosystem (and the northern limit of the Canary Current Upwelling System), one of the four major eastern boundary currents of the world, and pCO2 levels may reach up to approximately 500 ppm [22,23]. Consequently, in these regions, the future pCO2 levels are expected to exceed the forecasted 1000–1200 ppm (ΔpH = 0.4–0.5) for 2100 [1]. To understand the physiological mechanisms by which early ontogenetic stages may (or may not) be able to withstand future ocean changes, the eggs were acclimated until pre-hatching at: (i) rising pCO2 (ΔpH = 5.0; 0.16% CO2, approx. 1600 ppmv), and (ii) ocean warming expected in 2100 [1], 4°C above the average temperature of the main period of the spawning season (18°C) of the common cuttlefish, S. officinalis, in the western coast of Portugal.
Egg masses were placed in 12 life support systems (100 egg capsules per system; 400 l each) that were replenished daily with 100 l of fresh seawater to maintain total alkalinity and dissolved inorganic carbon speciation owing to bacterial activity (i.e. nitrifiers, denitrifiers) and acidification of the treatments (two of four). The semi-closed systems were filled with 1-µm and UV-irradiated filtered seawater, with the tanks being illuminated from above with white fluorescent lamps under a photoperiod of 14 L : 10 D cycle. Water quality was ensured using wet–dry filters (bioballs), protein skimmers (Schuran, Jülich, Germany) and 30 W UV-sterilizers (TMC, Chorleywood, UK). Ammonia and nitrite were monitored regularly and kept below detectable levels. pH was adjusted automatically, via solenoid valves, with the Profilux controlling system (Kaiserslautern, Germany) connected to individual pH probes. pH values were monitored every 2 s and lowered by injection of a certified CO2 gas mixture (Air Liquid, Portugal) via air stones or upregulated by aerating the tanks with CO2 filtered (using soda lime, Sigma-Aldrich) air. Additionally, pH values were manually controlled (daily) showing average values in the range of 8.1 ± 0.1 and 7.5 ± 0.1, respectively. Salinity throughout the experiment was 35.0 ± 1.0, and temperatures (18.0 ± 0.2°C and 22.0 ± 0.2°C) were regulated via Hailea chillers (Guangdong, China).
Seawater carbonate system speciation was calculated weekly from total alkalinity according to Sarazin et al. [24] (spectrophometrically at 595 nm) and pH measurements. pH was quantified via a Metrohm pH meter (826 pH mobile, Metrohm, Filderstadt, Germany) connected to a glass electrode (Schott IoLine, SI analytics, ±0.001) and calibrated against the seawater buffers Tris–HCl (Tris) and 2-aminopyridine–HCl (Mare, Liège, Belgium) according to Dickson et al. [25]. Measurements were performed under temperature-controlled conditions using a water bath (Lauda, Germany, ±0.1°C). Bicarbonate and pCO2 values were calculated using the CO2SYS software [26], with dissociation constants from Mehrbach et al. [27] as refitted by Dickson & Millero [28].
For each temperature and pH, 65 embryos were screened for survival rates, development time and premature hatchling. Regarding the latter, it was defined as newborn juveniles that hatched with the yolk sac still attached or detached inside egg capsule.
(b). pH, bicarbonate, pCO2 and pO2 levels
To assess the conditions (pH, bicarbonate, pCO2 and pO2) prevailing in the intermediate embryonic (ranging from 0.011 to 0.023 g; equivalent to stages XI–XV in [21]) and pre-hatching stages (ranging from 0.039 to 0.092 g; equivalent to stages XVIII–XIX in [21]) of the common cuttlefish, PVF was withdrawn using a gas-tight Hamilton syringe (500 µl, Switzerland) and disposable needles. pH of the PVF was quantified at ambient temperatures (18°C or 22°C, respectively; water bath, Lauda, Germany, ±0.1°C) using a microelectrode (WTW Mic-D) connected to a WTW pHi 340 pH meter (precision ± 0.01 units) that was calibrated with radiometer precision buffers 7 and 10 (S11M44, S11M007). Total dissolved inorganic carbon was determined in duplicates (50 µl each) via a Corning 965 carbon dioxide analyser (precision ± 0.1 mmol l−1; Olympic Analytical Service, UK) that was calibrated by generating a sodium bicarbonate (Fluka, Germany) standard curve. Carbonate system speciation (pCO2 and bicarbonate) was calculated from pH and total dissolved inorganic carbon measurements using CO2SYS software [26], with dissociation constants from Mehrbach et al. [27] as refitted by Dickson & Millero [28]. The seawater carbonate chemistry data for the different climate change scenarios are shown in the electronic supplementary material, table S1.
Oxygen tension was measured by injecting a 75 ml sample of PVF into a micro-respirometry chamber (Strathkelvin MC100 Microcell) connected to a Clarke-type O2 electrode (Strathkelvin SI130 microcathode oxygen electrode) maintained at the experimental temperature and calibrated to air- and nitrogen-saturated seawater [29]. The oxygen sensor was connected to a multi-channel oxygen interface (Strathkelvin, 929, six-channel oxygen system).
(c). Routine metabolic rates and thermal sensitivity
Oxygen consumption measurements (RMRs) were determined according to Rosa et al. [3,30]. Intermediate embryonic stages and pre-hatchings were incubated in sealed water-jacketed respirometry chambers (RC300 respiration cell, Strathkelvin, North Lanarkshire, UK) containing filtered seawater mixed with antibiotics (50 mg l−1 streptomycin) to avoid bacterial respiration. Water volumes were adjusted in relation to animal mass (up to 4 ml) in order to minimize locomotion and stress. Concomitantly, bacterial controls were conducted to correct for possible bacterial respiratory activity. Respiration chambers were placed in water baths (Lauda, Lauda-Königshofen, Germany) to control temperature. Oxygen concentrations were recorded with Clarke-type O2 electrodes connected to a multi-channel oxygen interface (Strathkelvin). The duration of respiratory runs varied from 6 to 12 h.
Thermal sensitivity (Q10) was determined using the standard equation:
| 2.1 |
where R(T2) and R(T1) represent the oxygen consumption rates at temperatures T2 and T1, respectively.
(d). Critical oxygen partial pressures
The external critical oxygen partial pressures (Pc,ext; the point at which the rate of oxygen consumption was no longer maintained independent of ambient oxygen partial pressure) were determined by plotting specific rates of oxygen consumption against oxygen partial pressure. Regressions were calculated for the two distinct sections of the curve, the regulated (higher pO2) segment and the very sloped (low pO2) segment. Pc was defined as the point where the two regressions intersected [31].
The internal critical oxygen partial pressures (Pc,in) were estimated based on the diffusion model proposed by Cronin & Seymour [32] for the giant cuttlefish Sepia apama. Briefly, it is known that the oxygen diffusion is determined by a partial-pressure gradient between the external (pO2,ext) and internal (pO2,in) environments of the egg, and it is driven by oxygen consumption (here as RMR) and the conductance of the capsule (GO2). Thus, according to these authors, the embryo's oxygen uptake may be described by the Fick equation: RMR = GO2 × (pO2,ext − pO2,in).
GO2 depends on the effective surface area (ESA) of the capsule, its thickness (X) and Krogh's oxygen-diffusion coefficient in water—the product of diffusitivity (1/7500 of that in air) and capacitance (1/30 of that in air). To determine ESA (the mean of the inner and outer radii of each capsule, see equation 3 in [32], p. 864) and X, the embryo capsules (exposed to 18°C pH 8.0, and 22°C pH 8.0) were measured under a microscope. Unfortunately, we could not undertake this task in the four treatments, namely in the high CO2 ones, and therefore, in our Pc,in estimations we assumed that both ESA and X-values did not change from normocapnia (ESA: 1.2 ± 0.8 cm2 at intermediate stages and 3.5 ± 1.3 cm2 at hatchling stage; X-values: 0.6 ± 0.1 mm at intermediate stages and 0.1 ± 0.0 mm at pre-hatching stage) to hypercapnia.
(e). Statistical analyses
Two-way ANOVAs were conducted to detect significant differences in RMRs, oxygen thresholds for hypoxia (i.e. critical pO2, Pc), pH, pCO2, pO2 and HCO3− between the different climate change scenarios and development stages (intermediate embryonic stages and pre-hatchings) of common cuttlefish S. officinalis. Subsequently, Tukey post-hoc tests were performed. All values are expressed as means ± s.d. All statistical analyses were performed for a significance level of 0.05, using Statistica v. 10.0 software (StatSoft Inc., Tulsa, USA).
3. Results
Embryonic survival rates of the common cuttlefish (S. officinalis) were significantly affected by temperature and pH (p < 0.05; figure 1a). Although at 18°C there was no differences between the normocapnic and hypercapnic treatments (93.7% and 90.3%, respectively; p > 0.05), the future warming and acidification scenarios led to significantly lower survival (p < 0.05, 31.8%). Regarding development time, and as expected, temperature significantly decreased the embryonic period, from 48–49 days at 18°C to 32–34 days at 22°C (p < 0.05). Yet, pH did not elicit any significant change (p > 0.05). Premature hatching increased significantly from present-day conditions (35.2% at pH 8.0 and 41.0% at pH 7.5) to the future warming and acidification scenario (22°C pH 7.5; p < 0.05; figure 1c), reaching 100%, i.e. all newborn juveniles still had unconsumed yolk inside the egg capsule.
Figure 1.
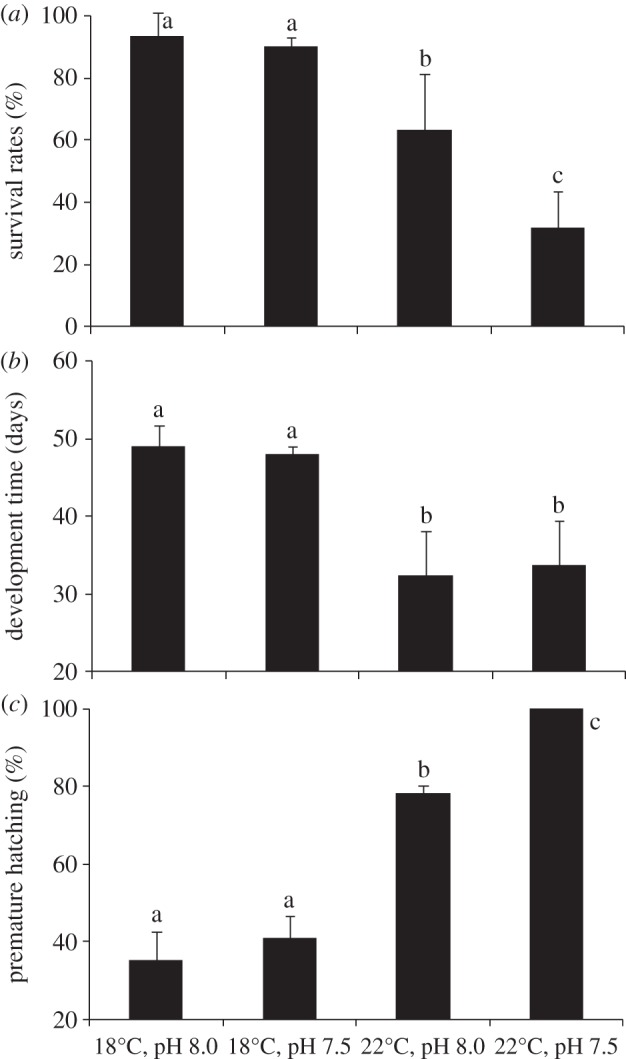
Effect of hypercapnia (ΔpH = 0.5) and warming (+4°C) on the: (a) survival rates (%); (b) embryonic development time (days); and (c) premature hatching (%) in the common cuttlefish Sepia officinalis. Values represent the mean ± s.d. Different letters represent significant differences between treatments (p < 0.05).
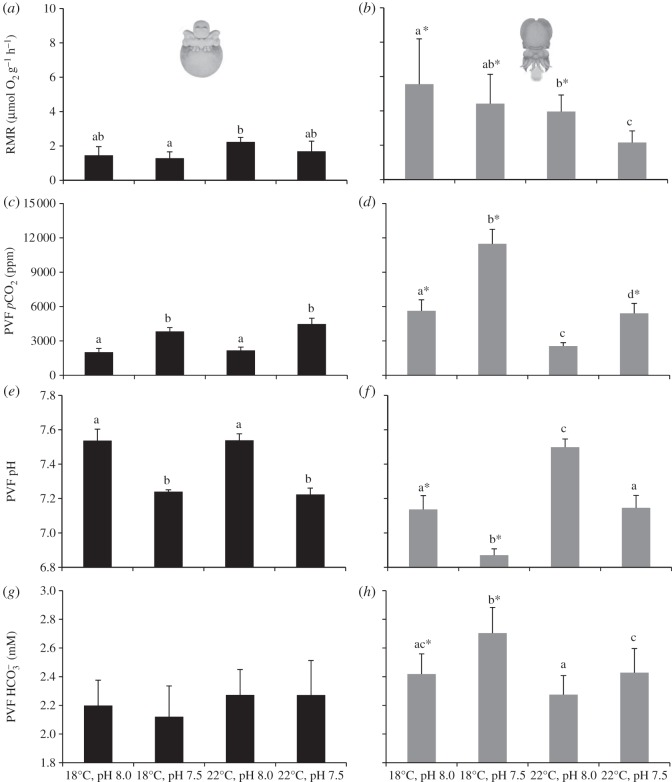
The RMRs also rose significantly during the embryogenesis (p < 0.05, figures 2a,b and 3). At the intermediate embryonic stages, RMR ranged between 1.3 (18°C, pH 7.5) and 2.2 µmol g−1 h−1 (22°C, pH 8.0), and at pre-hatchling stage ranged between 2.2 (22°C, pH 7.5) and 5.6 µmol g−1 h−1 (18°C, pH 8.0). It is noteworthy that high CO2 significantly lower pre-hatchings RMR independently of temperature (p < 0.05; figure 2b). Regarding the thermal sensitivity data, the embryos' Q10 values ranged around 2 and 3 at the intermediate stage and below 1 at the pre-hatching stage, which was indicative of metabolic depression (figure 4). With the increase in energy expenditure rates throughout embryogenesis, there was a significant rise in PVF pCO2 (p < 0.05, figure 2c,d) and HCO3− (p < 0.05, figure 2g,h), as well as a drop in pH (p < 0.05, figure 2e,f), especially at 18°C. More specifically, at the intermediate embryonic stages, PVF pCO2 ranged between 2020.5 (18°C, pH 8.0) and 4478.6 ppm (22°C, pH 7.5), and at pre-hatching stage ranged between 2546.5 (22°C, pH 8.0) and 11 476.8 ppm (18°C, pH 8). Regarding PVF HCO3−, the values ranged between 2.2 (18°C, pH 8.0) and 2.3 mM (22°C, pH 7.5; p > 0.05) in intermediate stages, and between 2.3 (22°C, pH 8.0) and 2.7 mM (18°C, pH 7.5; p < 0.05) in pre-hatchings. The drop in pH was more noticeable at the pre-hatching stage, ranging from 6.9 (18°C, pH 7.5; p < 0.05) and 7.5 (22°C, pH 8.0; p < 0.05).
Figure 2.
Effect of hypercapnia (ΔpH = 0.5) and warming (+4°C) on the: (a,b) routine metabolic rates (RMR, μmol O2 h−1 g−1 wet weight; n = 20); (c,d) pCO2 in the PVF (ppm; n = 20); (e,f) pH (n = 20); and (g,h) HCO3− (mM; n = 20) and in the PVF of intermediate embryonic (a,c,e,g) and pre-hatching (b,d,f,h) stages of common cuttlefish Sepia officinalis. Values represent the mean ± s.d. Different letters represent significant differences between treatments (p < 0.05). Asterisks represent significant differences between life stages (p < 0.05).
Figure 3.
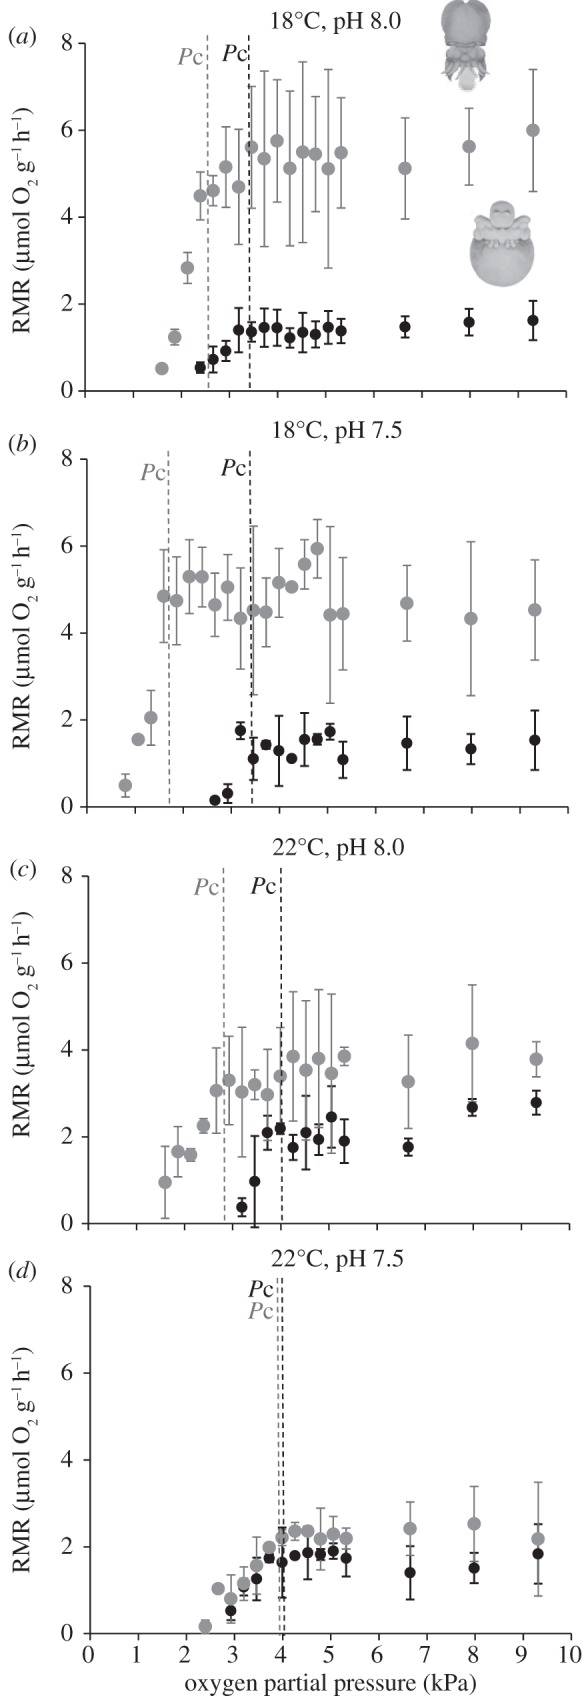
(a–d) Effect of hypercapnia (ΔpH = 0.5) and warming (+4°C) on the mass-specific routine metabolic rates (RMR, μmol O2 h−1 g−1 wet weight) averaged over 2-min intervals as a function of available oxygen (mmHg) in intermediate embryonic stages (black circles) and pre-hatchlings (grey circles) of common cuttlefish Sepia officinalis. Values represent the mean ± s.d. of the 20 individual runs.
Figure 4.
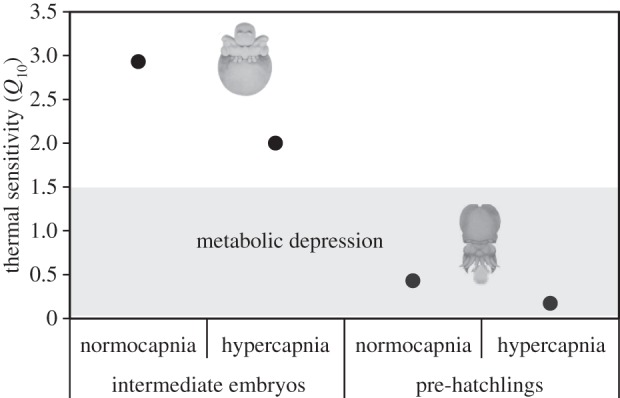
Effect of hypercapnia (ΔpH = 0.5) on the thermal sensitivity (Q10; between 18°C and 22°C) of intermediate embryonic stages (left-hand side panels) and pre-hatchlings (right-hand side panels) of common cuttlefish Sepia officinalis.
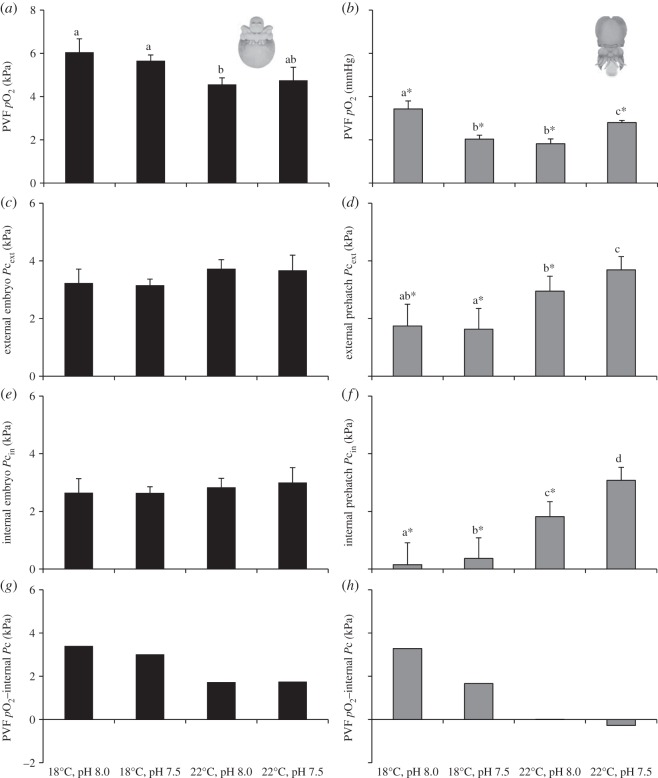
Additionally, pO2 decreased significantly throughout the embryonic development (p < 0.05; figure 5a,b). While pO2 ranged between 2.2 (22°C, pH 8.0) and 6.1 kPa (18°C, pH 8.0; p < 0.05) in intermediate stages, it ranged between 1.8 (22°C, pH 8.0) and 3.4 kPa in the more advanced ontogenetic stage (18°C, pH 8.0; p < 0.05). The external Pc (Pc,ext) of the intermediate embryos was fairly similar between all the treatments, varying non-significantly between 3.2 and 3.7 kPa (p > 0.05; figure 5c). On the other hand, the pre-hatchlings' Pc,ext were significantly lower than those observed for the intermediate embryos (except for the high CO2 and warming scenario; figure 5d), and increased significantly from 1.6 (at 18°C, pH 8.0) to 3.7 kPa (22°C, pH 7.5; p < 0.05). The estimated internal Pc (Pc,in) followed the same trend, i.e. it did not vary between treatments in intermediate stages (ranging between 2.6 and 3.0 kPa; p > 0.05; figure 5e), whereas the pre-hatchlings' Pc,in were significantly lower than those observed for the earlier stage (p < 0.05), and increased significantly from 0.15 (at 18°C, pH 8.0) to 3.1 kPa (22°C, pH 7.5; p < 0.05; figure 5f). Consequently, the Pc,in of the intermediate stages never reached higher than the partial pressure of the perivitelline space (figure 5g). A quite different situation occurred in the pre-hatching stage, because the Pc,in (hypoxic threshold) was higher than the PVF pO2 at the warmer and hypercapnic condition (negative value in figure 5h).
Figure 5.
Effect of hypercapnia (ΔpH = 0.5) and warming (+4°C) on the: (a,b) PVF pO2 (kPa, n = 20), (c,d) measured external (ambient) critical partial pressure (Pc,ext, kPa; n = 20), (e,f) estimated internal critical partial pressure (Pc,in, kPa; n = 20), and (g,h) difference between mean values of PVF pO2 and Pc,in (kPa), of intermediate embryonic stages (a,c,e,g) and pre-hatchlings (b,d,f,h) of common cuttlefish Sepia officinalis. Values represent the mean ± s.d. Different letters represent significant differences between treatments (p < 0.05). Asterisks represent significant differences between life stages (p < 0.05).
4. Discussion
As expected, the metabolic demand rose during embryogenesis, but the future warming scenario led to lower RMR at the pre-hatching stage. Temperature-independent metabolism [33] and hypoxia-related metabolic suppression [2] are well-known energy-conserving strategies in marine molluscs, but a heat induction of hypometabolism has rarely been described [34]. In this study, warming per se caused a notable metabolic depression in the pre-hatching stage (at pH 8.0–28.7%, p > 0.05; at pH 7.5–51.1%, p < 0.05). Based on thermal sensitivity data, we argue that the metabolic depression is a short-term method of extending the timeframe over which unfavourable conditions inside the egg can be withstood.
Cuttlefish embryos develop within egg capsules that act as physical protection and barrier to the diffusion of dissolved gases. During the present experiments, the eggs were swelling due to the entry of ambient water into the hypertonic PVF, with the eggshell becoming much thinner. Concomitantly, energy expenditure increased during development (e.g. for sustaining cellular growth, organogenesis and muscular activity) and led to a significant rise in PVF pCO2 and HCO3−, as well as a drop in pH, especially at 18°C. Such trends were less evident at 22°C possibly as a consequence of the hatchling's physiological strategy. Low pH or high CO2 are common triggers of metabolic depression [35], and themselves caused a significant metabolic drop in the pre-hatchlings (18°C, 20.4%, p > 0.05; 22°C, 45.4%, p < 0.05; figures 1b and 3).
Oxygen depletion within eggs was partially compensated for by egg swelling (i.e. increased surface area, reduced egg wall thickness; see a comprehensive examination of the subject in [32]) but it still did not prevent pO2 from consistently falling to potential critical levels. Low pO2 levels may also have contributed to the hypometabolic state as a possible consequence of the reduced capacity to extract oxygen at hypoxic and hypercapnic conditions within egg capsules [36]. In fact, the hatchlings acclimated to the warmer scenarios were exposed to low oxygen levels, similar to (at pH 8.0) or even below (at pH 7.5; figure 5h) the values observed for their critical pO2. The ability to live for limited time periods below Pc, via metabolic depression, has already been previously described for embryos [37] and older life stages [2,38], and is known to be accompanied by the reallocation of cellular energy to essential ATP demand processes as well as the transition of anaerobic metabolism [39]. Thus, with the decrease in pre-hatchlings' oxygen supply, metabolic processes could be partly shifted towards less efficient anaerobic processes [4,5].
One prevailing strategy used to achieve metabolic depression is reducing protein synthesis [40] and, consequently, growth. Although considered a sublethal reversible process, metabolic depression is only an effective adaptive strategy for the survival of short-term hypercapnia and hypoxia [40,41], but not advantageous under persistent elevations of CO2 [12,14]. Thus, we expect that the stressful abiotic conditions inside molluscan eggs will be aggravated with ocean acidification, warming and expanding hypoxia, especially in populations at the border of their thermal envelope [4]. These stressors may act together as a main trigger for premature hatching (as shown in figure 1c) and smaller post-hatching body sizes [3,42] and, consequently, dictate negative effects on survival and development of posterior ontogenetic stages. These effects may constrain species survival in such areas and, thereby, cause a shift on species' biogeographic range.
Funding statement
This research was supported by the Portuguese National Science Foundation (FCT PTDC/MAR/098066/2008, FCT PTDC/BIA-EC/103266/2008 and Programa Ciência 2007 to R.R.).
References
- 1.Meehl GA, et al. 2007. Global climate projections. In Climate change 2007: the physical science basis (eds Solomon S, Qin D, Manning M.), pp. 686–688 Cambridge, UK: Cambridge University Press [Google Scholar]
- 2.Rosa R, Seibel BA. 2008. Synergistic effects of climate-related variables suggest future physiological impairment in a top oceanic predator. Proc. Natl Acad. Sci. USA 105, 20 776–20 780 (doi:10.1073/pnas.0806886105) [DOI] [PMC free article] [PubMed] [Google Scholar]
- 3.Rosa R, Pimentel MS, Boavida-Portugal J, Teixeira T, Trübenbach K, Diniz MS. 2012. Ocean warming enhances malformations, premature hatching, metabolic suppression and oxidative stress in the early life stages of a keystone invertebrate. PLoS ONE 7, e38282 (doi:10.31371/journal.pone.0038282) [DOI] [PMC free article] [PubMed] [Google Scholar]
- 4.Pörtner HO, Knust R. 2007. Climate change affects marine fishes through the oxygen limitation of thermal tolerance. Science 315, 95–97 (doi:10.1126/science.1135471) [DOI] [PubMed] [Google Scholar]
- 5.Pörtner HO, Farrell AP. 2008. Physiology and climate change. Science 322, 690–691 (doi:10.1126/science.1163156) [DOI] [PubMed] [Google Scholar]
- 6.Somero G. 2010. The physiology of climate change: how potentials for acclimatization and genetic adaptation will determine ‘winners’ and ‘losers’. J. Exp. Biol. 213, 912–920 (doi:10.1242/jeb.037473) [DOI] [PubMed] [Google Scholar]
- 7.Pörtner HO. 2002. Climate change and temperature dependent biogeography: systemic to molecular hierarchies of thermal tolerance in animals. Comp. Biochem. Physiol. A 132, 739–761 [DOI] [PubMed] [Google Scholar]
- 8.Stillman JH, Somero GN. 2000. A comparative analysis of the upper thermal tolerance limits of eastern Pacific porcelain crabs, genus Petrolisthes: influences of latitude, vertical zonation, acclimation, and phylogeny. Physiol. Biochem. Zool. 73, 200–208 (doi:10.1086/316738) [DOI] [PubMed] [Google Scholar]
- 9.Helmuth B, Mieszkowska N, Moore P, Hawkins S. 2006. Living on the edge of two changing worlds: forecasting the responses of rocky intertidal ecosystems to climate change. Annu. Rev. Ecol. Evol. Syst. 37, 373–404 (doi:10.1146/annurev.ecolsys.37.091305.110149) [Google Scholar]
- 10.Petit JR, et al. 1999. Climate and atmospheric history of the past 420,000 years from the Vostok ice core, Antarctica. Nature 399, 429–436 (doi:10.1038/20859) [Google Scholar]
- 11.Orr JC, et al. 2005. Anthropogenic ocean acidification over the twenty-first century and its impact on calcifying organisms. Nature 437, 681–686 (doi:10.1038/nature04095) [DOI] [PubMed] [Google Scholar]
- 12.Fabry VJ, Seibel BA, Feely RA, Orr JC. 2008. Impacts of ocean acidification on marine fauna and ecosystem processes. ICES J. Mar. Sci. 65, 414–432 (doi:10.1093/icesjms/fsn048) [Google Scholar]
- 13.Seibel BA, Walsh PJ. 2001. Potential impacts of CO2 injection on deep-sea biota. Science 294, 319–320 (doi:10.1126/science.1065301) [DOI] [PubMed] [Google Scholar]
- 14.Pörtner HO, Langenbuch M, Reipschlager A. 2004. Biological impact of elevated ocean CO2 concentrations: lessons from animal physiology and earth history. J. Oceanogr. 60, 705–718 (doi:10.1007/s10872-004-5763-0) [Google Scholar]
- 15.Kroeker KJ, Kordas RL, Crim RN, Singh GG. 2010. Meta-analysis reveals negative yet variable effects of ocean acidification on marine organisms. Ecol. Lett. 13, 1419–1434 (doi:10.1111/j.1461-0248.2010.01518.x) [DOI] [PubMed] [Google Scholar]
- 16.Diaz RJ, Rosenberg R. 2008. Spreading dead zones and consequences for marine ecosystems. Science 321, 926–929 (doi:10.1126/science.1156401) [DOI] [PubMed] [Google Scholar]
- 17.Grantham BA, Chan F, Nielsen KJ, Fox DS, Barth JA, Huyer A, Lubchenco J, Menge BA. 2004. Upwelling-driven nearshore hypoxia signals ecosystem and oceanographic changes in the northeast Pacific. Nature 429, 749–754 (doi:10.1038/nature02605) [DOI] [PubMed] [Google Scholar]
- 18.Chan F, Barth JA, Lubchenco J, Kirincich A, Weeks H, Peterson WT, Menge BA. 2008. Emergence of anoxia in the California Current large marine ecosystem. Science 319, 920 (doi:10.1126/science.1149016) [DOI] [PubMed] [Google Scholar]
- 19.Vaquer-Sunyer R, Duarte CM. 2008. Thresholds of hypoxia for marine biodiversity. Proc. Natl Acad. Sci. USA 105, 15 452–15 457 (doi:10.1073/pnas.0803833105) [DOI] [PMC free article] [PubMed] [Google Scholar]
- 20.Levin LA, Ekau W, Gooday AJ, Jorissen F, Middelburg JJ, Naqvi SWA, Neira C, Rabalais NN, Zhang J. 2009. Effects of natural and human-induced hypoxia on coastal benthos. Biogeosciences 6, 2063–2098 (doi:10.5194/bg-6-2063-2009) [Google Scholar]
- 21.Naef A. 1928. Die cephalopoden. Fauna et Flora di Golfo del Napoli Monographia 35, 186–194 [Google Scholar]
- 22.Alvarez Salgado XA, Castro CG, Perez FF, Fraga F. 1997. Nutrient mineralization patterns in shelf waters of the Western Iberian upwelling. Cont. Shelf Res. 17, 1247–1270 (doi:10.1016/S0278-4343(97)00014-9) [Google Scholar]
- 23.Perez FF, Rios AF, Roson G. 1999. Sea surface carbon dioxide off the Iberian Peninsula (North Eastern Atlantic Ocean). J. Mar. Syst. 19, 27–46 (doi:10.1016/S0924-7963(98)00022-0) [Google Scholar]
- 24.Sarazin G, Michard G, Prevot F. 1999. A rapid and accurate spectroscopic method for alkalinity measurements in seawater samples. Water Res. 33, 290–294 (doi:10.1016/S0043-1354(98)00168-7) [Google Scholar]
- 25.Dickson A, Sabine C, Christian J. 2007. Guide to best practices for ocean CO2 measurements. PICES Spec. Publ. 3, 191 [Google Scholar]
- 26.Lewis E, Wallace DWR. 1998. CO2SYS-Program developed for the CO2 system calculations. Carbon Dioxide Inf Anal Center Report ORNL/CDIAC-105
- 27.Mehrbach C, Culberson C, Hawley J, Pytkowicz R. 1973. Measurement of the apparent dissociation constants of carbonic acid in seawater at atmospheric pressure. Limnol. Oceanogr. 18, 897–907 (doi:10.4319/lo.1973.18.6.0897) [Google Scholar]
- 28.Dickson A, Millero F. 1987. A comparison of the equilibrium constants for the dissociation of carbonic acid in seawater media. Deep-Sea Res. 34, 1733–1743 (doi:10.1016/0198-0149(87)90021-5) [Google Scholar]
- 29.Seibel BA, Dymowska A, Rosenthal J. 2007. Metabolic temperature compensation and coevolution of locomotory performance in pteropod molluscs. Integr. Comp. Biol. 47, 880–891 (doi:10.1093/icb/icm089) [DOI] [PubMed] [Google Scholar]
- 30.Rosa R, Trueblood L, Seibel BA. 2009. Ecophysiological influence on scaling of aerobic and anaerobic metabolism of pelagic gonatid squids. Physiol. Biochem. Zool. 82, 419–429 (doi:10.1086/591950) [DOI] [PubMed] [Google Scholar]
- 31.Rosa R, Seibel BA. 2010. Voyage of the argonauts in the pelagic realm: physiological and behavioural ecology of the rare paper nautilus, Argonauta nouryi. ICES J. Mar. Sci. 67, 1494–1500 (doi:10.1093/icesjms/fsq026) [Google Scholar]
- 32.Cronin ER, Seymour RS. 2000. Respiration of the eggs of the giant cuttlefish Sepia apama. Mar. Biol. 136, 863–870 (doi:10.1007/s002270000274) [Google Scholar]
- 33.Sokolova IM, Pörtner HO. 2001. Physiological adaptations to high intertidal life involve improved water conservation abilities and metabolic rate depression in Littorina saxatilis. Mar. Ecol. Prog. Ser. 224, 171–186 (doi:10.3354/meps224171) [Google Scholar]
- 34.Marshall DJ, McQuaid CD. 2011. Warming reduces metabolic rate in marine snails: adaptation to fluctuating high temperatures challenges the metabolic theory of ecology. Proc. R. Soc. B 278, 281–288 (doi:10.1098/rspb.2010.1414) [DOI] [PMC free article] [PubMed] [Google Scholar]
- 35.Guppy M, Withers P. 1999. Metabolic depression in animals: physiological perspectives and biochemical generalizations. Biol. Rev. 74, 1–40 (doi:10.1017/S0006323198005258) [DOI] [PubMed] [Google Scholar]
- 36.Gutowska MA, Melzner F. 2009. Abiotic conditions in cephalopod (Sepia officinalis) eggs: embryonic development at low pH and high pCO2. Mar. Biol. 156, 515–519 (doi:10.1007/s00227-008-1096-7) [Google Scholar]
- 37.Strathmann RR. 1985. Feeding and nonfeeding larval development and life-history evolution in marine invertebrates. Annu. Rev. Ecol. Syst. 16, 339–361 (doi:10.1146/annurev.es.16.110185.002011) [Google Scholar]
- 38.O'Dor RK, Forsythe J, Webber DM, Wells J, Wells MJ. 1993. Activity levels of Nautilus in the wild. Nature 362, 626–627 (doi:10.1038/362626a0) [Google Scholar]
- 39.Pörtner HO, Grieshaber MK. 1993. Critical pO2(s) in oxyconforming and oxyregulating animals: gas exchange, metabolic rate and the mode of energy production. In The vertebrate gas transport cascade: adaptations to environment and mode of life (ed. Bicudo JEPW.), pp. 330–357 Boca Raton, FL: CRC Press Inc [Google Scholar]
- 40.Storey KB, Storey JM. 2004. Oxygen limitation and metabolic rate depression. In Functional metabolism regulation and adaptation (ed. Storey KB.), pp. 415–442 Hoboken, NJ: John Wiley & Sons [Google Scholar]
- 41.Hochachka PW, Somero GN. 2002. Biochemical adaptation: mechanisms and process in physiological evolution. Oxford, UK: Oxford University Press [Google Scholar]
- 42.Kamler E. 2008. Resource allocation in yolk-feeding fish. Rev. Fish Biol. Fish 18, 143–200 (doi:10.1007/s11160-007-9070-x) [Google Scholar]


