Abstract
Bio-inspiration for novel adhesive development has drawn increasing interest in recent years with the discovery of the nanoscale morphology of the gecko footpad and mussel adhesive proteins. Similar to these animal systems, it was discovered that English ivy (Hedera helix L.) secretes a high strength adhesive containing uniform nanoparticles. Recent studies have demonstrated that the ivy nanoparticles not only contribute to the high strength of this adhesive, but also have ultraviolet (UV) protective abilities, making them ideal for sunscreen and cosmetic fillers, and may be used as nanocarriers for drug delivery. To make these applications a reality, the chemical nature of the ivy nanoparticles must be elucidated. In the current work, a method was developed to harvest bulk ivy nanoparticles from an adventitious root culture system, and the chemical composition of the nanoparticles was analysed. UV/visible spectroscopy, inductively coupled plasma mass spectrometry, Fourier transform infrared spectroscopy and electrophoresis were used in this study to identify the chemical nature of the ivy nanoparticles. Based on this analysis, we conclude that the ivy nanoparticles are proteinaceous.
Keywords: bioadhesive, nanoparticles, nanocomposite, English ivy
1. Introduction
Recent studies showed that the root hairs from the adventitious roots of English ivy (Hedera helix L.) secrete a nanocomposite adhesive composed of nanoparticles and a liquid polymer matrix [1,2]. The naturally secreted nanoparticles are highly uniform with a diameter of 50–80 nm, as measured by atomic force microscopy (AFM), and were hypothesized to contribute to the high adhesive strength of English ivy [2–4]. Force spectroscopy conducted on the freshly secreted adhesive found that the strength of the ivy adhesive was much greater than similar bioadhesives [4]. In order to determine the potential contribution of the ivy nanoparticles to the generation of the measured adhesive force, a contact fracture mechanics model was developed to predict the attachment strength of the nanoparticles [3]. Based on the model, it was discovered that van der Waals forces between the nanoparticles alone were not strong enough to generate the attachment strength observed experimentally. The data led to the hypothesis that the interaction between the nanoparticles and the polymer matrix generates cross-linking reactions that lead to an increased strength of adhesion. This hypothesis is consistent with the mechanism of other bioadhesives, such as those of marine mussels and barnacles, where adhesive proteins interact with divalent cations and polysaccharides to generate a stable water-resistant adhesive [5].
In addition to the role of ivy nanoparticles in the formation of strong adhesive forces, the nanoparticles have also demonstrated unique optical properties. A recent study demonstrated, through ultraviolet/visible (UV/vis) spectroscopy, that the ivy nanoparticles exhibit a strong UV absorbance from 200 to 400 nm [6,7]. Comparison of the ivy nanoparticles with similar concentrations of ZnO and TiO2 nanoparticles demonstrated an increased ability to block UV light, indicating a potential role for the ivy nanoparticles as sunscreen protective agents [3]. In the same study, the ivy nanoparticles were shown to be less toxic to mammalian cells, when compared with similar concentrations of TiO2 nanoparticles [7]. The reduced toxicity was speculated to be attributed to the organic nature of the nanoparticles, compared with the metallic nature of the TiO2 nanoparticles; however, the chemical nature of the ivy nanoparticles was not known at the time of that study.
There are a number of potential applications for which the ivy nanoparticles are ideally suited [3,7,8]; however, several issues must be addressed before they can be used for large-scale applications. First, a method must be developed for isolating ivy nanoparticles from the root hairs of adventitious roots. Second, enough ivy nanoparticles should be collected for chemical analysis, to determine the chemical nature of the ivy nanoparticles, and the chemical components that make up the nanoparticles. In this work, we have achieved both of these goals, first by developing a procedure for the production of ivy nanoparticles, and second by using this method to collect gram quantities of nanoparticles for chemical analysis.
2. Results and discussion
2.1. Production of ivy nanoparticles
A significant challenge to the collection of ivy nanoparticles was the small size of the root hairs (approx. 10 μm in diameter). In the natural system, when the root cap of an adventitious root contacts a surface, the root hairs begin to elongate and secrete adhesive [1,9]. As mentioned earlier, it has been proven in previous studies that this secreted adhesive contains nanoparticles [1]. Since the root hairs are the only known structures involved in the generation of the nanocomposite adhesive [1], the first step in the development of a procedure for nanoparticle production was to maximize the production of root hairs, while preventing any external contamination. As a result, a tissue culture method was developed for growing the adventitious roots from cut shoots in sterile Magenta GA-7 (MAG) plant culture boxes. Ivy shoots used for tissue culture were donated by Swan Valley Farms (Bow, Washington) on a weekly basis. Briefly, shoots were cut approximately to 6 inches with one leaf remaining on the top of the shoot. The external surfaces of the shoots were then sterilized and the shoots placed upright into MAG boxes containing nutrient media. The boxes were then sealed and placed into a plant growth chamber with controlled light and temperature. By sealing the MAG boxes, it was possible to achieve 100% humidity in the boxes, which was crucial for maintaining the hydration of the adventitious roots. Using this culture method, it was possible to generate harvestable adventitious roots every two weeks. In addition, adventitious roots grew much denser in the culture system when compared with uncultured plants. Furthermore, the adventitious roots had a much higher concentration of root hairs, owing to the high humidity and the increased availability of nutrients. Development of this culture system greatly increased the ability to generate the tissue for nanoparticle secretion, leading to further advances in the design of a robust method for ivy nanoparticle isolation.
With the stable, scalable tissue culture system described above, the next step was to harvest the tissue for isolation of the nanoparticles. Considering the small diameter of the root hairs and the rapid dehydration of the tissue when separated from the adventitious roots, the entire adventitious root was collected for harvesting the nanoparticles. To preserve the integrity of the tissue during the time required for harvesting, the adventitious roots were excised directly into a liquid nitrogen cooled container resulting in an immediate snap freezing of the tissue. After collection of bulk adventitious roots, the roots were stored at −80°C. Once an appropriate amount of tissue (more than 1 g) was collected for nanoparticle isolation, the tissue was homogenized at 4°C using a mortar and pestle. Manual homogenization was conducted with only a minimum amount of ultrapure water to allow the solution to be easily pipetted out of the mortar. After homogenization, the solution containing a large amount of cell debris, proteins, the polymer adhesive and nanoparticles was obtained. To remove the large debris, the solution was filtered through a 0.2 µm syringe filter and then centrifuged at 1000g to remove any remaining debris. Finally, the sample was dialysed through a 300 kDa Spectra/Por cellulose ester dialysis membrane overnight at 4°C with constant stirring. This high molecular weight (MW) dialysis membrane was effective for removing most proteins, and also salts present in the sample. Smaller MW dialysis membranes were tested; however, the nanoparticles isolated using the 300 kDa membrane represented the purest fraction, and thus this membrane was used for further purification. After dialysis, samples were run on an SEC-HPLC column for separation of the ivy nanoparticles from the other components.
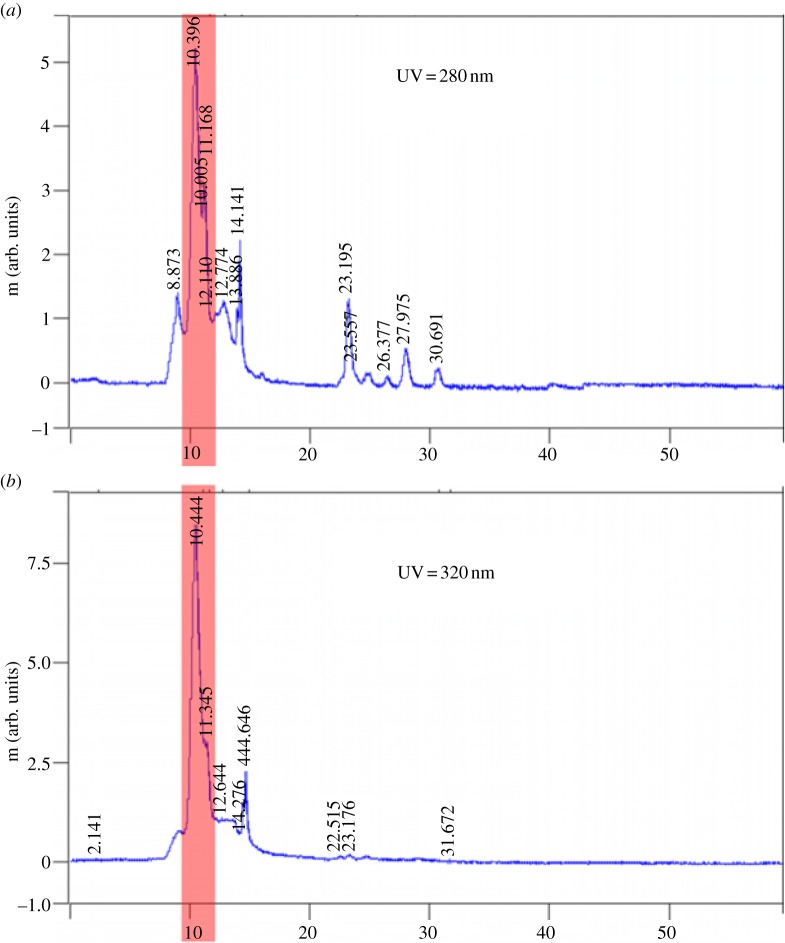
Previous studies using freshly secreted ivy nanoparticles indicated that the nanoparticles absorbed UV light over the range of 200–400 nm [6,7]. Since the UV absorbance and morphology of the ivy nanoparticles were known, samples eluted from the SEC-HPLC column were collected every minute and scanned using AFM. In addition, a UV detector was used to constantly measure the UV absorbance at both 280 and 320 nm during the entire elution. Based on the AFM images, it was determined that the ivy nanoparticles were contained in the fraction collected from 10 to 11 min. The nanoparticles collected in this fraction had the same morphology as those secreted directly from the plant (figure 1a,b). Further analysis of the morphology of individual nanoparticles was carried out by examining diluted samples using both AFM and scanning electron microscopy (SEM) (figure1c,d). In addition to these techniques, dynamic light scattering (DLS) and zeta potential analysis were performed to determine the size distribution and stability of the hydrated nanoparticles (figure 2a,b). DLS conducted on nanoparticles obtained from three separate batches of adventitious roots confirmed the presence of the ivy nanoparticles in the solution collected from the 10–11 min fraction with a mean diameter of 95.69 ± 5.56 nm (figure 2a). As expected, the nanoparticle diameter measured by DLS was larger than that using AFM and SEM, owing to the hydrodynamic radii present in solution [10]. In addition, zeta potential analysis indicated that the ivy nanoparticles did not form a stable solution in ultrapure water (figure 2b). This was expected, since the ivy nanoparticles have been observed to slowly precipitate in neutral solutions.
Figure 1.

AFM and SEM images of ivy nanoparticles. (a) AFM scan of dense ivy nanoparticles secreted directly from an adventitious root. (b) AFM scan of dense ivy nanoparticles isolated using the procedure developed in this study. (c) Small cluster of ivy nanoparticles imaged by AFM after dilution from the concentrated sample collected from the column. The inset of (c) shows an SEM image of a single ivy nanoparticle prepared the same as the diluted AFM sample. Note that the size of an individual nanoparticle is slightly smaller by AFM; however, artefacts related to tip–particle interactions can greatly affect size measurements using AFM.
Figure 2.
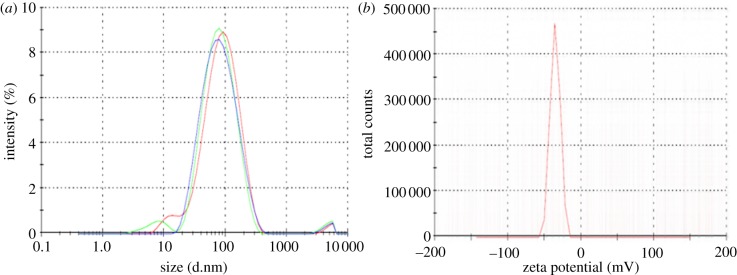
DLS and zeta potential analysis of the isolated ivy nanoparticles. (a) DLS of the nanoparticles collected from three separate isolations showed a similar distribution, with a mean diameter of 95.69 ± 5.56 nm. (b) The zeta potential of the ivy nanoparticles was found to be −35.3 mV, indicating that the ivy nanoparticles did not form a stable solution in ultrapure water. (Online version in colour.)
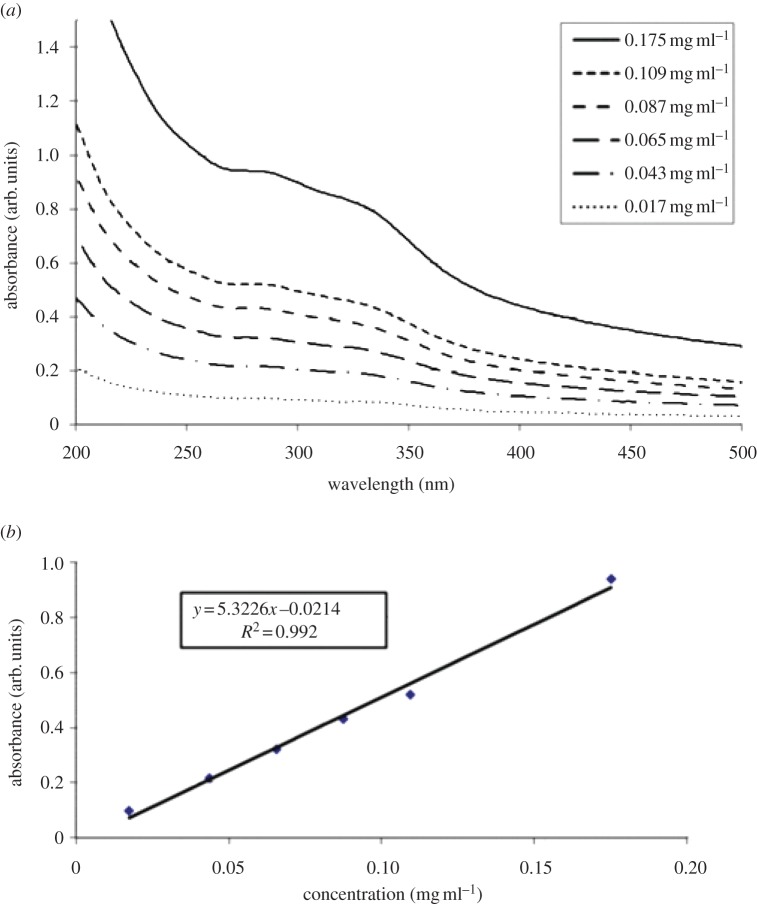
In addition to the physical structure of the isolated ivy nanoparticles, the data from the UV detector showed a high intensity peak at approximately 10.5 min at both 280 and 320 nm (figure 3a,b). These peaks were positively correlated with the AFM and DLS data, and confirmed the presence of the ivy nanoparticles. In previous studies, determination of the concentration of ivy nanoparticles in solution could only be estimated, owing to the limited quantity of nanoparticles [6]. Using the method developed above, after collecting the concentrated ivy nanoparticles, the samples were pooled and lyophilized to get an accurate measure of the dry weight of the ivy nanoparticles. To confirm that the previously observed UV/vis absorbance spectra [6,7] were due to the ivy nanoparticles alone, it was necessary to analyse the concentration-dependent effect of the ivy nanoparticles using UV/vis spectroscopy. As shown in figure 4a, when the concentration of the ivy nanoparticles decreased, the resulting absorbance decreased. A plot of the UV absorbance at 283 nm showed a linear increase between the concentration of the ivy nanoparticles and the absorbance value measured by the UV/vis spectrometer. This linear increase in absorbance demonstrated that the UV absorbance spectra obtained were from the ivy nanoparticles. After thorough validation of the method described above for the generation of ivy nanoparticles, the above procedure was repeated to collect enough nanoparticles for subsequent chemical analysis.
Figure 3.
(a,b) Peaks observed from UV detector of the ivy extract. A prominent peak was observed in both wavelengths (highlighted) during the 10–11 min fraction. This fraction corresponded to the presence of nanoparticles, as indicated by AFM. Peaks with lower intensity were imaged but were found not to contain any nanoparticles. (Online version in colour.)
Figure 4.
(a) UV/vis spectra of the ivy nanoparticle fraction collected directly from the HPLC column. Note the wide absorbance from 200 to 350 nm, before dropping off in the visible region. (b) A plot of absorbance versus concentration at 283 nm clearly shows the direct effect of the nanoparticle concentration on the absorbance. (Online version in colour.)
2.2. Chemical analysis of the ivy nanoparticles
The first step in chemical analysis of the ivy nanoparticles was to confirm that the nanoparticles were organic and did not contain any metals. This is especially important when considering the large number of metallic nanoparticles that can be formed naturally from heavy metal substrates. Numerous studies have demonstrated the potential for plants, including English ivy, to generate nanoparticles from tetrachloroaurate (HAuCl4), silver nitrate (AgNO3), chloroplatinic acid hexahydrate (H2PtCl6 · 6H2O) and iron(III) chloride hexahydrate (FeCl3 · 6H2O) [11–14]. Since the ivy shoots were grown in a cultured environment and were not exposed to variable soil conditions, it was also expected that this would reduce the availability of heavy metal substrates. To rule out the possibility of the ivy nanoparticles containing metallic components, 48.78 mg of ivy nanoparticles were analysed using inductively coupled plasma mass spectrometry (ICP-MS). This technique can be used to detect trace levels of metals in a sample and has recently been expanded to the analysis of metallo-biomolecules, including metalloproteins [15,16]. To ensure impartiality, the ivy nanoparticles were analysed independently by Galbraith Laboratories, Inc. The results indicated that 47 out of 57 elements tested were below the limit of detection of the test at less than 2 parts per million (ppm). These included the most common metals used for the synthesis of nanoparticles from plant extracts, gold, silver, platinum and iron. In addition to the metals that were below the detection limit, only manganese and zinc were found above 30 ppm, and both were still at below trace concentrations (figure 5). Since no metals were detected above trace levels, it can be concluded that the ivy nanoparticles are, in fact, organic nanoparticles.
Figure 5.
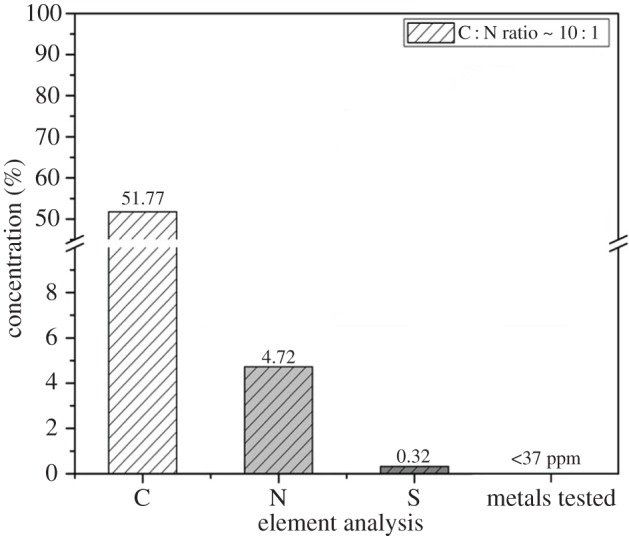
Diagrammatic representation of the results from the ICP-MS and elemental analysis. As indicated, the C : N ratio was approximately 10 : 1, indicating that the nanoparticles were composed of biomolecules. Additionally, ICP-MS revealed that all metals in the ivy nanoparticle fraction were less than 37 ppm, confirming that the ivy nanoparticles are organic.
After confirmation of the organic nature of the ivy nanoparticles, the next step was to analyse what type of molecules may be responsible for the formation of the nanoparticles. In previous studies of Boston ivy (Parthenocissus tricuspidata) and Virginia creeper (Parthenocissus quinquefolia), it was found, through immunocytochemical analysis, that the majority of the components in the secreted adhesives were mucilaginous pectins, callose, tanniferous substances and acid mucopolysaccharides [17–19]. However, nanoparticles were not observed in either of these studies, potentially because of the techniques used at the time of these studies. In other biological systems, such as the marine mussel (Mytilus edulis) and polychaete (Phragmatopoma californica), proteins are considered as the main building blocks that lead to the generation of strong adhesive forces [20–22]. In these two systems, unlike Parthenocissus sp., the adhesives secreted from these organisms have shown the presence of nanoparticles, mainly thought to form from the interactions of negatively charged proteins with divalent cations, forming three-dimensional nanoparticles [22]. Based on this information, we established a series of experiments to determine the organic components involved in the formation of the ivy nanoparticles.
The first experiment conducted was elemental analysis to determine the amount of carbon, nitrogen and sulfur present in the ivy nanoparticles. It was found that the nanoparticles were composed of 51.77% carbon and 4.72% nitrogen (figure 5). This was a relatively high carbon-to-nitrogen ratio of approximately 10 : 1 and was indicative of a biomolecule such as DNA, RNA or protein. In addition, the nanoparticles contained 0.32% sulfur, which again would be expected for a biomolecule, such as a protein, where disulfide bonds play an important role in folding and stability, especially in secreted proteins [23]. While this evidence strongly pointed to the presence of proteins in the nanoparticles, it could not rule out that other biomolecules, such as polysaccharides, may still contribute to the overall structure. In addition, since nanoparticles were isolated, and not an individual chemical component, it was possible that the C : N ratio could have been skewed by the presence of multiple components. As a result, Fourier transform infrared (FTIR) spectroscopy was conducted on lyophilized nanoparticles to obtain further information on the chemical structures of the nanoparticles.
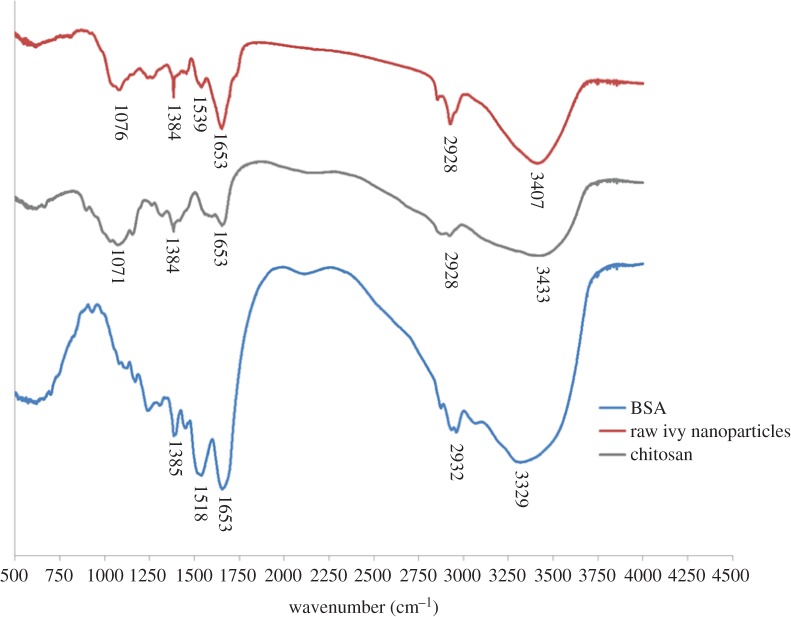
As demonstrated in figure 6, the FTIR spectrum of the ivy nanoparticles was compared with the spectra generated from a typical protein sample, bovine serum albumin (BSA), and also a popular polysaccharide used in the fabrication of nanomaterials, chitosan. All three samples showed a peak at 1653 cm−1 indicating vibration around C=O and C–N, along with peaks at 1384–1385 cm−1, indicating C–H bending in aliphatic side groups [24,25]. Additionally, shared peaks at 2928 cm−1 for both ivy nanoparticles and chitosan, and 2932 cm−1 for BSA, indicate the vibration of C–H present in all samples. When compared with the BSA spectrum, the ivy nanoparticles also shared a peak around 1518 cm−1 for BSA and 1539 cm−1 for ivy. This peak represents the amide II band and is a standard protein peak, indicating the presence of in-plane N–H bending, and the stretching vibrations of C–N and C–C [25]. In standard protein samples, this amide II band often shows similar intensity to the amide I band, as shown for BSA, but the complexity of this band leads to variable intensity and shifts of this peak. In addition to the peak shared by the BSA and ivy nanoparticle sample, the chitosan and ivy nanoparticles shared a peak at 1071 cm−1 for chitosan and 1076 cm−1 for the ivy nanoparticles. This peak was associated with vibration of the CO–C bond typically found in carbohydrates [24,25], and thus was not present in the BSA sample. The broad peak present at 3329 cm−1 in the BSA sample indicates the vibration of N–H, and is similar to the broad peaks for chitosan (3433 cm−1) and the ivy nanoparticles (3407 cm−1), where the shift is due to the addition of vibration from O–H [24]. Based on the FTIR data, in combination with the elemental analysis, we believed that the most likely component of the nanoparticles was glycoprotein, owing to the shared amide II band with the BSA spectrum, and the shared CO–C band with the chitosan spectrum. In addition, the shift in the broad peak at 3407 cm−1 indicated that O–H bonds were present, further suggesting the presence of carbohydrate. Based on these data, individual proteins and glycoproteins were believed to form the ivy nanoparticles, and thus we conducted gel electrophoresis to identify individual proteins.
Figure 6.
FTIR spectrum of the ivy nanoparticles. The FTIR spectrum for the ivy nanoparticles was compared with reference spectra for chitosan (a representative polysaccharide) and BSA (a representative protein). All three samples had a band at 1653 cm−1, indicating vibration around the CO–NH bond, and around 2928–2932 cm−1 indicating C–H vibration. In addition, the ivy sample shared a peak at 1071–1076 cm−1 with the chitosan sample, indicating vibration of a CO–C bond, typical of sugars. This band was not present in the BSA sample. Similarly, the BSA sample had a strong peak at 1518 cm−1, representing the amide II band, whereas the ivy nanoparticles had a weak band at 1539 cm−1, indicating a weak amide II band, and the chitosan sample had no peak in this region. The FTIR spectra from top to bottom are: raw ivy nanoparticles, chitosan and BSA. (Online version in colour.)
Several different gel electrophoresis techniques were evaluated in this study to determine whether the proteins and glycoproteins could be separated from the ivy nanoparticles. It was determined that sodium dodecylsulfate polyacrylamide gel electrophoresis (SDS-PAGE) with a 5% stacking gel and 10% resolving gel yielded the best results for the ivy nanoparticles. In addition, the samples were pre-treated with 2 M thiourea, 8 M urea and 3% SDS, to completely solubilize the nanoparticles, which reduced the background staining. After electrophoresis for 4 h at 180 V, duplicate gels were stained with either the Pro-Q Emerald 300 Glycoprotein Stain Kit (Molecular Probes, Inc., Eugene, OR) or the PlusOne Silver Staining Kit (APBiotech). For reproducibility, ivy nanoparticles isolated from three different isolation procedures by two different researchers were tested. Surprisingly, only one high MW band (greater than 460 kDa) was observed in all of the ivy nanoparticle samples, despite the harsh denaturing conditions used (figure 7). This high MW band stained positive for protein, using the silver stain, and glycoprotein, using the Pro-Q glycoprotein stain (figure 7). When comparing the two stains, it was observed that the glycoprotein stain did not cross-react with the non-glycosylated proteins present in the protein ladder (figure 7). To ensure that the presence of the glycoprotein band was always associated with the ivy nanoparticles, three separate isolations were conducted using different batches of adventitious roots. As shown in figure 7, the band was consistent across all three samples. This confirmed that the ivy nanoparticles were composed of at least one, if not several glycoproteins. Owing to the high MW of the band, and the potential for the ivy nanoparticles to have survived the denaturing conditions, the possibility still exists that the ivy nanoparticles are composed of multiple proteins and glycoproteins. Further studies are necessary to determine the three-dimensional crystal structure of the ivy nanoparticles and to identify whether multiple copies of a single protein or multiple proteins combine to form the ivy nanoparticles. In either case, the discovery that ivy nanoparticles are non-metallic and proteinaceous represents a significant finding and opens the door for further analysis of the structure of these novel nanoparticles.
Figure 7.
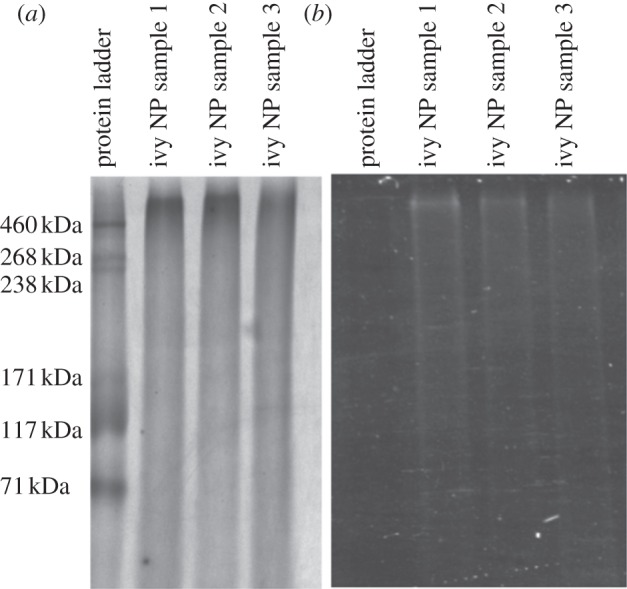
Results from SDS-PAGE of ivy nanoparticles. (a) Results of the silver stain demonstrating the staining of the protein ladder, and all ivy nanoparticle samples. (b) Results from glycoprotein stain showing positive staining for the high MW nanoparticle band. Samples 1, 2 and 3 represent nanoparticles isolated from three separate trials. Note the lack of staining of the non-glycosylated proteins from the standard ladder.
3. Conclusion
In this study, we have developed a method for the production of ivy nanoparticles and demonstrated the scalability of this process. Briefly, bulk ivy nanoparticles were harvested from cultured adventitious roots through homogenization, filtration and separation through an SEC column. The development of this method was crucial for demonstrating the ability to collect bulk nanoparticles for use in biomedical applications, and also to obtain enough nanoparticles for subsequent chemical analysis. Through experiments conducted using ICP-MS, we were able to prove that the ivy nanoparticles did not contain any metallic components, confirming the earlier hypothesis that the ivy nanoparticles were organic. Elemental analysis revealed a high, approximately 10 : 1, C : N ratio, and further analysis by FTIR spectroscopy confirmed the presence of peaks related to C–N bonding. Comparison of the ivy nanoparticle FTIR spectra with a polysaccharide standard, chitosan, and protein standard, BSA, demonstrated that the ivy nanoparticles shared similar structure to both samples, indicating that the nanoparticles were most probably composed of glycoproteins. Using gel electrophoresis, the ivy nanoparticles formed a single high MW band, which stained positive for both proteins and glycoproteins through silver and glycoprotein-specific stains. At this stage, it is not possible to identify the exact interactions between proteins that lead to the structural formation of the three-dimensional nanoparticles; however, further studies based on identification of the sequence of these proteins will provide information on how they may be arranged. It is expected that continued research into these proteins will aid in the development of new high strength adhesives. Furthermore, it will also be possible to scale-up the procedure developed in this work to collect enough ivy nanoparticles for future applications in drug delivery and cosmetics.
4. Experimental set-up
4.1. Isolation and physical analysis of the ivy nanoparticles
Previously, a method was developed for generating bulk adventitious roots from the shoots of English ivy, specifically for the production of viable nanoparticle-containing tissue [26]. This method was employed to grow harvestable amounts of adventitious roots for use in this study. Since the adventitious roots and root hairs that branch off of the rootlet are the only structures involved in secretion of the adhesive, these structures were removed from fresh shoots using a razor blade. Adventitious roots were harvested directly into liquid nitrogen before attaching. Homogenization of the cleaned rootlets was accomplished with the use of a pellet pestle (Kimble Chase Kontes) designed for use in 1.5 ml microfuge tubes. The supernatant was removed from the homogenate and centrifuged at 1000g for 10 min to remove large debris. The supernatant from this treatment was then filter-sterilized through a 0.2 µm syringe filter to remove debris larger than 200 nm, and also to remove bacteria that may have been present in the sample. The filtrate was then dialysed overnight at 4°C with distilled water using a Spectra/Por Biotech cellulose ester dialysis membrane that allowed removal of small chemicals and proteins with an MW of less than 300 kDa.
After removing most of the components from the rootlet extract it was possible to run the extract on a Phenomenex Biosep-SEC-S 4000 silica gel filtration column. The column was equipped with a SecurityGuard Cartridge to prevent any remaining debris from entering the column. Similar SEC-HPLC set-ups have been used to separate and isolate a wide range of nanoparticles [27–29]. Two hundred microlitres of the cleaned extract was run on the column using a flow rate of 0.5 ml min−1. The eluate was constantly monitored with a dual wavelength UV detector measuring at 280 and 320 nm. Ivy nanoparticle fractions were known to absorb UV at these wavelengths based on previous studies [6,7]. Fractions were also collected every minute over the course of 60 min for analysis by AFM. For AFM analysis, 20 µl of each fraction was drop deposited on freshly cleaved mica or a cleaned glass coverslip and allowed to dry overnight. AFM imaging was conducted using an Agilent 6000 ILM/AFM equipped with Nanosensors PPP-NCHR-20 silicon cantilevers with spring constants of 4–20 N m−1. All imaging was conducted in AC mode to prevent contamination on the tip, and also to prevent the tip from dislodging the nanoparticles from the surface. To determine the presence of the nanoparticles in solution, DLS was performed on the nanoparticle fractions using a Malvern ZetaSizer Nano ZS (Malvern Instruments Ltd). This instrument was also used to determine the zeta potential of the ivy nanoparticle solution. After identifying the fraction that contained the nanoparticles, the fraction was frozen in a −80°C freezer and lyophilized overnight to remove the liquid components and concentrate the nanoparticles. The lyophilized powder was then resuspended in ultrapure water and drop deposited on silica wafer before examination using SEM. SEM was used to determine the size and shape of the nanoparticles, and also to scan a larger area to determine the relative purity of the sample.
4.2. Chemical analysis
UV/vis spectroscopy was conducted on the liquid fraction collected from the column and also on the lyophilized powder resuspended in ultrapure water, using a Thermo Scientific Evolution 600 spectrophotometer. The samples were analysed over wavelengths from 200 to 500 nm, and the absorbance was measured. The absorbance versus concentration was plotted by conducting a serial dilution of the resuspended nanoparticle powder. FTIR spectroscopy was conducted on the lyophilized powder to determine the functional groups found in the nanoparticles using a Bio-RAD FTS6000 FTIR spectrometer. Both ICP-MS and the elemental analysis of the ivy nanoparticles were conducted at Galbraith Laboratories Inc., which allowed for an unbiased examination of the specimen. Finally, 5 mg of lyophilized nanoparticles were rehydrated in 1 ml of 0.5 M Tris–HCl (pH 6.8). Seventy-five microlitres of nanoparticle solution was then mixed with 25 µl of 4× LDS sample buffer (Life Technologies, Grand Island, NY, USA). Eight microlitres of the sample was then mixed with 10 µl of reducing buffer (2 M thiourea, 8 M urea and 3% SDS) and boiled for 10 min. After denaturation, samples were run on 5%/10% SDS-PAGE at 180 V for 4 h at 4°C in SDS–Tris–glycine running buffer. Gels were subsequently stained using Pro-Q Emerald 300 Glycoprotein Stain Kit (Molecular Probes, Inc., Eugene, OR) or the PlusOne Silver Staining Kit (APBiotech).
Funding statement
This research is partially sponsored by the Army Research Office (W911NF-10-1-0114) and the National Science Foundation (CMMI, 1029953; CBET, 0965877). The authors are grateful for the support. R.S. acknowledges graduate stipend support from the Genome Science and Technology Graduate School at UT-Knoxville. Financial support to K.C., C.P. and R.L.H. was provided by the US Department of Energy, Biological and Environmental Research Division, Genome Sciences Program. Oak Ridge National Laboratory is managed by University of Tennessee-Battelle LLC for the Department of Energy.
References
- 1.Lenaghan SC, Zhang M. 2012. Real-time observation of the secretion of a nanocomposite adhesive from English ivy (Hedera helix). Plant Sci. 183, 206–211. ( 10.1016/j.plantsci.2011.08.013) [DOI] [PubMed] [Google Scholar]
- 2.Zhang M, Liu M, Prest H, Fischer S. 2008. Nanoparticles secreted from ivy rootlets for surface climbing. Nano Lett. 8, 1277–1280. ( 10.1021/nl0725704) [DOI] [PubMed] [Google Scholar]
- 3.Wu Y, Zhao X, Zhang M. 2010. Adhesion mechanics of ivy nanoparticles. J. Colloid Interface Sci. 344, 533–540. ( 10.1016/j.jcis.2009.12.041) [DOI] [PubMed] [Google Scholar]
- 4.Xia L, Lenaghan S, Zhang M, Wu Y, Zhao X, Burris J, Neal Stewart C. 2010. Characterization of English ivy (Hedera helix) adhesion force and imaging using atomic force microscopy. J. Nanopart. Res. 13, 1029–1037. ( 10.1007/s11051-010-0091-3) [DOI] [Google Scholar]
- 5.Coombs TL, Keller PJ. 1981. Mytilus byssal threads as an environmental marker for metals. Aquat. Toxicol. 1, 291–300. ( 10.1016/0166-445X(81)90023-0) [DOI] [Google Scholar]
- 6.Li Q, Xia L, Zhang Z, Zhang M. 2010. Ultraviolet extinction and visible transparency by ivy nanoparticles. Nanoscale Res. Lett. 5, 1487–1491. ( 10.1007/s11671-010-9666-2) [DOI] [PMC free article] [PubMed] [Google Scholar]
- 7.Xia L, Lenaghan S, Zhang M, Zhang Z, Li Q. 2010. Naturally occurring nanoparticles from English ivy: an alternative to metal-based nanoparticles for UV protection. J. Nanobiotechnol. 8, 12 ( 10.1186/1477-3155-8-12) [DOI] [PMC free article] [PubMed] [Google Scholar]
- 8.Zhang M, Liu M, Bewick S, Suo Z. 2009. Nanoparticles to increase adhesive properties of biologically secreted materials for surface affixing. J. Biomed. Nanotechnol. 5, 294–299. ( 10.1166/jbn.2009.1034) [DOI] [PubMed] [Google Scholar]
- 9.Melzer B, Steinbrecher T, Seidel R, Kraft O, Schwaiger R, Speck T. 2010. The attachment strategy of English ivy: a complex mechanism acting on several hierarchical levels. J. R. Soc. Interface 7, 1383–1389. ( 10.1098/rsif.2010.0140) [DOI] [PMC free article] [PubMed] [Google Scholar]
- 10.Hoo C, Starostin N, West P, Mecartney M. 2008. A comparison of atomic force microscopy (AFM) and dynamic light scattering (DLS) methods to characterize nanoparticle size distributions. J. Nanopart. Res. 10, 89–96. ( 10.1007/s11051-008-9435-7) [DOI] [Google Scholar]
- 11.Chandran SP, Chaudhary M, Pasricha R, Ahmad A, Sastry M. 2006. Synthesis of gold nanotriangles and silver nanoparticles using aloevera plant extract. Biotechnol. Progr. 22, 577–583. ( 10.1021/bp0501423) [DOI] [PubMed] [Google Scholar]
- 12.Njagi EC, Huang H, Stafford L, Genuino H, Galindo HM, Collins JB, Hoag GE, Suib SL. 2010. Biosynthesis of iron and silver nanoparticles at room temperature using aqueous sorghum bran extracts. Langmuir 27, 264–271. ( 10.1021/la103190n) [DOI] [PubMed] [Google Scholar]
- 13.Shankar SS, Ahmad A, Pasricha R, Sastry M. 2003. Bioreduction of chloroaurate ions by geranium leaves and its endophytic fungus yields gold nanoparticles of different shapes. J. Mater. Chem. 13, 1822–1826. ( 10.1039/b303808b) [DOI] [Google Scholar]
- 14.Song JY, Kwon EY, Kim BS. 2010. Biological synthesis of platinum nanoparticles using Diopyros kaki leaf extract. Bioprocess. Biosyst. Eng. 33, 159–164. ( 10.1007/s00449-009-0373-2) [DOI] [PubMed] [Google Scholar]
- 15.Ellis J, Del Castillo E, Montes Bayon M, Grimm R, Clark JF, Pyne-Geithman G, Wilbur S, Caruso JA. 2008. A preliminary study of metalloproteins in CSF by CapLC-ICPMS and NanoLC-CHIP/ITMS. J. Proteome Res. 7, 3747–3754. ( 10.1021/pr800024k) [DOI] [PMC free article] [PubMed] [Google Scholar]
- 16.Garcia JS, Magalhães CS, Arruda MA. 2006. Trends in metal-binding and metalloprotein analysis. Talanta 69, 1–15. ( 10.1016/j.talanta.2005.08.041) [DOI] [PubMed] [Google Scholar]
- 17.Bowling AJ, Vaughn KC. 2008. Structural and immunocytochemical characterization of the adhesive tendril of Virginia creeper (Parthenocissus quinquefolia [L.] Planch.). Protoplasma 232, 153–163. ( 10.1007/s00709-008-0287-x) [DOI] [PubMed] [Google Scholar]
- 18.Endress AG, Thomson WW. 1976. Ultrastructural and cytochemical studies on the developing adhesive disc of Boston ivy tendrils. Protoplasma 88, 315–331. ( 10.1007/BF01283255) [DOI] [Google Scholar]
- 19.Endress AG, Thomson WW. 1977. Adhesion of the Boston ivy tendril. Can. J. Bot. 55, 918–924. ( 10.1139/b77-112) [DOI] [Google Scholar]
- 20.Fant C, Elwing H, Hook F. 2002. The influence of cross-linking on protein–protein interactions in a marine adhesive: the case of two byssus plaque proteins from the blue mussel. Biomacromolecules 3, 732–741. ( 10.1021/bm025506j) [DOI] [PubMed] [Google Scholar]
- 21.Ninan L, Stroshine RL, Wilker JJ, Shi R. 2007. Adhesive strength and curing rate of marine mussel protein extracts on porcine small intestinal submucosa. Acta Biomater. 3, 687–694. ( 10.1016/j.actbio.2007.02.004) [DOI] [PMC free article] [PubMed] [Google Scholar]
- 22.Stevens MJ, Steren RE, Hlady V, Stewart RJ. 2007. Multiscale structure of the underwater adhesive of Phragmatopoma californica: a nanostructured latex with a steep microporosity gradient. Langmuir 23, 5045–5049. ( 10.1021/la063765e) [DOI] [PMC free article] [PubMed] [Google Scholar]
- 23.Sevier CS, Kaiser CA. 2002. Formation and transfer of disulphide bonds in living cells. Nat. Rev. Mol. Cell. Biol. 3, 836–847. ( 10.1038/nrm954) [DOI] [PubMed] [Google Scholar]
- 24.Bhattarai S, Kc R, Kim S, Sharma M, Khil M, Hwang P, Chung G, Kim H. 2008. N-hexanoyl chitosan stabilized magnetic nanoparticles: implication for cellular labeling and magnetic resonance imaging. J. Nanobiotechnol. 6, 1 ( 10.1186/1477-3155-6-1) [DOI] [PMC free article] [PubMed] [Google Scholar]
- 25.Wang TD, Triadafilopoulos G, Crawford JM, Dixon LR, Bhandari T, Sahbaie P, Friedland S, Soetikno R, Contag CH. 2007. Detection of endogenous biomolecules in Barrett's esophagus by Fourier transform infrared spectroscopy. Proc. Natl Acad. Sci. USA 104, 15 864–15 869. ( 10.1073/pnas.0707567104) [DOI] [PMC free article] [PubMed] [Google Scholar]
- 26.Burris J, Lenaghan S, Zhang M, Stewart C. 2012. Nanoparticle biofabrication using English ivy (Hedera helix). J. Nanobiotechnol. 10, 41 ( 10.1186/1477-3155-10-41) [DOI] [PMC free article] [PubMed] [Google Scholar]
- 27.Sivamohan R, Takahashi H, Kasuya A, Tohji K, Tsunekawa S, Ito S, Jeyadevan B. 1999. Liquid chromatography used to size-separate the amphiphilic-molecules stabilized nano-particles of cds in the 1–10 nm range. Nanostruct. Mater. 12, 89–94. ( 10.1016/S0965-9773(99)00072-0) [DOI] [Google Scholar]
- 28.Wang S, Mamedova N, Kotov NA, Chen W, Studer J. 2002. Antigen/antibody immunocomplex from CdTe nanoparticle bioconjugates. Nano Lett. 2, 817–822. ( 10.1021/nl0255193) [DOI] [Google Scholar]
- 29.Wei GT, Liu FK. 1999. Separation of nanometer gold particles by size exclusion chromatography. J. Chromatogr. A 836, 253–260. ( 10.1016/S0021-9673(99)00069-2) [DOI] [PubMed] [Google Scholar]


