Abstract
Measurement of optic nerve head (ONH) deformations could be useful in the clinical management of glaucoma. Here, we propose a novel three-dimensional tissue-tracking algorithm designed to be used in vivo. We carry out preliminary verification of the algorithm by testing its accuracy and its robustness. An algorithm based on digital volume correlation was developed to extract ONH tissue displacements from two optical coherence tomography (OCT) volumes of the ONH (undeformed and deformed). The algorithm was tested by applying artificial deformations to a baseline OCT scan while manipulating speckle noise, illumination and contrast enhancement. Tissue deformations determined by our algorithm were compared with the known (imposed) values. Errors in displacement magnitude, orientation and strain decreased with signal averaging and were 0.15 µm, 0.15° and 0.0019, respectively (for optimized algorithm parameters). Previous computational work suggests that these errors are acceptable to provide in vivo characterization of ONH biomechanics. Our algorithm is robust to OCT speckle noise as well as to changes in illumination conditions, and increasing signal averaging can produce better results. This algorithm has potential be used to quantify ONH three-dimensional strains in vivo, of benefit in the diagnosis and identification of risk factors in glaucoma.
Keywords: in vivo biomechanics, optic nerve head deformations, intraocular pressure, optical coherence tomography, digital volume correlation, glaucoma
1. Introduction
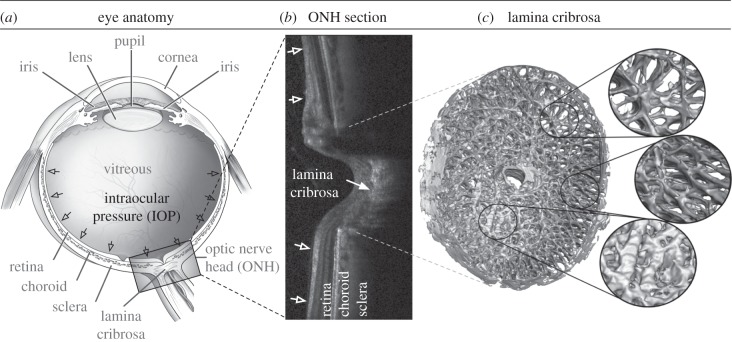
Glaucoma is the most common cause of irreversible blindness, affecting about 60 million people worldwide [1]. The central event in glaucoma is irreversible damage of retinal ganglion cell axons, which carry visual information from the retina to the brain. The presumed primary location of retinal ganglion cell damage is within the optic nerve head (ONH), the site where retinal ganglion cell axons converge to leave the back of the eye in transit to the brain (figure 1). Glaucoma is diagnosed clinically in patients who have characteristic changes (increased ‘cupping’ or excavation) visible at the ONH (glaucomatous optic neuropathy) associated with typical glaucomatous patterns of visual field loss. It is well established that increased intraocular pressure (IOP) is associated with increased prevalence [3] and incidence [4] of glaucoma. Furthermore, reduction in IOP, either pharmacologically or surgically, is the only treatment proved to slow the progression of the disease [5,6]. In addition, glaucoma occurs nearly as often in patients with normal IOP as in those with elevated IOP, and does so without distinct aetiology [7], although in a significant proportion IOP-lowering still retards disease progression. Finally, some subjects have a statistically elevated IOP (more than 21 mmHg) but will never develop glaucomatous optic neuropathy or visual field loss; these subjects are referred to as ‘ocular hypertensive’.
Figure 1.
(a) Schematic of a human eye, adapted from the National Eye Institute image resources (http://www.nei.nih.gov/resources/). (b) Cross section of a human ONH captured with optical coherence tomography. (c) Digital reconstruction showing the anatomy of a monkey lamina cribrosa (LC) showing its beams and pores. The LC is presumed to be the principal site of damage in glaucoma. (Adapted from [2].)
The above-mentioned observations demonstrate that our current understanding of glaucoma is insufficient: IOP is important, but risk factors other than IOP must play important roles in the development and progression of this pathology. Unfortunately, we currently lack the tools to measure and assess other risk factors.
To explain the above-mentioned clinical observations, it has been suggested that glaucoma patients with normal IOP have an inherently ‘weak’ ONH, whereas ocular hypertensive patients without glaucoma do not develop the disease owing to an inherently ‘strong’ ONH. In other words, the biomechanics of an individual's ONH may dictate the IOP level at which its homeostatic mechanisms are effective [8]. Therefore, above an individual-specific threshold level of IOP, a series of cellular events may be initiated which eventually lead to glaucomatous damage. There is strong evidence to suggest that this is a valid hypothesis [9–26]; however, clear proof has yet to be obtained, particularly as no direct investigation of ONH biomechanics has yet been undertaken in vivo in human subjects.
Our long-term research aim is to evaluate the in vivo biomechanical characteristics of human subjects' ONHs by imaging deformation of the ONH using optical coherence tomography (OCT). Quantifying biomechanics of the ONH in vivo using this novel approach could provide a crucial understanding of the underlying mechanisms involved in glaucoma, and may eventually lead to improved diagnosis of individuals at risk for glaucomatous vision loss. In this study, as the first step towards our long-term research aim, we developed and tested a three-dimensional tracking algorithm that can extract deformations from artificially deformed OCT image volumes of patients' ONHs captured at different IOPs.
The proposed algorithm could have wide applicability and could be used to study other biomechanically related disorders accessible by OCT such as papilloedema [27], atherosclerosis [28,29], keratoconus, macular degeneration and myopia.
2. Methods
We wished to develop an algorithm that can track displacements and strains of the ONH following a change in IOP. This algorithm requires two OCT volumes of the ONH: one is captured before a change in IOP, and is referred to as the ‘undeformed’ volume; the other is captured after a change in IOP and is referred to as the ‘deformed’ volume. Each OCT volume is a stack of images but is considered here as a group of voxels (i.e. intensity values are distributed on a three-dimensional rectangular grid).
In the following sections, we first present our three-dimensional tracking algorithm. Its accuracy is tested, using artificially deformed volumes. Its robustness to speckle noise (the noise inherent to OCT) is also tested.
2.1. Development of an optical coherence tomography-based three-dimensional tracking algorithm
2.1.1. Principle
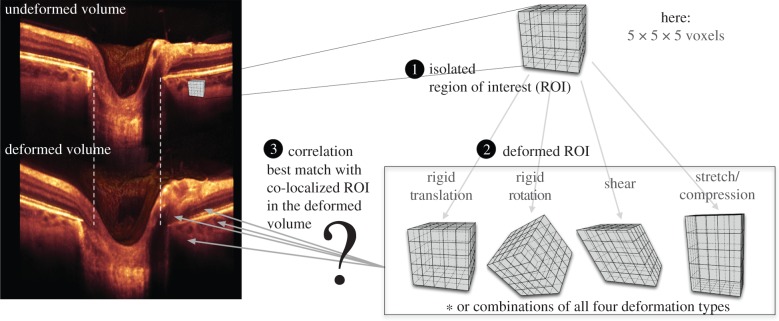
Our three-dimensional tracking algorithm was developed using the principle of digital volume correlation [30–34], which has not, to the best of our knowledge, been applied to OCT data previously. In order to track displacements, a region of interest (ROI) is created in the undeformed volume by centring a cuboidal subvolume at each material point where a displacement vector is sought (figure 2). Each ROI (or subgroup of ni × nj × nk voxels) is expected to deform with IOP, and its deformation can be mathematically expressed using continuum mechanics concepts as
| 2.1 |
where x and X are the position vectors of a material point that belongs to the ROI in the undeformed (reference) and deformed (current) configurations, respectively. F is the deformation gradient tensor (nine unique components), and t is the translation vector (three unique components), both of which are unknown quantities that need to be determined for each ROI. With equation (2.1), we can describe the ROI deformations as a combination of four possible affine transformations (rigid translation with vector t; rigid rotation, stretch and shear with tensor F).
Figure 2.
Steps to track displacement of a single material point: (1) an ROI is created in the undeformed OCT image volume; (2) The ROI undergoes a combination of affine transformations (translation, rotation, shear and stretch); (3) a displacement vector can be extracted when the deformed ROI best matches a co-localized ROI in the deformed image volume.
Using this approach, the displacement vector of the ROI centroid, u, which is the actual displacement vector we are seeking at each material point, can be expressed as
| 2.2 |
where x* and X* are the position vectors of the ROI centroid in the undeformed and deformed configurations, respectively. By combining equations (2.1) and (2.2), we derive
| 2.3 |
where F and u are the quantities to be determined (total of 12 parameters) at each material point.
2.1.2. Global optimization
Extracting F and u for each material point requires solving a global optimization problem. Put simply, for each ROI, we want to find the ROI deformation (characterized by F and u) for each couple (X, x) so that
| 2.4 |
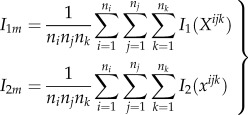
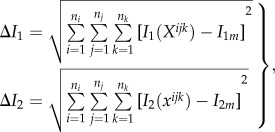
where I2 is the voxel intensity function of the deformed OCT volume, and I1 is the corresponding function of the undeformed OCT volume. Numerically, we chose to minimize the zero-normalized cross-correlation coefficient (ZNCC) [35] between the intensities, which is expressed as:
 |
2.5 |
where
 |
2.6 |
and
 |
2.7 |
where Xijk is the reference position vector of a voxel centroid. I1(Xijk) is the voxel intensity assumed to be defined at its centroid. In general, the vector xijk (derived with equation (2.3)) is not required to point to any voxel centroid in the deformed OCT volume. I2(xijk) was therefore obtained using a linear interpolation from the intensity values of the eight closest voxel centroids (in the deformed volume) of where the vector xijk was pointing. Note that the use of such linear interpolation is what allows subvoxel resolution of the proposed three-dimensional tracking algorithm. Therefore, our three-dimensional tracking can deal with conditions where the axial voxel resolution is different from the lateral voxel resolutions without further compensation techniques.
Several other definitions can be used instead of the ZNCC criterion, such as a least-squares criterion. However, the ZNCC criterion has been shown to be very robust to noise and insensitive to any offset or scaling of the illumination conditions [35]—an important aspect for OCT imaging where illumination variations can occur from one acquisition to the next.
In order to minimize equation (2.5), we used a genetic optimization algorithm known as differential evolution [36]. We have used such an algorithm in the past for other global optimization problems such as simple curve fitting [37] and inverse finite element problems [10,11,38]. As control parameters, we used a weighting factor that varied randomly from 0.5 to 1, a crossover constant of 0.9 and a number of trial vectors of 40. Such parameters were chosen using the knowledge we developed by solving previous global optimization problems [10,11,38]. The reader is referred to the work of Price et al. [36] for a better understanding of the differential evolution algorithm. To the best of our knowledge, the differential evolution algorithm has not been previously combined with a digital volume correlation algorithm; it is advantageous because it has been proved to be more robust than other genetic and non-genetic optimization algorithms in other contexts [36]. Owing to its demonstrated robustness, we have opted for not performing a pre-search (using translation as the only mode of deformation for each ROI), as other digital volume correlation implementations commonly require [30].
2.1.3. Computational speed improvements
Our three-dimensional tracking algorithm was written in C++ to take advantage of software/hardware performance enhancements. Because tracking the displacement of each point X is carried out independently from all other points, our algorithm can be parallelized safely, which was performed using openMP—an open interface for multiprocessing programming. Our simulations were run on a 12-core machine and therefore the tracking of 12 points could be performed simultaneously. We typically required 15 h of computational time to track the displacements of 10 000 points. Note that speed can be affected by factors such as optimization parameters, data noise and ROI size.
2.1.4. Displacement filtering
Although the differential evolution algorithm is robust, it can sometimes fail, resulting in erroneous displacement vectors. To remove such ‘bad’ vectors, we assumed that the ONH was a continuum and we used a displacement filter. Briefly, each displacement vector was compared with its neighbours within a 100 µm radius. Specifically, if the vector's magnitude deviated by more than 15% from the median magnitude in its neighbourhood, or if its direction deviated by more than 15° from the median direction in its neighbourhood, then this displacement vector was considered erroneous and removed from the vector list. These values (15% and 15°) were chosen empirically but represent local deformations that the ONH is unlikely to exhibit in vivo [39]. Such an empirical approach was found to be robust for all cases.
Following filtering, displacement vectors were smoothed in three dimensions using a cubic smoothing spline to further remove noise (function csaps in Matlab; smoothing parameter = 0). Vectors removed in the filtering step were replaced by results from such interpolation.
2.1.5. Strain calculations
Following the displacement filtering and smoothing steps, we computed the Green–Lagrange strain tensor at each material point. The effective strain [40], a single index that conveniently summarizes the three-dimensional state of strain, can be extracted as
| 2.8 |
Here, E1, E2 and E3 are the principal components of the Green–Lagrange strain tensor [41].
2.2. Artificial deformations to verify our algorithm
Our three-dimensional tracking algorithm was applied to three sets of ONH volumes (one undeformed and one deformed per set) in order to test its accuracy. The undeformed OCT volume (same for all sets) was obtained from a baseline OCT scan of a myopic (−6 diopter refraction), non-glaucomatous patient's ONH (size: 768 × 496 × 97 voxels; resolution: 6.25 × 3.87 × 33.3 µm; Spectralis OCT, Heidelberg Engineering, Germany). The corresponding deformed volume was obtained by application of a predetermined, artificial deformation to the baseline scan, using a morphing technique (i.e. inverse mapping). In other words, the baseline volumes are real OCT volumes, but the deformed volumes are simulated. The imposition of known deformations in this way is a standard verification technique, permitting us to assess the accuracy our three-dimensional tracking algorithm and is required before future studies using clinical deformations following a change in IOP. For this section, we considered the following four types of artificial deformations as illustrated in figure 3 as they are consistent with the deformations predicted by biomechanical simulations [19,42–44].
(1) A rigid body motion (translations: 11.1, −22.2 and 33.3 µm along the x, y and z axes, respectively; rotation: −2.86°, 2.86° and 2.86° about the x, y and z axes, respectively. This deformation is characterized by a mean displacement magnitude of 117 µm and a mean effective strain of 0.
(2) Three-dimensional radial expansion of the volume with a 1000 µm radius to mimic eye globe expansion induced by increased IOP. The centre of this latter deformation was ‘virtually’ located 12.5 mm away from the ONH to represent the centre of the eye globe. A rigid translation of 1000 µm along the axial direction (directed towards the centre of the eye) was also applied, so that the volume remains within the field of view. This deformation is characterized by a mean displacement magnitude of 107 µm and a mean effective strain of 0.08.
(3) The same three-dimensional radial expansion of the volume as in the item (2) but with a varying radius from 1000 to 500 µm to mimic increased IOP-induced eye globe expansion accompanied with tissue thinning. A rigid translation of 750 µm along the axial direction (directed towards the centre of the eye) was also applied, so that the volume remains within the field of view. This deformation is characterized by a mean displacement magnitude of 103 µm and a mean effective strain of 0.28.
(4) The same three-dimensional radial expansion of the volume as in the item (3) but with a radius varying nonlinearly (exponential behaviour) from 1000 to 750 µm to provide more realistic tissue thinning (higher in the retina, pre-laminar tissue and choroid than in the sclera and lamina cribrosa [45]). In addition, posterior bowing of the lamina cribrosa (as observed in [23]) was modelled using a three-dimensional Gaussian-type function applied to the centre of the three-dimensional volume (with a variance σ2 of 500 µm2 and a bowing magnitude Rmagnitude of 150 µm). In other words, a radius of
 was added to the entire three-dimensional expansion deformation to simulate bowing, where xc and yc are the lateral coordinates of the optic disc centre. Finally, a rigid translation of 875 µm along the axial direction (directed towards the centre of the eye) was also applied, so that the volume remained within the field of view. This deformation is characterized by a mean displacement magnitude of 137 µm and a mean effective strain of 0.19. The performance of our tracking algorithm can then be evaluated by comparing the extracted deformation with the imposed (known) deformation for all four cases.
Figure 3.
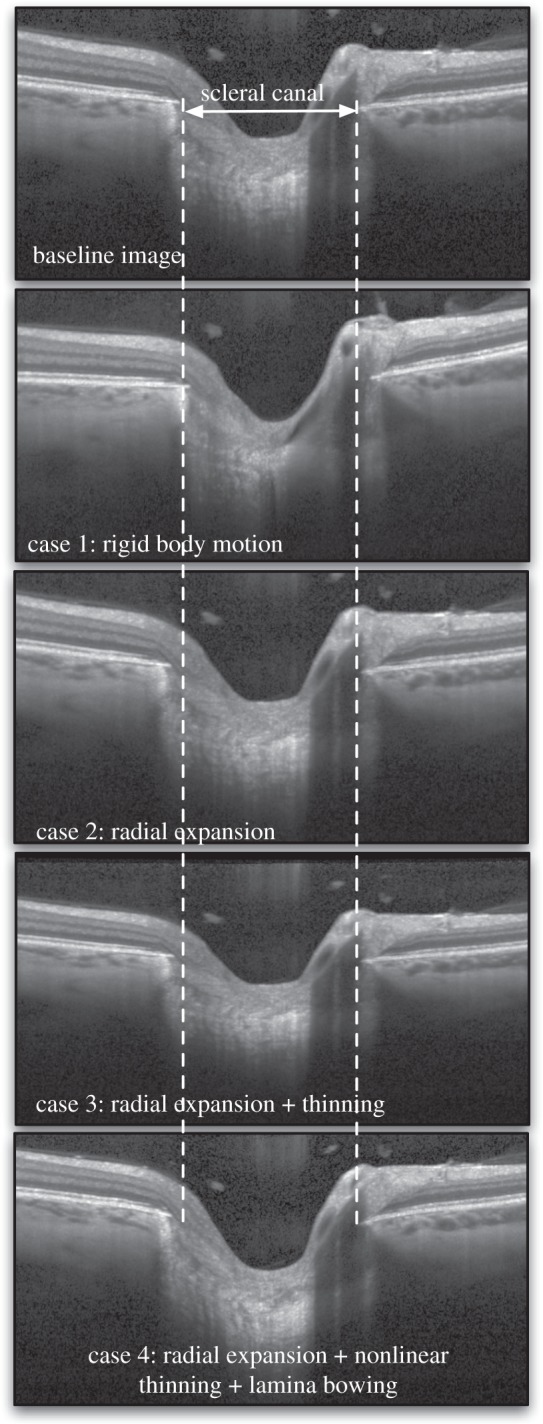
Four types of three-dimensional artificial deformations were applied to a baseline OCT volume using an inverse mapping technique. The same slice (slice no. 49 which is the middle slice) is shown for all volumes before (baseline) and after application of the artificial deformations. Case 1 represents a three-dimensional rigid body motion (tilting can be observed in the image). Case 2 represents radial expansion of the volume to mimic the effects of increased IOP (dashed lines emphasize the observed expansion of the scleral canal). Case 3 represents radial expansion together with tissue thinning in the radial direction to mimic the compression effects of increased IOP (dashed lines also indicate the expansion of the scleral canal). Case 4 represents radial expansion together with nonlinear tissue thinning to mimic higher thinning in the softer ocular layers (retinal, choroid and pre-laminar tissue), and posterior lamina cribrosa bowing as often observed in vivo [23]. Note that the deformations appear small but are consistent with those expected to occur in vivo.
2.3. Modelling optical coherence tomography speckle noise to test robustness
It has been shown that noise in OCT images arises from two main sources: the shot (electronic) noise, which is additive and can be described as a Gaussian white noise, and the speckle noise, which is multiplicative [46] and by far the most important in OCT. In this study, we aimed to evaluate the robustness of our three-dimensional tracking algorithm to speckle noise, which has not been previously undertaken in a digital volume correlation algorithm. Specifically, speckle noise was added to each deformed volume such that
| 2.9 |
in which I3 is the intensity of the newly obtained volume (deformed with speckle noise). The n values, which are different for each voxel, are randomly generated numbers that follow a negative exponential distribution, i.e.
| 2.10 |
This model has been shown to represent speckle noise in OCT images relatively well [46] as illustrated in figure 4. In addition, note that this model has no control parameters.
Figure 4.
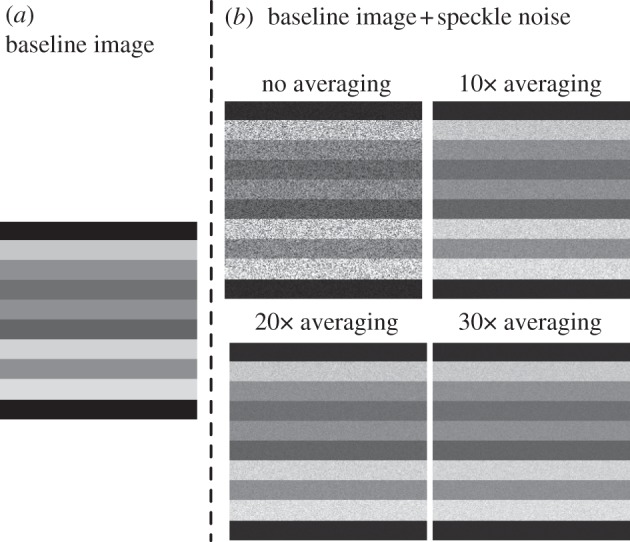
(a) An ‘idealized’ OCT image is represented with various shades of grey. (b) Speckle noise has been added to the baseline OCT image. Signal averaging was then performed to various degrees (1× or no averaging, 10×, 20× and 30×). Note that a small amount of signal averaging (e.g. 10×) can greatly reduce speckles. However, 30× averaging is still not sufficient to fully recover the ‘real’ signal.
2.4. Speckle noise reduction through signal averaging
OCT can acquire data in a remarkably fast manner (from 40 000 A-scans per second for spectral-domain OCT to 100 000 A-scans per second for swept source OCT). Most commercial devices are now able to perform signal averaging (i.e. averaging repeated acquisitions of the same object) in order to reduce speckle noise. In this study, we mimicked signal averaging by
| 2.11 |
where I4 is the intensity of a new OCT volume following signal averaging derived from I2, A is the total number of scans to create an average and nas are random numbers that follow a negative exponential distribution as in equation (2.10). We further tested our three-dimensional tracking algorithm with different levels of OCT speckle noise that can be achieved through signal averaging. We performed 1× (no averaging), 10×, 20× and 30× scan averages (figure 4). These signal-averaging values were chosen, because our group commonly uses them when performing raster scans in a clinical setting.
2.5. Modelling optical coherence tomography illumination variations to test robustness
Repeated OCT scans of the same eye may not exhibit identical illumination profiles owing to slight changes in eye orientation with respect to the OCT light source (e.g. subject's eye and head movements). Thus, here we aimed to verify the robustness of our three-dimensional tracking algorithm owing to changes in illumination. To this end, a clinical technician consecutively acquired five ONH volumes of the left eye of the aforementioned subject, over a 30 min time period, with identical acquisition parameters for all scans. All five volumes were then manually realigned. The first ONH volume was considered as the reference volume, from which the voxel intensity of all other volumes was assumed to vary owing to changes in illumination as:
| 2.12 |
where I1 is the voxel intensity of the first ONH volume, and Ii that of volume i. ki is the illumination mask for volume i, which contains information about illumination variations. Our goal was then to identify the four illumination masks from equation (2.12).
For each ONH volume, we computed the averaged voxel intensity (within 40 × 40 × 40 voxel ROIs) at the same eight corner locations of each ONH volume. Note that averaging was necessary to reduce influence from speckle noise. These experimental data were then used to derive the four illumination mask functions (ki(X) from equation (2.12)). Through linear regression, we found that the four illumination masks could be expressed as linear functions of the Cartesian coordinates (x,y,z) (R2-values of 0.94, 0.72, 0.78 and 0.91, respectively). These derived illumination masks were then applied to each deformed volume to test the robustness of our three-dimensional tracking algorithm to illumination variations (case 4 only).
2.6. Shadow removal, increased tissue visibility and contrast enhancement through adaptive compensation
OCT images of the ONH are usually hampered by the presence of shadow artefacts (cast by blood vessels) and by poor tissue visibility in deep tissue layers (i.e. sclera and lamina cribrosa). Both phenomena can impact the quality of the three-dimensional tracking. We have recently developed algorithms (standard [28,29,47,48] and adaptive compensation [49]) that were demonstrated to (i) significantly reduce shadow artefacts; (ii) improve tissue contrast; and (iii) increase the visibility of the deepest tissue layers (see example in figure 5). In this section, we applied adaptive compensation ([49]; contrast exponent = 2; energy threshold = 0.001) to baseline and deformed volumes (case 4 only) to verify the impact of shadow artefacts and low visibility on three-dimensional tracking.
Figure 5.
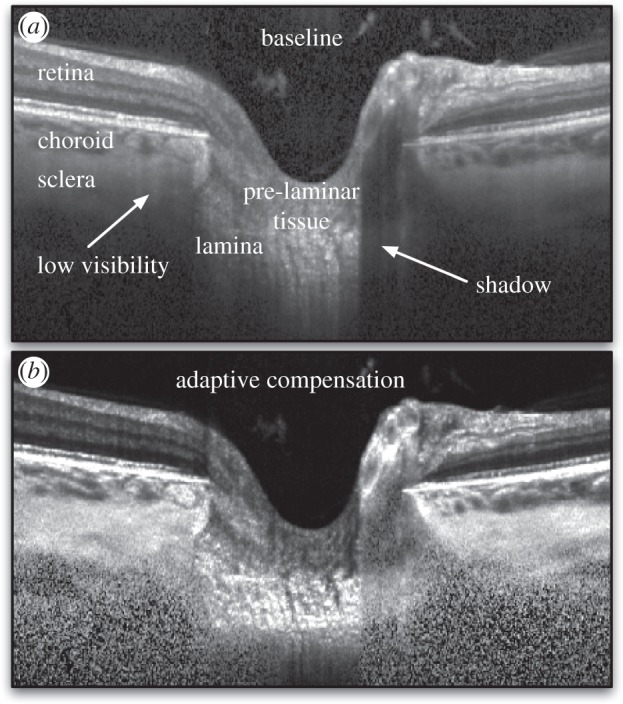
(a) Baseline OCT image (BScans) of a subject's ONH. Shadow artefacts and low tissue visibility at high depth are observed, which is due to light attenuation. (b) An adaptive compensation algorithm was developed to remove shadow artefacts, enhance tissue contrast and improve tissue visibility at high depth.
2.7. Application, additional sensitivity studies and error definition
For each test case, displacements were tracked at 1210 points in two areas of the ONH (605 points per area that formed a three-dimensional rectangular grid). One area was defined within the optic disc margin and incorporated the lamina cribrosa and the prelaminar tissue. The other area was defined in the peripapillary (outside the disc margin) region surrounding the ONH, including the retina, the choroid and the sclera.
We also tested the performance of our three-dimensional tracking algorithm by varying the ROI size (11 × 11 × 11, 21 × 21 × 21 or 31 × 31 × 21 voxels), and the number of optimization parameters used (with either three to account for rigid translation, six to account for rigid translation and rotation, or 12 to account for rigid translation, rigid rotation, shear and stretch).
For each case, we computed the total error (imposed versus extracted) in displacement magnitude as
 |
2.13 |
where DMimposed and DMextracted are the imposed (three cases above) and the extracted (using our tracking algorithm) displacement magnitudes, respectively. NP is the total number of material points. Similarly, the total error in effective strain was defined as
 |
2.14 |
where Eeff_imposed and Eeff_extracted are the imposed and the extracted effective strains. Finally, the total error in displacement direction, which reflects how much displacement vectors deviate in direction, was defined as
 |
2.15 |
where uimposed and uextracted are the imposed and the extracted three-dimensional displacement vectors. The function atan2 is the four-quadrant arctangent function.
3. Results
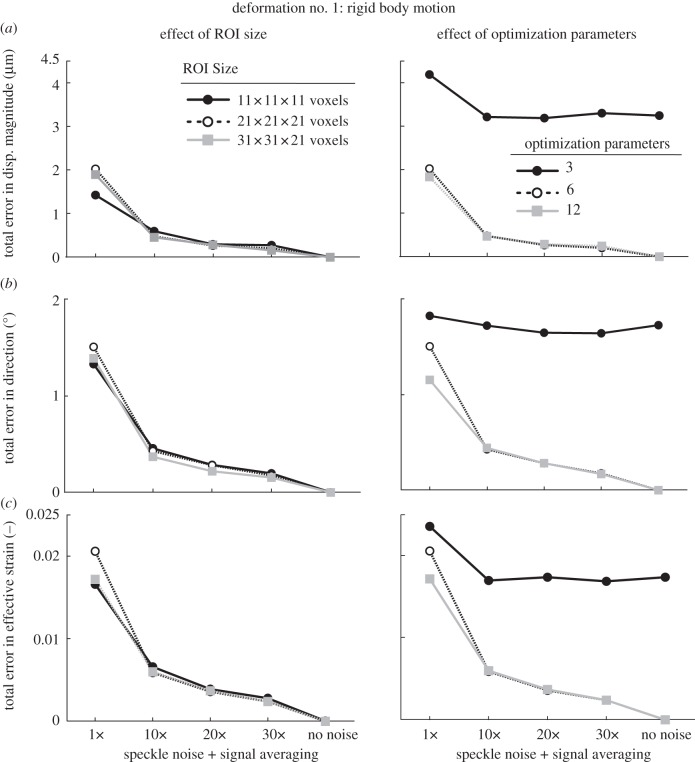
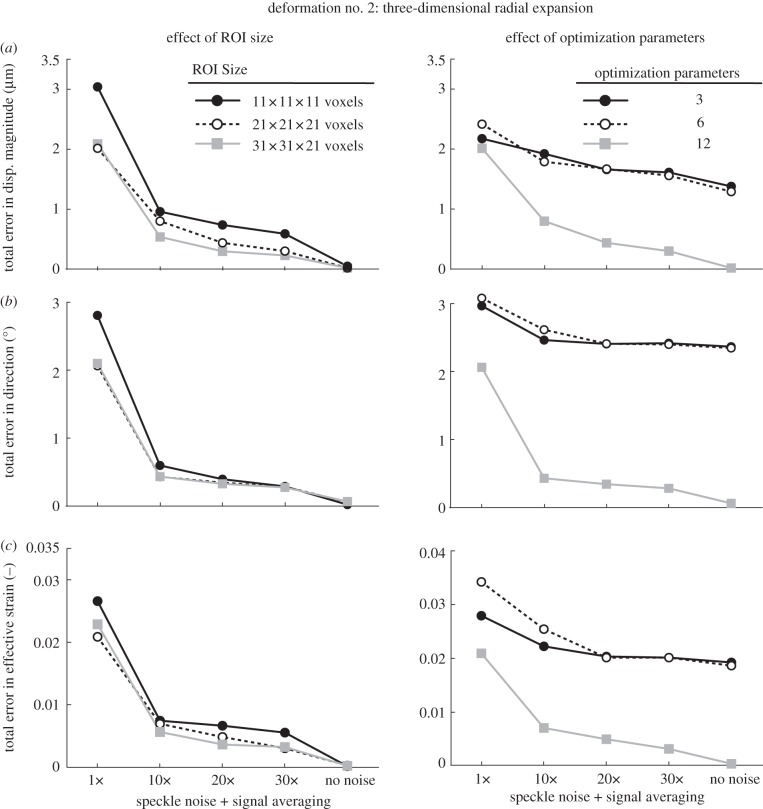
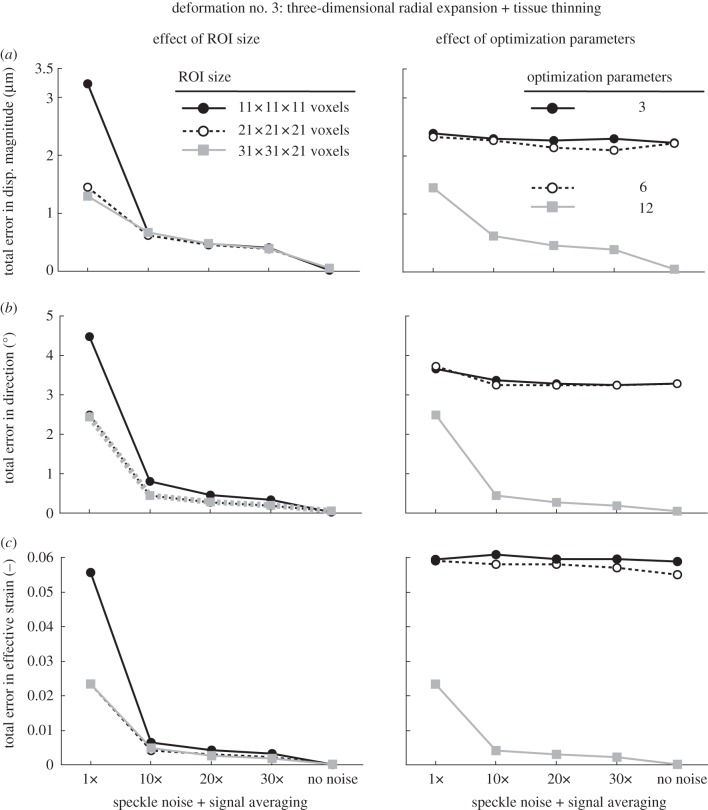
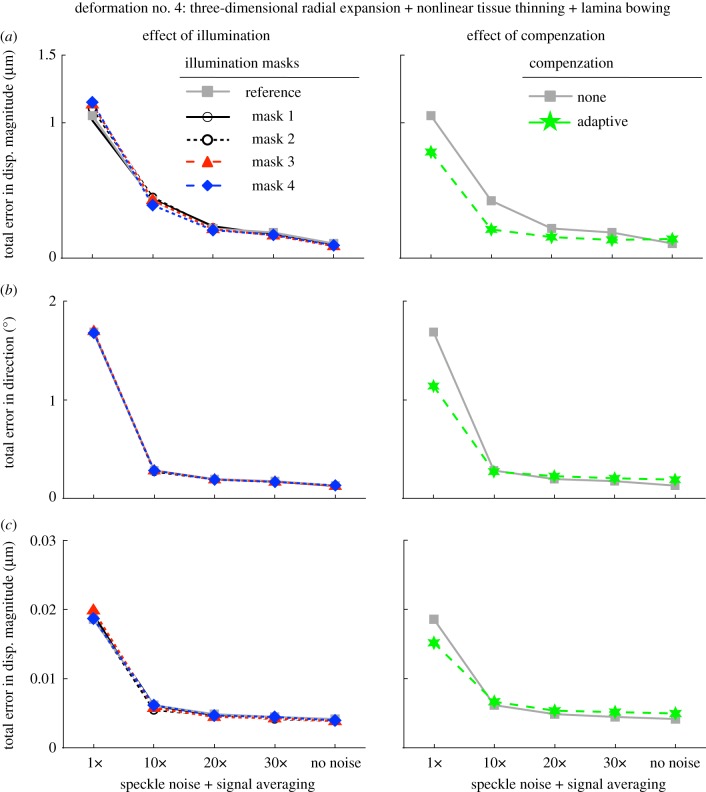
Total errors in displacement magnitude, displacement direction and in effective strain are depicted as functions of speckle noise amount (decreased through signal averaging) in figure 6 (rigid body motion), figure 7 (three-dimensional radial expansion), figure 8 (three-dimensional radial expansion with tissue thinning) and figure 9 (three-dimensional radial expansion with nonlinear tissue thinning and laminar bowing). For figures 6–8, the effect of varying ROI size (left column) and the total number of optimization parameters (right column) was tested. For figure 9, the effect of varying illumination condition (left column) and applying adaptive compensation (right column) was tested.
Figure 6.
Total errors (applied versus extracted) in (a) displacement magnitude, (b) displacement direction, and (c) effective strain are depicted as functions of speckle noise amount and signal averaging with varying ROI size (left column) and varying number of optimization parameters (right column; ROI size: 21 × 21 × 21 voxels). Here, the deformed OCT volume was obtained after applying a rigid body deformation to the undeformed (baseline) OCT volume (case 1, see text).
Figure 7.
Total errors (applied versus extracted) in (a) displacement magnitude, (b) displacement direction, and in (c) effective strain are depicted as functions of speckle noise amount and signal averaging with varying ROI size (left column) and varying number of optimization parameters (right column; ROI size: 21 × 21 × 21 voxels). Here, the deformed OCT volume was obtained after applying a three-dimensional radial expansion deformation to the undeformed (baseline) OCT volume.
Figure 8.
Total errors (applied versus extracted) in (a) displacement magnitude, (b) displacement direction, and in (c) effective strain are depicted as functions of speckle noise amount and signal averaging with varying ROI size (left column) and varying number of optimization parameters (right column; ROI size: 21 × 21 × 21 voxels). Here, the deformed OCT volume was obtained after applying a three-dimensional radial expansion deformation with tissue thinning to the undeformed (baseline) OCT volume.
Figure 9.
Total errors (applied versus extracted) in (a) displacement magnitude, (b) displacement direction, and in (c) effective strain are depicted as functions of speckle noise amount and signal averaging with varying illumination conditions (left column; ROI size: 31 × 31 × 21 voxels) and application of adaptive compensation (right column; ROI size: 31 × 31 × 21 voxels). Here, the deformed OCT volume was obtained after applying a three-dimensional radial expansion deformation with nonlinear tissue thinning and posterior laminar bowing to the undeformed (baseline) OCT volume.
3.1. Effect of speckle noise
When no speckle noise was added to the deformed volume, we found that our three-dimensional tracking algorithm performed extremely well with a best-case total error in displacement magnitude of 0.0004 µm, in displacement direction of 0.0002° and in effective strain of 0.000002; with added speckle, noise errors were markedly increased, to 4.2 µm, 4.5° and 0.06, respectively.
3.2. Effect of signal averaging
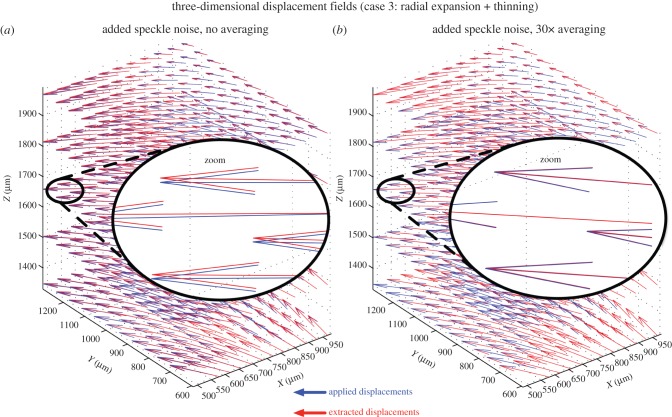
Overall, we found that signal averaging greatly improved the accuracy of the tracking algorithm as total errors decreased consistently with increased signal averaging in most cases (figures 6–8). We also observed that 10× signal averaging usually produced considerable improvements with respect to no signal averaging. For 10× signal averaging, best-case total errors were 0.45 µm, 0.36° and 0.0042. Further signal averaging (20× and 30×) produced quasi-linear and smaller improvements consistently. For 30× signal averaging, best-case total errors were reduced to 0.15 µm, 0.15° and 0.0019 (figure 10).
Figure 10.
Three-dimensional displacement fields (blue: applied or imposed; red: extracted using three-dimensional tracking) are shown for the volume deformation with the type 3 deformation (three-dimensional radial expansion of the ONH with tissue thinning). (a) Speckle noise has been added but no signal averaging has been performed. Although the applied and extracted displacement vectors are closely aligned, they do not match exactly. (b) Speckle noise has been added together with 30× signal averaging. An excellent match is found between applied and extracted displacement vectors (note the superimposed red and blue vectors).
3.3. Effect of illumination variations
From five successive acquisitions of the same subject's ONH, we found that tissue reflectivity (or OCT pixel intensity) varied on average by only 5.7% through comparison of the illumination masks. Such changes were almost indiscernible by visual examination of the OCT images. Overall, we found that the three-dimensional tracking algorithm was insensitive to varying illumination masks as shown in the left column of figure 8; furthermore, this conclusion held for any level of speckle noise that we tested.
3.4. Effect of shadow removal, increased tissue visibility and contrast enhancement
We found that application of adaptive compensation to the baseline and deformed ONH volumes was able to improve three-dimensional tracking (smaller errors in displacement magnitude/direction and effective strain; figure 9) when no signal averaging was performed. When signal averaging was used, we found that adaptive compensation gave slight improvements in displacement magnitude error, but slight impairments in displacement direction and effective strain errors (figure 9).
3.5. Effect of region of interest size
In the presence of speckle noise without averaging, increasing the ROI size could reduce total errors with deformation cases 2 and 3 (figures 7 and 8), whereas the opposite was observed with deformation case 1 (figure 6). In the presence of both speckle noise and signal averaging, increasing the ROI size yielded either no or slight improvements for all deformation cases (figures 6–8).
3.6. Effect of optimization parameters
When using only three optimization parameters (i.e. allowing each ROI to exhibit a rigid translation deformation only), we found that the accuracy of our algorithm was the poorest (figures 6–8). Best-case total errors were 2.4 µm in displacement magnitude, 1.8° in displacement direction and 0.02 in effective strain.
Increasing the optimization parameters from 3 to 6 (i.e. allowing each ROI to exhibit rigid translation and rotation, but no deformation), resulted in substantial improvements in deformation case 1 (figure 5) but not in deformation cases 2 and 3 (figures 7 and 8). Such behaviour is readily understandable as case 1 is itself a rigid body transformation (translation + rotation), whereas cases 2 and 3 do not contain rigid rotations.
Likewise, increasing the optimization parameters from 6 to 12 (i.e. using rigid translation, rigid rotation, stretch and shear as the permissible deformations for each ROI) resulted in major improvements in deformation cases 2 and 3 (figures 7 and 8) but not with case 1 (figure 6). This is to be expected as case 1 contains neither shear nor stretch, unlike cases 2 and 3.
4. Discussion and conclusion
In this study, we have developed an OCT-based three-dimensional tracking algorithm that could be used to map in vivo deformations of ONH tissues following a change in IOP. We have tested its accuracy using OCT images with predetermined and artificial deformations and assessed its robustness to speckle noise and illumination. Our algorithm was found to be accurate and can extract three-dimensional displacements with errors on the order of 1 µm, well below the OCT lateral resolutions used here (6.25 and 33.3 µm). Furthermore, in the presence of speckle noise, signal averaging was shown to produce excellent results. Changes in illumination conditions had negligible impact on tracking performance. We are now applying this algorithm to the tracking of in vivo deformations of the ONH following surgical IOP-lowering, and IOP increase in vivo and ex vivo.
The ability of our algorithm to track known displacements was found to be excellent with best-case total errors in displacement magnitude of 0.0004 µm, in displacement direction of 0.0002°, and in effective strain of 0.000002. When speckle noise was added to the images, our algorithm was still able to track displacements (figure 10); however, its performance was at its worst. Signal averaging, a common feature of most OCT scanners, was modelled and was shown to drastically improve the robustness of our algorithm against speckle noise. With 10× signal averaging, best-case total errors were 0.45 µm (displacement magnitude), 0.36° (displacement direction) and 0.0042 (effective strain). We currently observe strain levels exceeding 0.1 following IOP-lowering by trabeculectomy in glaucoma subjects [50], which suggests that the strain error in our algorithm will be acceptable with at least 10× scan averaging.
Total errors were further decreased with signal averaging. For 30 × signal averaging, best-case total errors were 0.15 µm, 0.15° and 0.0019, respectively. Overall, signal averaging produced nonlinear improvements, with large improvements observed with 10× signal averaging only, and smaller improvements observed with more than 10× signal averaging. These results suggest that high amounts of signal averaging (more than 10×) may not be required to obtain the necessary accuracy for quantification of ONH biomechanics. This is an advantage as an increase in signal averaging results in a proportional increase in OCT acquisition time.
We found that our three-dimensional tracking algorithm was extremely robust to changes in illumination conditions (figure 9). These changes were estimated and modelled using repeated scan acquisitions of the same subject's ONH. These results are consistent with the use of the ZNCC criterion, which is insensitive to any offset or scaling of the illumination conditions. It should also be emphasized that most commercial OCT systems will only acquire data if relatively constant illumination is achieved within the entire image. Thus, illumination variations should not pose a problem to three-dimensional tracking as long as longitudinal acquisitions are performed by suitably trained clinical technicians.
Our algorithm was also found to be more robust when adaptive compensation was applied to both the undeformed and deformed volumes (no speckle noise averaging; figure 9). This is likely due to the fact that contrast is enhanced and tissues are more visible through the compensation step, thus helping the global optimization procedure. However, improvements were not consistent when signal averaging was first applied (i.e. better error in displacement magnitude, but worse errors in displacement direction and effective strain). Because adaptive compensation has a tendency to increase noise (owing to signal amplification), it is likely that this compensated generated noise could affect tracking performance and a trade-off between compensation and signal averaging is observed.
It should be emphasized that our algorithm is able to track displacements with subvoxel resolution. For instance, when using signal averaging, most total errors were less than 1 μm even though OCT axial and lateral resolutions were 3.87, 6.25 and 33.3 µm. This is a considerable advantage comparing with manual displacement tracking methods used by other investigators [45,51] that cannot provide subvoxel accuracy. Because IOP-induced displacements of the ONH tissues are expected to be small [52,53], manual tracking techniques are unlikely to provide the necessary resolution required for proper biomechanical quantification of the ONH.
In this study, we also found that using 12 optimization parameters was necessary in order to obtain optimal tracking performance. For example, total error in effective strain was reduced from a high of 0.06 (three optimization parameters) to 0.0019 (12 optimization parameters) for case 3 (with 30× signal averaging). Because small IOP-induced deformations are expected in the ONH, in order to minimize the error, we strongly recommend the use of 12 optimization parameters rather than only 3, 6 or 9 as done in several studies that implemented digital volume correlation [32,34,54].
We also found that increasing the ROI size could further reduce total errors when signal averaging was used. However, the improvements were relatively small, suggesting that using a large ROI may not be necessary for three-dimensional tracking. This is an advantage as the use of smaller ROIs can result in a considerable increase in computational speed.
Several limitations exist in our study. First, we used only affine transformations to represent local deformations of the ONH tissues (i.e. local ROI deformations) rather than more complex deformations (e.g. quadratic) [33]. However, because each ROI is small with respect to the OCT volume, affine transformations at each ROI can be sufficient to fully characterize the ONH tissue deformations.
Second, we have evaluated only the algorithm's robustness to speckle noise, the dominant noise in OCT, and to changes in illumination conditions. In previous preliminary studies, we found that the shot noise (or Gaussian white noise) had a very small impact on three-dimensional tracking (data not shown). This is consistent with the fact that shot noise is usually influential when signal levels are very low. This is not the case for the ONH, as most of the ONH layers of biomechanical importance in glaucoma can be seen as bright or very bright. Other noise sources may include noise due to digitization and thermal detector noise, but like shot noise, their influence is usually small. Noise can also come from patients’ head movements and OCT registration error. However, the current OCT system we are using (Spectralis OCT from Heidelberg Engineering) is equipped with an additional imaging modality (confocal scanning laser ophthalmoscopy) that is used to reference the OCT images and allows ‘true’ anatomy measurements despite patient head movements. Potential changes in tissue optical properties from one OCT acquisition to the subsequent one could also be seen as a source of error; however, no study has yet reported reflectivity changes in glaucomatous connective tissues. Finally, birefringence artefacts [55] could potentially cause a problem, but they also have yet to be characterized properly.
Third, it is possible that errors under ‘real’ clinical deformation conditions could prove higher than those indicated here. As discussed, strain and displacement errors could arise from speckle noise, differing illumination profiles, light attenuation, changes in optical properties, birefringence artefacts, shot noise, image registration, patient movements or even from complex interactions among all these factors. While we have tried our best to verify the accuracy of our algorithm under multiple conditions, a validation step is still required for clinical acceptance of the methodology. Unfortunately, to date, there are no alternative methods to experimentally map displacement and strain within the ONH tissues, thus hampering direct validation of the proposed method. Further validation of the method will include manual tracking of in vivo deformations, or the use of alternative technologies when those become available. It is worth adding that improvement in in vivo ONH imaging resolution from adaptive optics [48] or μOCT [56] technology has strong potential to provide further credibility to three-dimensional tracking—a direction that we are currently investigating.
Our three-dimensional tracking algorithm is now being tested with OCT data captured in patients at different levels of IOP [50]. Our goal is to verify whether the biomechanical properties of each individual tissue layer of a patient's ONH can indicate susceptibility to glaucoma, and whether a correlation exists between IOP-induced strain and loss of visual function. Our long-term research goal is to develop tools to quantify the biomechanics of the ONH in vivo; this may have a strong potential to be used for the diagnosis of ONH disorders such as glaucoma.
The views expressed are those of the authors and not necessarily those of the NHS, the NIHR or the Department of Health.
Funding statement
This work was supported by the Ministry of Education, Academic Research Fund, Tier 1, Singapore (Girard), by an Imperial College Junior Research Fellowship, London, UK (Girard), by a Royal Society Wolfson Research Merit Award (Ethier) and by the National Institute for Health Research (NIHR) Biomedical Research Centre based at Moorfields Eye Hospital NHS Foundation Trust and UCL Institute of Ophthalmology (Strouthidis).
References
- 1.Quigley HA, Broman AT. 2006. The number of people with glaucoma worldwide in 2010 and 2020. Br. J. Ophthalmol. 90, 262–267. ( 10.1136/bjo.2005.081224) [DOI] [PMC free article] [PubMed] [Google Scholar]
- 2.Sigal IA, Roberts MD, Girard MJA, Burgoyne CF, Downs JC. 2009. Biomechanical changes of the optic disc. Ocular disease: mechanisms and management. New York, NY: Elsevier. [Google Scholar]
- 3.Sommer A, Tielsch JM, Katz J, Quigley HA, Gottsch JD, Javitt J, Singh K. 1991. Relationship between intraocular pressure and primary open angle glaucoma among white and black Americans. Baltimore Eye Survey Arch. Ophthalmol. 109, 1090–1105. ( 10.1001/archopht.1991.01080080050026) [DOI] [PubMed] [Google Scholar]
- 4.Leske MC, Wu SY, Hennis A, Honkanen R, Nemesure B. 2008. Risk factors for incident open-angle glaucoma: the Barbados eye studies. Ophthalmology 115, 85–93. ( 10.1016/j.ophtha.2007.03.017) [DOI] [PubMed] [Google Scholar]
- 5.Heijl A, Leske MC, Bengtsson B, Hyman L, Bengtsson B, Hussein M. 2002. Reduction of intraocular pressure and glaucoma progression: results from the early manifest glaucoma trial. Arch. Ophthalmol. 120, 1268–1279. ( 10.1001/archopht.120.10.1268) [DOI] [PubMed] [Google Scholar]
- 6.Maier PC, Funk J, Schwarzer G, Antes G, Falck-Ytter YT. 2005. Treatment of ocular hypertension and open angle glaucoma: meta-analysis of randomised controlled trials. BMJ 331, 134 ( 10.1136/bmj.38506.594977.E0) [DOI] [PMC free article] [PubMed] [Google Scholar]
- 7.Leske MC. 2007. Open-angle glaucoma—an epidemiologic overview. Ophthal. Epidemiol. 14, 166–172. ( 10.1080/09286580701501931) [DOI] [PubMed] [Google Scholar]
- 8.Burgoyne CF, Downs JC, Bellezza AJ, Suh JK, Hart RT. 2005. The optic nerve head as a biomechanical structure: a new paradigm for understanding the role of IOP-related stress and strain in the pathophysiology of glaucomatous optic nerve head damage. Prog. Retin. Eye Res. 24, 39–73. ( 10.1016/j.preteyeres.2004.06.001) [DOI] [PubMed] [Google Scholar]
- 9.Hommer A, Fuchsjager-Mayrl G, Resch H, Vass C, Garhofer G, Schmetterer L. 2008. Estimation of ocular rigidity based on measurement of pulse amplitude using pneumotonometry and fundus pulse using laser interferometry in glaucoma. Invest. Ophthalmol. Vis. Sci. 49, 4046–4050. ( 10.1167/iovs.07-1342) [DOI] [PubMed] [Google Scholar]
- 10.Girard MJ, Suh JK, Bottlang M, Burgoyne CF, Downs JC. 2009. Scleral biomechanics in the aging monkey eye. Invest. Ophthalmol. Vis. Sci. 50, 5226–5237. ( 10.1167/iovs.08-3363) [DOI] [PMC free article] [PubMed] [Google Scholar]
- 11.Girard MJ, Suh JK, Bottlang M, Burgoyne CF, Downs JC. 2011. Biomechanical changes in the sclera of monkey eyes exposed to chronic IOP elevations. Invest. Ophthalmol. Vis. Sci. 52, 5656–5669. ( 10.1167/iovs.10-6927) [DOI] [PMC free article] [PubMed] [Google Scholar]
- 12.Coudrillier B, Tian J, Alexander S, Myers KM, Quigley HA, Nguyen TD. 2012. Biomechanics of the human posterior sclera: age- and glaucoma-related changes measured using inflation testing. Invest. Ophthalmol. Vis. Sci. 53, 1714–1728. ( 10.1167/iovs.11-8009) [DOI] [PMC free article] [PubMed] [Google Scholar]
- 13.Strouthidis NG, Fortune B, Yang H, Sigal IA, Burgoyne CF. 2011. Effect of acute intraocular pressure elevation on the monkey optic nerve head as detected by spectral domain optical coherence tomography. Invest. Ophthalmol. Vis. Sci. 52, 9431–9437. ( 10.1167/iovs.11-7922) [DOI] [PMC free article] [PubMed] [Google Scholar]
- 14.Grytz R, Sigal IA, Ruberti JW, Meschke G, Downs JC. 2012. Lamina cribrosa thickening in early glaucoma predicted by a microstructure motivated growth and remodeling approach. Mech. Mater. 44, 99–109. ( 10.1016/j.mechmat.2011.07.004) [DOI] [PMC free article] [PubMed] [Google Scholar]
- 15.Fazio MA, Grytz R, Bruno L, Girard MJ, Gardiner S, Girkin CA, Downs JC. 2012. Regional variations in mechanical strain in the posterior human sclera. Invest. Ophthalmol. Vis. Sci. 53, 5326–5333. ( 10.1167/iovs.12-9668) [DOI] [PMC free article] [PubMed] [Google Scholar]
- 16.Girard MJ, Dahlmann-Noor A, Rayapureddi S, Bechara JA, Bertin BM, Jones H, Albon J, Khaw PT, Ethier CR. 2012. Quantitative mapping of scleral fiber orientation in normal rat eyes. Invest. Ophthalmol. Vis. Sci. 52, 9684–9693. ( 10.1167/iovs.11-7894) [DOI] [PubMed] [Google Scholar]
- 17.Sigal IA, Flanagan JG, Lathrop KL, Tertinegg I, Bilonick R. 2012. Human lamina cribrosa insertion and age. Invest. Ophthalmol. Vis. Sci. 53, 6870–6879. ( 10.1167/iovs.12-9890) [DOI] [PMC free article] [PubMed] [Google Scholar]
- 18.Sigal IA, Bilonick RA, Kagemann L, Wollstein G, Ishikawa H, Schuman JS, Grimm JL. 2012. The optic nerve head as a robust biomechanical system. Invest. Ophthalmol. Vis. Sci. 53, 2658–2667. ( 10.1167/iovs.11-9303) [DOI] [PMC free article] [PubMed] [Google Scholar]
- 19.Grytz R, Meschke G, Jonas JB. 2011. The collagen fibril architecture in the lamina cribrosa and peripapillary sclera predicted by a computational remodeling approach. Biomech. Model Mechanobiol. 10, 371–382. ( 10.1007/s10237-010-0240-8) [DOI] [PubMed] [Google Scholar]
- 20.Yang H, Williams G, Downs JC, Sigal IA, Roberts MD, Thompson H, Burgoyne CF. 2012. Posterior (outward) migration of the lamina cribrosa and early cupping in monkey experimental glaucoma. Invest. Ophthalmol. Vis. Sci. 52, 7109–7121. ( 10.1167/iovs.11-7448) [DOI] [PMC free article] [PubMed] [Google Scholar]
- 21.Strouthidis NG, Fortune B, Yang H, Sigal IA, Burgoyne CF. 2012. Longitudinal change detected by spectral domain optical coherence tomography in the optic nerve head and peripapillary retina in experimental glaucoma. Invest. Ophthalmol. Vis. Sci. 52, 1206–1219. ( 10.1167/iovs.10-5599) [DOI] [PMC free article] [PubMed] [Google Scholar]
- 22.Steinhart MR, Cone FE, Nguyen C, Nguyen TD, Pease ME, Puk O, Graw J, Oglesby EN, Quigley HA. 2012. Mice with an induced mutation in collagen 8A2 develop larger eyes and are resistant to retinal ganglion cell damage in an experimental glaucoma model. Mol. Vision 18, 1093–10106. [PMC free article] [PubMed] [Google Scholar]
- 23.Lee EJ, Kim TW, Weinreb RN. 2012. Reversal of lamina cribrosa displacement and thickness after trabeculectomy in glaucoma. Ophthalmology 119, 1359–1366. ( 10.1016/j.ophtha.2012.01.034) [DOI] [PubMed] [Google Scholar]
- 24.Park SC, Kiumehr S, Teng CC, Tello C, Liebmann JM, Ritch R. 2012. Horizontal central ridge of the lamina cribrosa and regional differences in laminar insertion in healthy subjects. Invest. Ophthalmol. Vis. Sci. 53, 1610–1616. ( 10.1167/iovs.11-7577) [DOI] [PubMed] [Google Scholar]
- 25.Strouthidis NG, Girard MJA. 2013. Altering the way the optic nerve head responds to intraocular pressure: a potential approach to glaucoma therapy. Curr. Opin. Pharmacol. 13, 83–89. ( 10.1016/j.coph.2012.09.001) [DOI] [PubMed] [Google Scholar]
- 26.Grytz R, Fazio MA, Girard MJ, Libertiaux V, Bruno L, Gardiner S, Girkin CA, Crawford Downs J. In press. Material properties of the posterior human sclera. J. Mech. Behav. Biomed. Mater. ( 10.1016/j.jmbbm.2013.03.027) [DOI] [PMC free article] [PubMed] [Google Scholar]
- 27.Kupersmith MJ, Sibony P, Mandel G, Durbin M, Kardon RH. 2011. Optical coherence tomography of the swollen optic nerve head: deformation of the peripapillary retinal pigment epithelium layer in papilledema. Invest. Ophthalmol. Vis. Sci. 52, 6558–6564. ( 10.1167/iovs.10-6782) [DOI] [PMC free article] [PubMed] [Google Scholar]
- 28.Foin N, Mari JM, Davies JE, Di Mario C, Girard MJ. 2013. Imaging of coronary artery plaques using contrast-enhanced optical coherence tomography. Eur. Heart J. Cardiovasc. Imaging 14, 85 ( 10.1093/ehjci/jes151) [DOI] [PubMed] [Google Scholar]
- 29.Foin N, Mari JM, Nijjer S, Sen S, Petraco R, Ghione M, Di Mario C, Davies JE, Girard MJA. 2013. Intracoronary imaging using attenuation-compensated optical coherence tomography allows better visualisation of coronary artery diseases. Cardiovasc. Revascularization Med. 14, 139–143. ( 10.1016/j.carrev.2013.03.007) [DOI] [PubMed] [Google Scholar]
- 30.Bay BK. 2008. Methods and applications of digital volume correlation. J. Strain Anal. Eng. Des. 43, 745–760. ( 10.1243/03093247JSA436) [DOI] [Google Scholar]
- 31.Verhulp E, Rietbergen Bv, Huiskes R. 2004. A three-dimensional digital image correlation technique for strain measurements in microstructures. J. Biomech. 37, 1313–1320. ( 10.1016/j.jbiomech.2003.12.036) [DOI] [PubMed] [Google Scholar]
- 32.Franck C, Hong S, Maskarinec S, Tirrell D, Ravichandran G. 2007. Three-dimensional full-field measurements of large deformations in soft materials using confocal microscopy and digital volume correlation. Exp. Mech. 47, 427–438. ( 10.1007/s11340-007-9037-9) [DOI] [Google Scholar]
- 33.Gates M, Lambros J, Heath M. 2011. Towards high performance digital volume correlation. Exp. Mech. 1–17. [Google Scholar]
- 34.Smith T, Bay B, Rashid M. 2002. Digital volume correlation including rotational degrees of freedom during minimization. Exp. Mech. 42, 272–278. ( 10.1007/BF02410982) [DOI] [Google Scholar]
- 35.Pan B, Qian K, Xie H, Asundi A. 2009. Two-dimensional digital image correlation for in-plane displacement and strain measurement: a review. Meas. Sci. Technol. 20, 062001 ( 10.1088/0957-0233/20/6/062001) [DOI] [Google Scholar]
- 36.Price KV, Storn RM, Lampinen JA. 2005. Differential evolution. A practical approach to global optimization. Berlin, Germany: Springer. [Google Scholar]
- 37.Girard M, Suh JK, Hart RT, Burgoyne CF, Downs JC. 2007. Effects of storage time on the mechanical properties of rabbit peripapillary sclera after enucleation. Curr. Eye Res. 32, 465–470. ( 10.1080/02713680701273792) [DOI] [PubMed] [Google Scholar]
- 38.Girard MJ, Downs JC, Bottlang M, Burgoyne CF, Suh JK. 2009. Peripapillary and posterior scleral mechanics-part ii: experimental and inverse finite element characterization. J. Biomech. Eng. 131, 051012 ( 10.1115/1.3113683) [DOI] [PMC free article] [PubMed] [Google Scholar]
- 39.Sigal IA, Flanagan JG, Ethier CR. 2005. Factors influencing optic nerve head biomechanics. Invest. Ophthalmol. Vis. Sci. 46, 4189–4199. ( 10.1167/iovs.05-0541) [DOI] [PubMed] [Google Scholar]
- 40.Aernouts J, Couckuyt I, Crombecq K, Dirckx JJJ. 2010. Elastic characterization of membranes with a complex shape using point indentation measurements and inverse modelling. Int. J. Eng. Sci. 48, 599–611. ( 10.1016/j.ijengsci.2010.02.001) [DOI] [Google Scholar]
- 41.Holzapfel GA. 2000. Nonlinear solid mechanics. A continuum approach for engineering. West Sussex. UK: John Wiley & Sons Ltd. [Google Scholar]
- 42.Sigal IA, Flanagan JG, Tertinegg I, Ethier CR. 2004. Finite element modeling of optic nerve head biomechanics. Invest. Ophthalmol. Vis. Sci. 45, 4378–4387. ( 10.1167/iovs.04-0133) [DOI] [PubMed] [Google Scholar]
- 43.Bellezza AJ, Hart RT, Burgoyne CF. 2000. The optic nerve head as a biomechanical structure: initial finite element modeling. Invest. Ophthalmol. Vis. Sci. 41, 2991–3000. [PubMed] [Google Scholar]
- 44.Girard MJ, Downs JC, Burgoyne CF, Suh JK. 2009. Peripapillary and posterior scleral mechanics-part I: development of an anisotropic hyperelastic constitutive model. J. Biomech. Eng. 131, 051011 ( 10.1115/1.3113682) [DOI] [PMC free article] [PubMed] [Google Scholar]
- 45.Agoumi Y, Sharpe GP, Hutchison DM, Nicolela MT, Artes PH, Chauhan BC. 2011. Laminar and prelaminar tissue displacement during intraocular pressure elevation in glaucoma patients and healthy controls. Ophthalmology 118, 52–59. ( 10.1016/j.ophtha.2010.05.016) [DOI] [PubMed] [Google Scholar]
- 46.Schmitt JM, Xiang SH, Yung KM. 1999. Speckle in optical coherence tomography. J. Biomed. Opt. 4, 95–105. ( 10.1117/1.429925) [DOI] [PubMed] [Google Scholar]
- 47.Girard MJ, Strouthidis NG, Ethier CR, Mari JM. 2011. Shadow removal and contrast enhancement in optical coherence tomography images of the human optic nerve head. Invest. Ophthalmol. Vis. Sci. 52, 7738–7748. ( 10.1167/iovs.10-6925) [DOI] [PubMed] [Google Scholar]
- 48.Kim TW, Kagemann L, Girard MJ, Strouthidis NG, Sung KR, Leung CK, Schuman JS, Wollstein G. In press. Imaging of the lamina cribrosa in glaucoma: perspectives of pathogenesis and clinical applications. Curr. Eye Res. [DOI] [PMC free article] [PubMed] [Google Scholar]
- 49.Mari JM, Strouthidis NG, Park SC, Girard MJ. 2013. Enhancement of lamina cribrosa visibility in optical coherence tomography images using adaptive compensation. Invest. Ophthalmol. Vis. Sci. 54, 2238–2247. ( 10.1167/iovs.12-11327) [DOI] [PubMed] [Google Scholar]
- 50.Girard MJA, Zimmo L, White E, Mari JM, Ethier CR, Strouthidis NG. 2012. Towards a biomechanically based diagnosis for glaucoma: in vivo deformation mapping of the human optic nerve head ASME 2012 Summer Bioengineering Conf.; June 20–23, Fajardo, Puerto Rico, 2012. [Google Scholar]
- 51.Reis AS, O'Leary N, Stanfield MJ, Shuba LM, Nicolela MT, Chauhan BC. 2012. Laminar displacement and prelaminar tissue thickness change after glaucoma surgery imaged with optical coherence tomography. Invest. Ophthalmol. Vis. Sci. 53, 5819–5826. ( 10.1167/iovs.12-9924) [DOI] [PubMed] [Google Scholar]
- 52.Yang H, Thompson H, Roberts MD, Sigal IA, Downs JC, Burgoyne CF. 2010. Deformation of the early glaucomatous monkey optic nerve head connective tissue following acute IOP elevation within 3-D histomorphometric reconstructions. Invest. Ophthalmol. Vis. Sci. 52, 345–363. ( 10.1167/iovs.09-5122) [DOI] [PMC free article] [PubMed] [Google Scholar]
- 53.Yang H, Downs JC, Sigal IA, Roberts MD, Thompson H, Burgoyne CF. 2009. Deformation of the normal monkey optic nerve head connective tissue following acute IOP elevation within 3-D histomorphometric reconstructions. Invest. Ophthalmol. Vis. Sci. 50, 5785–5799. ( 10.1167/iovs.09-3410) [DOI] [PMC free article] [PubMed] [Google Scholar]
- 54.Bay B, Smith T, Fyhrie D, Saad M. 1999. Digital volume correlation: three-dimensional strain mapping using X-ray tomography. Exp. Mech. 39, 217–226. ( 10.1007/BF02323555) [DOI] [Google Scholar]
- 55.Torzicky T, Pircher M, Zotter S, Bonesi M, Gotzinger E, Hitzenberger CK. 2012. High-speed retinal imaging with polarization-sensitive OCT at 1040 nm. Opt. Vis. Sci. 89, 585–592. ( 10.1097/OPX.0b013e31825039be) [DOI] [PubMed] [Google Scholar]
- 56.Liu L, Gardecki JA, Nadkarni SK, Toussaint JD, Yagi Y, Bouma BE, Tearney GJ. 2011. Imaging the subcellular structure of human coronary atherosclerosis using micro-optical coherence tomography. Nat. Med. 17, 1010–1014. ( 10.1038/nm.2409) [DOI] [PMC free article] [PubMed] [Google Scholar]


