

Abstract
Public policy and individual incentives determine the patterns of human mobility through transportation networks. In the event of a health emergency, the pursuit of maximum social or individual utility may lead to conflicting objectives in the routing strategies of network users. Individuals tend to avoid exposure so as to minimize the risk of contagion, whereas policymakers aim at coordinated behaviour that maximizes the social welfare. Here, we study agent-driven contagion dynamics through transportation networks, coupled to the adoption of either selfish- or policy-driven rerouting strategies. In analogy with the concept of price of anarchy in transportation networks subject to congestion, we show that maximizing individual utility leads to a loss of welfare for the social group, measured here by the total population infected after an epidemic outbreak.
Keywords: complex networks, epidemic spreading, human mobility
1. Introduction
Users of transportation networks adapt their routing strategies in response to public health emergencies. Changes in the patterns of individual mobility [1–3] are elicited by awareness of the presence of the disease in nearby areas, or imposed by the decisions of policymakers. In an abstract sense, rational travellers adjust their paths to maximize an individual utility function, which depends on travel time and perceived exposure to contagion risk. By contrast, policymakers attempt to enforce coordinated routing strategies that maximize the social welfare. Policy-driven routing, which is part of the so-called non-pharmaceutical interventions, may significantly reduce the frequency of infectious contacts, containing the transmission of diseases such as influenza [4]. Among other factors, the societal utility function includes measures of the total number of affected individuals, the spatial footprint of the infection, the costs of prophylaxis, vaccination and treatment, and the public perception of risk and comfort. The spread of the disease and the adoption of self-initiated or coordinated rerouting strategies are strongly coupled. Intuitively, the patterns of mobility through commuting networks modify the dynamics of the contagion process [5]. Conversely, the dynamics of the disease affect the public perception of the emergency, and determine both the difficulties of implementing the policy and the individual incentives to reduce the risk of being exposed to the disease.
Research on the efficiency of transportation networks subject to congestion demonstrates that routing strategies aimed at maximizing individual utility often lead to a loss of welfare for the social group as a whole [6–8]. Humans tend to follow shortest-path routes that formally minimize their travel times, but these selfish strategies may not yield the social optimum, in the sense that the average travel time increases (Pigou's example [6]). Selfish routing also leads to the counterintuitive effect that network improvements may degrade network performance (Braess' paradox [6]). These and other paradoxical scenarios raise a social dilemma between the pursuit of maximum individual utility and the search for social welfare. Within the framework of game theory, the best options for individual users yield a Nash equilibrium, not necessarily a social optimum [7,9,10]. The ratio of the total cost of the Nash equilibrium to the total cost of the social optimum is commonly referred to as the price of anarchy [10,11], indicating the inefficiency of decentralization [6,7], and the loss of social welfare due to the selfish behaviour of agents in the system.
Here, we extend the concept of price of anarchy to mobility-driven contagion dynamics. We study the influence of rerouting, elicited by individual awareness or imposed by public policy, on the dynamics of contagion through transportation networks. We assume that when individuals are aware of the outbreak and allowed to choose their route from origin to destination, they tend to avoid traversing areas where the disease has been detected. Policymakers, by contrast, strive to enforce coordinated mobility patterns where individuals are segregated according to their health state, thus minimizing the number of infectious contacts. We measure social welfare through the density of infected populations, and define the price of anarchy as the loss of welfare due to selfish rerouting, compared with the policy-driven coordination.
The spread of individual awareness and the adoption of policy emerge as central drivers of behavioural change. The role of awareness, understood as knowledge that individuals are willing to act upon [12], has been previously studied in the context of network science, both as a mechanism that reduces susceptibility, and therefore infection rates [12,13–16], and as the trigger of self-initiated behavioural changes [17]. Meloni et al. [17] analysed the impact of selfish rerouting on mobility-driven epidemic spreading. In their model, individuals, with a certain probability, avoid traversing infected areas rather than following the shortest path to their destination. Their numerical simulations suggest that individual behavioural changes aimed at slowing down and containing the epidemic may give rise to the opposite effect. In particular, they show simulations where the invasion threshold does not seem to change in spite of rerouting, and the size of the outbreak depends non-monotonically on the traffic through the system; for low traffic, rerouting has a positive effect on the global outbreak, whereas for high traffic, it increases the number of affected nodes.
An open problem is whether the propagation of awareness or policy adoption may enhance or mitigate the impact of an epidemic, in the context of mobility-driven contagion, and considering different rerouting strategies. At the origin of our study is the hypothesis that state-dependent routing behaviour, elicited by propagating awareness, exerts a powerful feedback on the contagion process, potentially impacting the invasion threshold and controlling the density of infected populations at long times. The policy question we want to address is whether the authorities should act to strictly enforce coordinated mobility strategies in the event of an outbreak, or individuals may be allowed to reroute freely without significant losses in social welfare. We test our hypothesis, and discuss its policy implications, through mean-field theories and Monte Carlo simulations on synthetic and data-driven network models.
2. Results
We assume that disease spreading and the propagation of behavioural changes share a common substrate—a commuting or mobility network—which we model as a heterogeneous, uncorrelated network [18,19]. The nodes of the network represent populated areas, and the links indicate mobility between populations. The spread of the infection is driven by the mobility of individuals along the links connecting nodes. Individuals travel from an origin node towards a destination node, choosing their path according to a certain routing strategy (figure 1).
Figure 1.
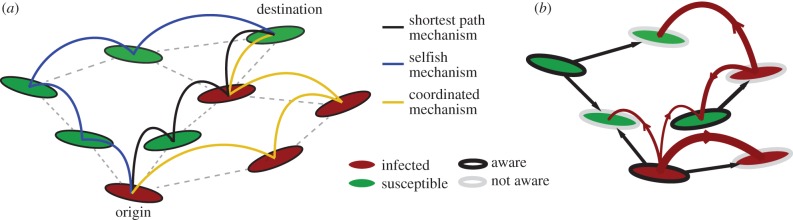
Pictorial illustration of the network model. (a) The three routing strategies studied in the model. An individual who is not aware of the disease travels to the destination through the shortest path. An aware individual that follows the coordinated routing and is located at an infected node is banned from visiting healthy nodes, and follows an ‘infected path’. An aware individual that adopts a selfish routing travels to its final destination following a ‘healthy path’. (b) The two contagion processes in the network—disease spreading and adoption of rerouting behaviour. The disease propagates via individual exchanges between the nodes (curved arrows), whereas awareness is adopted by non-aware nodes through topological diffusion (straight arrows). (Online version in colour.)
2.1. Infection models
The mathematical epidemiology usually lies on the most simplistic compartmental models of susceptible–infected–recovered (SIR) and susceptible–infected–susceptible (SIS). The SIR model framework is appropriate for infectious diseases that confer lifelong immunity, such as measles or whooping cough [20,21], influenza-like illness or the severe acute respiratory syndrome [22–24]. The SIS model is predominantly used for sexually transmitted diseases, such as chlamydia or gonorrhoea, where repeat infections are common [25], as well as for rotaviruses and many bacterial diseases [26].
Here, we are interested in the mechanisms that allow for the spread of the disease, irrespective of the long-term dynamics; that is, whether it will reach an equilibrium endemic state (SIS) or die out after an acute infection peak (SIR). We want to study the conditions by which the disease spreads through the network. In that sense, we are interested only in the early-time onset dynamics. From the perspective of the early-time behaviour, the time and spatial scales of the SIS and SIR models are similar.
We are interested in the mechanisms that allow for the spread of the disease in the first place rather than in the long-term equilibrium. In particular, we emphasize how the spreading process is influenced—enhanced or abated—by mobility and behavioural factors. From a long-term, or equilibrium, perspective, some diseases reach an equilibrium endemic state within the population, whereas other infectious processes die out after an acute infection peak. The former are better modelled by the SIS model, whereas the latter are better described by the SIR. If one adopts the goal of understanding the early process of disease spreading, either to reach an endemic state or to decay, we believe that it is less important to assume a specific late-time fate of the disease. Hence, we choose to work the minimalistic SIS model which allows for a more detailed analytical study of the epidemic thresholds, but we also show that our conclusions are relevant for diseases better described by the SIR model.
2.2. Classical metapopulation models
The traditional approach to model disease spreading coupled to human mobility relies on metapopulation—or bosonic—models [17,27–30]. In metapopulation networks, each node has an associated subpopulation of individuals. Infections, modelled as reaction processes, take place as a result of the interaction between individuals inside the subpopulations. For the sake of simplicity, it is customary to neglect the influence of internal heterogeneities, assuming full mixing, that is, that all individuals can come in contact with all other individuals. The infection spreads through the network driven by the mobility of individuals, which travel to other subpopulations in the network. In metapopulation networks, the modeller can incorporate a high level of detail in the specification of both the patterns of individual mobility and the type of infection/reaction process. It is also possible to include behavioural changes elicited by feedback [17]. The main disadvantage of these sophisticated models is that, when they are coupled to other processes that share the same substrate, such as the spread of awareness about the disease, it is very difficult to develop analytical results to quantify and rationalize the results observed through numerical simulation.
We use a conceptual model of traffic-driven epidemics, originally proposed by Meloni et al. [31]. As we show later, the model captures the relevant features of mobility-driven disease spreading, coupled to awareness and behavioural changes, in the sense that the results are statistically equivalent to those obtained with a detailed metapopulation model. The advantage is that the simplicity of our model allows us to derive analytical predictions, with reinforce and justify the conclusions derived from simulation.
2.3. A conceptual, simplified model
In our model, the nodes can be in the different compartments of the infection model, and the infection spreads from node to node in the system through the exchange of individuals. The model is fermionic, in the sense that the state of the node is an aggregate variable representing the state of its population. The mobility of individuals aims at representing the traffic heterogeneity in the system, but individuals do not have a particular state. Instead, they adopt the compartmental state of the nodes they traverse. While this description is not aimed at reproducing the detailed dynamics of human travel and recovery from infection, it is designed to capture the statistical signature of the coupled mobility-infection system. Furthermore, it allows us to make progress in the analytical description of the awareness-infection dynamics through the heterogeneous mean-field theory.
The compartmental dynamics of the contagion process is given by the SIS model, where nodes in the network, at any given time, may be either infected or susceptible to the infection. A susceptible node becomes infected with rate β—the infection rate—when it receives an individual from an infected node. Thus, the larger the number of individuals a healthy node receives from infected nodes, the higher the probability for that node to become infected. An infected node recovers from the infection, becoming susceptible again, with rate μ—the recovery rate. We assume that individuals adopt the health state of the nodes they visit, regardless of their state at the origin or previous legs of their trip. The total number of individuals in the system is λN, where N is the total number of nodes in the network and λ parametrizes the intensity of traffic through the system [31] (see Methods). The SIS model leads to a stationary endemic state in the limit of long times and system size [32]; we use the density of infected nodes at steady state as a measure of the intensity of the outbreak.
The role of network topology on epidemic spreading has attracted much attention [28,29,31,33]. Various studies have demonstrated the impact of connectivity through the statistics of the nodal degree—number of links of a node, k—and various measures of betweenness and centrality [30,32,34–36]. We jointly quantify the impact of network topology and routing strategies on the structure of traffic using the concept of algorithmic betweenness of a node i,  , which is the fraction of individual trajectories that traverse that node,
 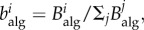 where
where  is the number of individuals node i receives [17,31,37]. This quantity is to be understood as a time average.
2.4. Behavioural changes: awareness, rerouting and policy
In addition to health state, we assign a state of awareness to each node. Awareness spreads through the network as a simple diffusive process [33] and, similar to the infection process, individuals adopt the awareness state of the nodes they traverse. Commuters leaving a non-aware node follow the shortest path between their origin and destination nodes, thus minimizing the number of steps along their path. Commuters leaving aware nodes change their routing strategy; we consider a self-initiated routing behaviour, and a policy-driven, or coordinated, strategy. In the selfish rerouting strategy, aware individuals favour routes that avoid infected nodes, irrespective of their own state. In the policy-driven strategy, individuals coordinate their mobility patterns to minimize the global impact of the outbreak. A natural strategy to reach the social optimum is the segregation of travellers according to their health state. Thus, healthy individuals follow routes along which they have minimal exposure to the disease, whereas infected individuals are banned from visiting healthy nodes.
It is important to emphasize the limits of policy-driven strategies. Because there are costs associated with implementing the policy, it may not be feasible to enforce it, in spite of its potential benefits. Those costs are both material, due to the resources that need to be deployed for the policy to be successful, and in the form of loss of freedom for the individuals. We assume a canonical, perhaps unrealistic policy, where the coordinated action is a nearly-optimal strategy. The role of this idealized coordinated action is to use it as a reference to define the price of anarchy, even if this strategy may be too costly in practice.
We implement the different routing strategies through a cost-function approach. At a given time, individuals move from the node they are located at to a neighbour node, in such a way that a certain cost-function is minimized. In the selfish case, we adopt the cost-function proposed in [17], Cj = −Xj + hδj, where Xj is either −1 if node j is infected, or +1 if it is susceptible. The term hδj is introduced to enforce the choice of shortest-path routes when two destinations are possible according to health state. Hence,  is a small positive number, and δj is equal to −1 if j is one step closer to the destination, 0 if the node j is at the same distance to the destination as node i is, and +1 otherwise. In the coordinated strategy, we propose the following cost-function:
In the case of an SIR type of infection, in both strategies, individuals located at recovered nodes move through the shortest path to their destination.
In our model, rerouting is a stochastic process: we define the degree of awareness of an aware node i, ωi(t), as the probability that an individual inside that node abandons the shortest path and adopts either the selfish or coordinated strategies.
2.5. Mean-field equations
In the heterogeneous mean-field (HMF) approach [29,31,33,37], nodes with the same number of links—or degree k—are deemed statistically identical. Hence, we may replace nodal variables by degree-aggregates, and seek balance laws for the evolution of the density of nodes of a given degree that are, e.g. infected or aware. This modelling framework has been successfully applied to describe a wide variety of dynamical processes in complex networks, from epidemic spreading [33] and activator–inhibitor systems [38], to coupled oscillators [39] and voter models [40]. Assuming that there are no topological or dynamic correlations in our system, the HMF approach offers a clear framework to derive analytical expressions for the epidemic threshold in network models of contagion [29,31–33].
Consider the evolution of the relative density of infected nodes, ρk(t), as well as the relative density of aware nodes,  , with degree k. The mean-field evolution equations for the two spreading processes are
| 2.1 |
and
| 2.2 |
The first terms on the right-hand side represent recovery from infection and loss of awareness, respectively, whereas the second terms model activation. The activation term of the infection process reflects the probability that a node of degree k belongs to the healthy class, (1 − ρk), and is infected with rate β when it receives an individual from an infected node, hence the factor  . The probability that an individual travels through a link that points to an infected node, Φ, has contributions from the aware individuals, as well as from the non-aware ones. The activation term for the awareness process quantifies the probability that non-aware nodes,
  , become aware via a neighbour node. The probability of this event is proportional to the adoption rate βaw, the number of neighbours, k and the probability that a given link points to an infected node, Ψ. The structure of the probabilities Φ and Ψ is key for the dynamics of the coupled system (2.1)–(2.2), and determines the critical parameter values beyond which an outbreak propagates through the network: the invasion thresholds. The above mean-field representation assumes that the time scales of the epidemic process, the mobility of individuals and the spread of awareness are the same. More precisely, we assume that the characteristic time scale for all these processes is one day.
2.6. Invasion thresholds
We assume that the awareness process (equation (2.2)) is independent from the infection process, so the classical results for diffusive processes in networks apply [33]. For an uncorrelated network, Ψ takes the form 
 , and the invasion threshold is simply
  [33], where
  denotes averaging over all the nodes in the network. When the adoption rate, βaw, is larger than this critical value, the spreading of awareness causes an endemic state in the system, with a non-zero fraction of aware nodes at steady state. Topological heterogeneities reduce the critical value of the awareness activation rate; in particular, it has been shown that the threshold vanishes for infinite size, scale-free networks with degree exponent 2 ≤ γ ≤ 3 [32,41].
One of the central contributions of this study is the derivation of the invasion threshold for the infection process, which is subject to strong feedback from the spread of awareness. In the case of selfish rerouting, the probability Φ can be written as
| 2.3 |
The first term inside the brackets models the influence of individuals that travel from the non-aware nodes, whereas the second models the non-rerouting individuals that travel from aware nodes and the third one the rerouting individuals. Imposing stationarity in equation (2.1), we arrive at the epidemic threshold condition,
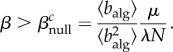 |
2.4 |
Remarkably, the critical infection rate does not depend on the dynamics of the adoption process; more precisely, the threshold is independent from the degree of awareness, ω, and from the density of aware nodes in the system, ρaw.
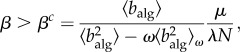
Coordinated rerouting changes the structure of Φ. Our numerical simulations suggest that, in the policy-driven case, the contribution from the aware individuals is much smaller than that from non-aware ones. Intuitively, infected individuals that adopt the policy travel along paths of infected nodes, vastly reducing the frequency of infectious contacts. Hence, considering only the contribution of the non-aware individuals, the probability Φ reads
| 2.5 |
This form of Φ leads to the invasion threshold
 |
2.6 |
where  denotes the second moment of the algorithmic betweenness over the aware nodes in the system.
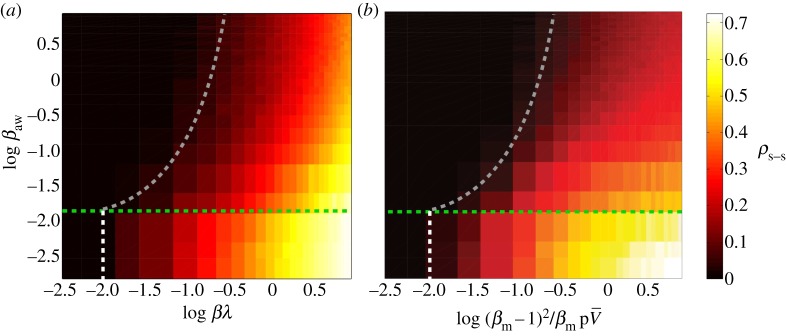
The above thresholds reveal a fundamental difference between the selfish and policy-driven routing strategies: with coordinated routing, awareness plays a central role in the onset of the outbreak, whereas self-initiated changes do not alter the threshold. The rich phase diagram of conceptual outcomes for the system yields further intuition of the relevance of policy action (figure 2). In the region where both policy and the disease itself are able to spread through the network, a more effective enforcement of the coordinated routing policy increases the invasion threshold, rendering a system that is more resistant against epidemic outbreaks (figure 2a). By contrast, even a broad-based adoption of self-initiated rerouting is unable to increase the invasion threshold, implying that decreasing individual contagion risk may not decrease the societal risk (figure 2b). In the following sections, we provide quantitative measures of these differences, through simulations on synthetic and realistic mobility networks.
Figure 2.
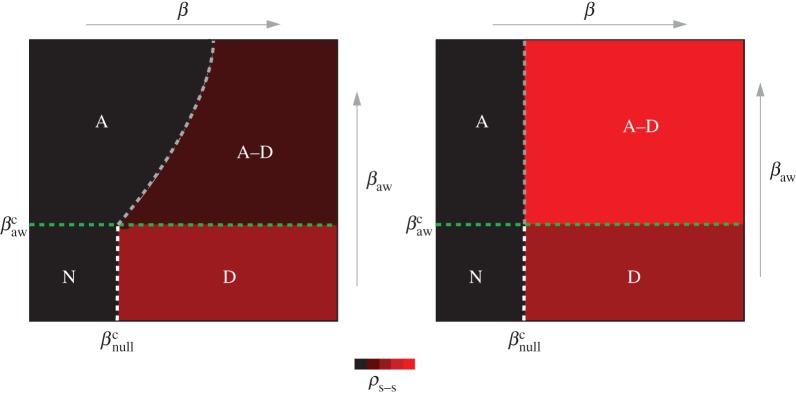
Phase diagram of the coupled contagion processes at steady state. The phase diagram for the prevalence of the two spreading processes in the case of (a) coordinated and (b) selfish awareness. The diagram is divided in four regions: (N) Neither disease spreading, nor awareness adoption, cause an outbreak in the system. (D) The prevalence of the disease causes an endemic state, while awareness dies out exponentially fast. (A) There is an endemic state of awareness in the system at equilibrium, whereas the disease dies out exponentially fast. (A–D) Both awareness and disease spread through the system and reach endemic states. The mean-field assumption predicts that the invasion threshold changes in the presence of coordinated awareness in the system, but it remains unchanged in the case of selfish awareness. With black, we denote the absorbing phase and with red the active phase for the disease spreading. The boundary curve between the region A and A–D in (a) represents the epidemic threshold condition. For a given network topology and a set of parameters, it is given by equation (2.6). (Online version in colour.)
2.7. Monte Carlo simulations on synthetic networks
To investigate the intensity of the epidemic as a function of network topology and model parameters, and to discuss the price of anarchy when selfish routing is allowed, we perform Monte Carlo simulations on synthetic uncorrelated, scale-free networks of N = 5000 nodes (see Methods for implementation details). We measure the density of infected nodes at equilibrium, averaged over 100 realizations, both for the case of coordinated action and selfish rerouting. We consider networks with two different levels of node–degree heterogeneity, γ = 2 and γ = 3.3.
We illustrate the importance of the spread of policy adoption by first considering that all nodes in the network are aware, and the degree of awareness ω is constant. In this particular case, the invasion threshold (2.6) becomes
 |
2.7 |
This prediction agrees nicely with our numerical simulations (figure 3), which show a mild dependence on network topology.
Figure 3.
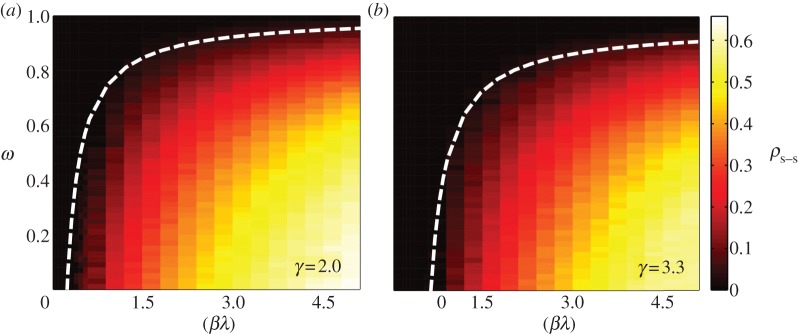
Monte Carlo simulations with global policy adoption. We show the density of infected nodes at the steady state, as a function of the degree of awareness, ω, and the product of the infection rate by the traffic parameter βλ, for two scale-free networks with different level of heterogeneity. We use networks of size N = 5000 nodes, and average the results over 100 realizations. The white dashed lines show the theoretical invasion threshold, calculated with equation (2.7). (Online version in colour.)
Figure 4 summarizes the main theoretical contributions of this study. We compare the analytical results derived using the HMF approach with Monte Carlo simulations of the full coupled model, with either policy-driven (figure 4a) or selfish (figure 4b) rerouting. Our HMF theory accurately predicts the different transitions observed in the numerical simulations, confirming the conceptual phase diagram depicted in figure 2. These numerical simulations allow us to quantify the price of anarchy as the difference between the density of infected nodes at equilibrium for the coordinated and selfish strategies (figure 4c). The salient features of the behaviour of this system arise from the strong nonlinearities induced by the coupling: while the selfish rerouting seems to reduce the intensity of the infection for mild diseases, it has a negative effect for more aggressive diseases, causing a larger fraction of infected subpopulations. The loss of welfare due to selfish rerouting, compared with the policy-driven action, denotes the price of anarchy during disease spreading in mobility networks (figure 4c). The price of anarchy increases for more heterogeneous network substrates (smaller γ), and as the enforcement of policy increases (larger βaw). It is also higher for more aggressive diseases (larger β).
Figure 4.

Monte Carlo simulations with spreading policy/awareness. (a) Density of infected nodes the steady state, ρ, as a function of the product βλ and the adoption of awareness rate βaw that initiates policy made rerouting behaviour, for two synthetic scale-free networks with different degree exponents. (b) Density of infected nodes at steady state as a function of the infection rate and the adoption of awareness rate that initiates selfish rerouting behaviour, for the same synthetic networks. Shown with dashed lines are the predictions of the mean-field assumption for the phase diagram separation thresholds. (c) The price of anarchy as a function of the two reaction rates for the two synthetic networks. We use recovery rates, μ = μaw = 1 and we set the degree of awareness ω = 0.8 for both the coordinated and selfish rerouting strategies. The results are averaged over 100 realizations. (Online version in colour.)
To test our hypothesis about the use of the SIS contagion model, and the generality of the conclusions, we present Monte Carlo simulations using the SIR compartmental model (figure 5). The SIR model is more appropriate to describe Influenza-like diseases (e.g. H1N1 [22,23]), and the severe acute respiratory syndrome [24]. We first explore the early-time onset dynamics for both SIR and SIS models (figure 5a), and we conclude that at early times, time and spatial scales of both models are similar. Furthermore, in figure 5b, we present the global attack of an SIR outbreak (density of subpopulations that experienced the infection) in a policy-driven scenario as a function of the disease reaction rate and the adoption of awareness rate. It is clear that similar conclusions for the effect of a policy-driven action can also be drawn in the case of an SIR infection model (see figure 4a).
Figure 5.
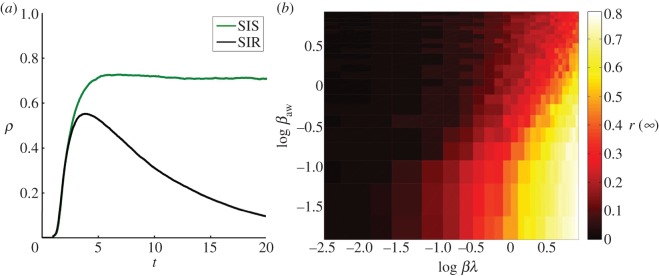
Policy-driven behavioural changes on an SIR epidemic model. (a) Time evolution of the density of infected subpopulations, under a policy-driven behaviour, for the SIS and SIR infection models. The infection rate is β = 2.25, the awareness adoption rate has value βaw = 0.25, and we set the traffic parameter to λ = 5. The degree of awareness is equal to ω = 0.8 and the recovery rates are equal to μ = 1/4 and μaw = 1. (b) The global attack (r(t = ∞)) as a function of the product βλ and the adoption of awareness rate βaw that initiates policy-driven rerouting behaviour. The degree of awareness is equal to ω = 0.8 and we use unit recovery rates. The substrate network is uncorrelated, scale-free with degree exponent equal to γ = 3.2 and of size N = 5000 nodes (subpopulations). The results are averaged over 50 realizations. (Online version in colour.)
2.8. Comparison between our conceptual model and a classical metapopulation model
Using numerical simulations and simple theoretical arguments, we compare the predictions of our conceptual model with those of a more detailed metapopulation model, where we introduce behavioural changes (see Methods). Because the parameters used by these two models are different, so it is not obvious in principle how these calculations should be compared. We put forward a rescaling argument that allows to quantify whether the two models yield the same behaviour under equivalent infection rates and traffic density. Consider the invasion threshold for the canonical metapopulation model which, ignoring behavioural changes, can be expressed as (see Methods):
 |
2.8 |
In expression (2.8), R0 = βm/μm is the recovery rate of the metapopulation model, p is the rate of individual travel, N is the total number of subpopulations in the system and  is the average number of individuals per node. Equations (2.4) and (2.8) suggest that the conceptual and metapopulation models should be compared by considering the traffic-weighted infection rates
  and
and  , respectively.
We take this scaling relationship one step further, and use it to investigate whether the theoretical results derived for our conceptual model are also representative in the case of coordinated, policy-driven behaviour in a metapopulation model. Using the expression for the invasion threshold in the conceptual model, equation (2.6), and introducing the effective infection rate of the metapopulation model, we arrive at the invasion threshold:
 |
2.9 |
To test this theory, we plot the intensity of the infection computed using the conceptual and metapopulation models for various parameter values, and rescale the axes according to the above effective infection rates (figure 6). Qualitatively, the two models seem to be equivalent in their predictions of the role of coordinated action on disease spreading. Their quantitative match is also remarkable, in particular the fact that, under the suggested rescaling, the invasion threshold derived for our conceptual model seems to capture the transition in the metapopulation model as well. We conclude that the two models are basically equivalent from a statistical viewpoint.
Figure 6.
Comparison between the conceptual and metapopulation models: Monte Carlo simulations with spreading policy/awareness. (a) Conceptual model. Density of infected nodes at the steady state, ρ, as a function of the product βλ and the adoption of awareness rate βaw that initiates policy-driven rerouting behaviour. Shown with dashed lines are the predictions of the mean-field assumption for the phase diagram separation thresholds. (b) Metapopulation model. Density of infected subpopulations (subpopulations with Ii/Vi > 1%) at steady state as a function of the quantity  and the adoption of awareness rate βaw that initiates policy-driven rerouting behaviour. The green dashed line is the threshold of the awareness spreading
  , the white line represents the threshold in equation. (2.8), and the grey line is the a priori prediction of the invasion threshold in the presence of policy-driven awareness in the metapopulation model (equation (2.9)). The substrate network is uncorrelated, scale-free with degree exponent equal to γ = 2 and of size N = 5000 nodes (subpopulations). The degree of awareness in the both cases is equal to ω = 0.8 and all recovery rates are set equal to unit. For the metapopulation model, we use a total number of V = 3 × 10⁶ individuals. The results are averaged over 50 realizations. (Online version in colour.)
2.9. Data-driven simulations
We apply our methodology to a more realistic scenario where the substrate for the spreading processes is the commuting network of the United States. The nodes in the network represent the 3141 counties in the contiguous US, and the links between nodes represent daily commuting fluxes. We perform Monte Carlo simulations, with commuters distributed among the different counties according to traffic (see Methods). Epidemic spreading in the USA commuting network is mainly driven by high traffic disorder, which leads to very heterogeneous spreading patterns. In figure 7 (inset), we show a sample realization of our model, where we observe the spreading patterns of infection and awareness, respectively, for both the selfish and coordinated rerouting strategies, two weeks after an outbreak at NYC county.
Figure 7.

Coupled information and epidemics in the US commuting network. The price of anarchy, two weeks after an epidemic starts from each county in the East Coast of the United States. The results are averaged over 50 realizations. (Inset) A snapshot of the epidemic two weeks after it is initiated at the New York City county, in the presence of selfish and coordinated awareness. Dark red colours denote high densities of infection,  . We average over 100 mobility and disease realizations. We use total traffic parameter λ = 5, reproductive numbers, R0 = 2,
  and recovery rates,
  . We further assume that individuals spend 1/3 days (eight working hours) at the final destination before returning back home, and 1/24 days (1 h) at each of the intermediate counties. We set the degree of awareness to ω = 0.8 for both the coordinated and selfish rerouting strategies.
The propagation of a disease depends strongly on the position of the initial seeding, due to traffic and topology heterogeneities [30,36]. The different system responses to an outbreak suggests that policy decisions need to account for the properties of the network as a whole, but also about the specific local transmission mechanisms and mobility patterns. We compute the price of anarchy for an infection starting at each one of the 2654 counties in the Eastern part of the contiguous US (figure 5). Owing to traffic disorder, we observe strong spatial heterogeneity in the price of anarchy values, depending on the origin of the outbreak. Individuals living near the major interstate highways of the East Coast (I-80 from New York City to San Francisco, CA; I-85 from Petersburg, VA to Montgomery, AL; and I-95 from the Canadian Border to Miami, FL) have the incentive of a fast commute to neighbouring counties. As a consequence, counties surrounding those commuting corridors have, in general, a larger proportion of commuters compared with other regions in the USA. By contrast, the POA for epidemic spreading in areas of low commute flux is small, and therefore imposing policy-initiated action does not render substantial benefits for the containment of the epidemic.
3. Discussion
Feedbacks between human behaviour, policy action and the dynamics of contagion through mobility networks shape the footprint of infectious outbreaks, alter the disease transmission mechanisms and determine the suitability of policies aimed at abating the epidemic by reducing the frequency of infectious contacts. In this study, we test the hypothesis that rerouting behaviour, elicited by propagating awareness, can fundamentally change the patterns of disease spreading through mobility networks, both in terms of the invasion threshold and the total intensity of the outbreak. Our theoretical and simulation results support this hypothesis, and reveal a rich phase diagram of potential outcomes depending on the rerouting strategy and the dynamics of contagion and awareness.
Consistent with previous simulation studies on self-initiated behavioural responses in mobility-driven contagion, we find that selfish rerouting does not change the invasion threshold. As we report here, this is true even when the epidemic process is coupled to the spreading of awareness. From a policy perspective, this result suggests that individual efforts to avoid infectious contacts may not help the social welfare; in fact, the density of infected populations at steady state is higher in the case of selfish rerouting than in the base scenario of shortest-path routing. By contrast, policy-driven coordination, which strives to mitigate the epidemic at the societal level, increases the invasion threshold and decreases the intensity of the infection. The price of anarchy, which we quantify through numerical simulations, reveals the essential differences between the selfish and coordinated strategies in terms of their impact on the spreading of the epidemics.
These results pose a social dilemma, where policymakers and social agents need to find a balance between the pursuit of individual utility and the preservation of social welfare. In this study, we show that the price of anarchy is related to the nature of the disease, the topology of the network substrate and the resources deployed to enforce adoption of coordinated action. Such a quantitative analysis should provide valuable predictions to inform policy decisions about whether coordinated rerouting should be strongly enforced, or self-initiated behaviour is allowed. Our map of the price of anarchy in the Eastern part of the United States illustrates this dilemma and suggests strategies for the deployment of measures intended to contain an outbreak. The price of anarchy to epidemic spreading exhibits strong heterogeneity, controlled by the proximity to major commuting corridors such as the interstate highways. This categorical identification of population centres, ranked by their price of anarchy, may provide disease-control authorities with a priori information of the benefits of implementing mobility restrictions in the event of an outbreak.
4. Methods
4.1. Numerical simulations of the conceptual model on synthetic networks
We consider scale-free graphs generated by the uncorrelated configuration model [42] with power law degree distribution P(k) ∼ k−γ and  . A number of λN individuals are initially placed in the system randomly and uniformly. Individuals move through the shortest paths to randomly chosen destinations with velocity of one node-to-node jump per time step. Once the mobility process reaches equilibrium, we infect randomly 1% of the nodes. We assume that these initially selected nodes are also aware of the disease. Individuals inside aware nodes are forced to travel through the system according to the coordinated or selfish routine strategies by minimizing the corresponding cost-functions, taking into account the value of the degree of awareness ω. We implement both the SIS and SIR compartmental models. In the SIS model, a node can be either susceptible to the disease or infected. An infected node becomes healthy with a recovery rate μ. For the sake of simplicity and without loss of generality, we set μ = 1. A susceptible node becomes infected with probability
  , where β is the infection rate and υI is the number of individuals the node receives from an infected node in the time interval (t,t + δt). In the SIR model, a node can be in three discrete states: susceptible to the disease, infected, or recovered/immune. An infected node recovers and becomes immunized with a recovery rate μ. At the same time, a susceptible node becomes infected with probability Pinf, as described above. Synchronously, we model the diffusion of awareness as an additional contagion process in the system. An aware subpopulation forgets about the information with rate μaw, which we set equal to 1. On the other hand, a non-aware node adopts the information with probability
  , where βaw is the rate of spreading of awareness, and kaw is the number of aware neighbours. When the system reaches equilibrium, we compute the density of infected nodes, ρ. We average our results over 100 model realizations.
4.2. Numerical implementation of metapopulation model
We consider scale-free metapopulation networks of size N generated by the uncorrelated configuration model [33] with degree distribution exponent γ. The population of each node i is assigned randomly according to  , where bi is the betweenness centrality of the node and
  is the average number of individuals per node in the system. The mobility of the individuals is defined as follow: at every time step, each of the Vi individuals of subpopulation i starts a trip with probability p. We assume that the destinations j are randomly chosen proportionally to their population. Individuals then move along the shortest paths to their destination nodes with velocity one jump per time step. After the mobility model reaches equilibrium, we infect a small number of individuals. Specifically, we randomly choose a small fraction of subpopulations (less than 1%) and within these subpopulations we infect 1% of the individuals. In each node i, an SIS dynamics takes place over a well-mixed population Vi(t). A susceptible individual becomes infected with probability
  , and an infected individual recovers with probability μmδt, where βm and μm are the disease reaction and recovery rates and Ii the number of infected individuals inside i. Synchronously, we model the diffusion of awareness as an additional contagion process in the system. An aware subpopulation forgets about the information with rate μaw. On the other hand, a non-aware node j adopts the information with probability
  , where βaw is the rate of spreading of awareness, and
  is the number of aware neighbours. We assume that the set of nodes with initially infected individuals are also aware of the disease. An individual inside an aware node with probability ω (the degree of awareness) reroutes from the shortest path to the destination and moves according to the policy-driven strategy as described in the main text. When the system reaches equilibrium, we compute the density of infected nodes, ρ, assuming that a node i is infected if Ii/Vi > 1%. We average our results over 50 realizations.
4.3. Global invasion threshold in metapopulation model
We consider a metapopulation network of size N and degree distribution P(k), where each node i represents a subpopulation with Vi individuals. We set the population size proportional to the topological betweenness. We assume the mobility process in which each individual in a node i, with a probability p, travels to a destination node j that is randomly selected with probability proportional to its size Vj. Travellers reach their destinations following the shortest path. A convenient representation of the system is provided through quantities defined in terms of the degree k. Lets assume that a small set of initially infected subpopulations of degree k,  , is experiencing an outbreak with R0 = βm/μm > 1, where βm and μm are the infection and recovery rates, respectively. In the early stage of the process, the number of subpopulations experiencing an outbreak is small, and the disease spreading at the level of metapopulation system can be described as a branching process, using a tree-like approximation relating the infected subpopulations
  at generation n to the infected subpopulations
  at generation n − 1 [28,37]. The average number of infected individuals at equilibrium in a subpopulation k of population Vk is αVk, where α is a disease-dependent parameter equal to α = (R0 − 1)/R0 [43]. Each infected individual stays in the infectious state for an average period
  . Thus, the total number of infected individuals circulating through the network at the n − 1 generation is
  . Those individuals can trigger the start of the epidemic in a susceptible subpopulation i with probability
  , where
  is the number of infectious individuals in generation n − 1 that have visited the subpopulation. The number of infected individuals that will pass through a subpopulation of degree k will be proportional to the algorithmic betweenness
  . For the n-th generation, we have
 where the second term on the right-hand side is the probability that the subpopulation is not already seeded by infected individuals, and the last term is the probability that the new seeded population will experience an outbreak. At the early times of the process and for R0 ∼ 1, equation (2.8) can be approximated by
  . Considering at equilibrium
  , where
  is the average population size and by defining
  , we have that
  . The above self-consistent equation defines the global invasion threshold in equation (2.8). This threshold condition unveils the influence of the model parameters, as well as the mobility patterns, on the spreading dynamics. The invasion threshold decreases with total traffic, and the condition R0 > 1 for the global invasion is recovered for high mobility rates. Furthermore, the threshold condition depends on the routing protocol, through the first and second moments of the algorithmic betweenness.
4.4. Data-driven simulations
Data on commuting trips between counties in the United States are available online (http://www.census.gov/population/www/cen2000/commuting/index.html). The files were compiled from Census 2000 responses to the long-form questions on where individuals worked. The files provide data at the county level for residents of the 50 states and the District of Columbia (DC). The data contain information on 34 000 commuters in N = 3141 counties. We build the non-symmetric traffic matrix F where its entry Fij denotes the number of individuals travelling from county i to county j and, by considering only commuting flow up to 25 miles outside the borders of each county, we construct the immediate neighbour flux matrix Fim. We initialize the system by randomly placing 5N individuals in the system. The destination of an individual located at county i is chosen randomly among the set neighbour counties {j} (i.e. Fij > 0), with probability proportional to the flux Fij. Individuals travel through the system following a ‘shortest path’ to their destinations by maximizing the total traffic of the route segments,  . After this training period reaches equilibrium, we assign ‘home counties’ to individuals, and we add the additional mobility rule of recurrent patterns. We make sure that the distribution of the population assigned after this initial training period correlates well with the actual populations from the census dataset. We then infect the county of consideration. We assume that this initially selected county is also aware of the disease. With probability ω, individuals inside aware nodes reroute from the ‘shortest path’ to their destinations and follow either a policy-driven or a selfish path. We implement the epidemic and awareness spreading models as described for the synthetic network simulations. We average our results over 50 model realizations.
Acknowledgements
C.N., L.C.F. and R.J. designed research; C.N., L.C.F. and R.J. performed research; C.N., L.C.F. and R.J. wrote the paper. The authors declare no competing financial interests. The authors thank Marta Gonzalez and Cesar Hidalgo for discussions.
Funding statement
C.N. acknowledges financial support through the MIT Vergottis Graduate Fellowship.
References
- 1.Brockmann D, Hufnagel L, Geisel T. 2006. The scaling laws of human travel. Nature 439, 462 ( 10.1038/nature04292) [DOI] [PubMed] [Google Scholar]
- 2.González MC, Hidalgo CA, Barabási A-L. 2008. Understanding individual human mobility patterns. Nature 453, 779–782. ( 10.1038/nature06958) [DOI] [PubMed] [Google Scholar]
- 3.Schneider CM, Belik V, Couronné T, Smoreda Z, González MC. 2013. Unravelling daily human mobility motifs. J. R. Soc. Interface 10 ( 10.1098/rsif.2013.0246) [DOI] [PMC free article] [PubMed] [Google Scholar]
- 4.Hatchett RJ, Mecher CE, Lipsitch M. 2007. Public health interventions and epidemic intensity during the 1918 influenza pandemic. Proc. Natl Acad. Sci. USA 104, 7582–7587. ( 10.1073/pnas.0610941104) [DOI] [PMC free article] [PubMed] [Google Scholar]
- 5.Belik V, Geisel T, Brockmann D. 2011. Natural human mobility patterns and spatial spread of infectious diseases. Phys. Rev. X 1, 011001 ( 10.1103/PhysRevX.1.011001) [DOI] [Google Scholar]
- 6.Roughgarden T. 2005. Selfish routing and the price of anarchy. Cambridge, MA: MIT Press. [Google Scholar]
- 7.Youn H, Gastner MT, Jeong H. 2008. Price of anarchy in transportation networks: efficiency and optimality control. Phys. Rev. Lett. 101, 128701 ( 10.1103/PhysRevLett.101.128701) [DOI] [PubMed] [Google Scholar]
- 8.Roughgarden T. 2003. The price of anarchy is independent of the network topology. J. Comp. Syst. Sci. 67, 341–364. ( 10.1016/S0022-0000(03)00044-8) [DOI] [Google Scholar]
- 9.Nash JF. 1950. Equilibrium points in n-person games. Proc. Natl Acad. Sci. USA 36, 48–49. ( 10.1073/pnas.36.1.48) [DOI] [PMC free article] [PubMed] [Google Scholar]
- 10.Koutsoupias E, Papadimitriou CH. 1999. Worst-case equilibria. In Proc. 16th Annual Symp. on Theoretical Aspects of Computer Science, pp. 404–413. Berlin, Germany: Springer Verlag. [Google Scholar]
- 11.Papadimitriou C, Valiant G. 2010. A new look at selfish routing. In (ed. A Chi-Chih Yao) Innovations in Computer Science (ICS2010). Beijing, China: Tsinghua University Press. [Google Scholar]
- 12.Funk S, Salathé M, Jansen VAA. 2010. Modelling the influence of human behaviour on the spread of infectious diseases: a review. J. R. Soc. Interface 7, 1247–1256. ( 10.1098/rsif.2010.0142) [DOI] [PMC free article] [PubMed] [Google Scholar]
- 13.Bauch CT, Earn DJD. 2004. Vaccination and the theory of games. Proc. Natl Acad. Sci. USA 101, 13 391–13 394. ( 10.1073/pnas.0403823101) [DOI] [PMC free article] [PubMed] [Google Scholar]
- 14.Epstein JM, Parker J, Cummings D, Hammond RA. 2008. Coupled contagion dynamics of fear and disease: mathematical and computational explorations. PLoS ONE 3, e3955 ( 10.1371/journal.pone.0003955) [DOI] [PMC free article] [PubMed] [Google Scholar]
- 15.Funk S, Gilad E, Watkins C, Jansen VAA. 2009. The spread of awareness and its impact on epidemic outbreaks. Proc. Natl Acad. Sci. USA 106, 6872–6877. ( 10.1073/pnas.0810762106) [DOI] [PMC free article] [PubMed] [Google Scholar]
- 16.Perra N, Balcan D, Gonçalves B, Vespignani A. 2011. Towards a characterization of behavior-disease models. PLoS ONE 6, e23084 ( 10.1371/journal.pone.0023084) [DOI] [PMC free article] [PubMed] [Google Scholar]
- 17.Meloni S, Perra N, Arenas A, Gómez S, Moreno Y, Vespignani A. 2011. Modeling human mobility responses to the large-scale spreading of infectious diseases. Sci. Rep. 1, no. 62. ( 10.1038/srep00062) [DOI] [PMC free article] [PubMed] [Google Scholar]
- 18.Albert R, Barabási A-L. 2002. Statistical mechanics of complex networks. Rev. Mod. Phys. 74, 47–97. ( 10.1103/RevModPhys.74.47) [DOI] [Google Scholar]
- 19.Barabási A-L. 2009. Scale-free networks: a decade and beyond. Science 325, 412–413. ( 10.1126/science.1173299) [DOI] [PubMed] [Google Scholar]
- 20.Anderson RM, May RM, Anderson B. 1992. Infectious diseases of humans: dynamics and control. Oxford, UK: Oxford University Press. [Google Scholar]
- 21.Rohani P, Earn DJD, Grenfell BT. 2000. The impact of immunization on pertussis transmission in England and wales. Lancet 355, 285–286. ( 10.1016/S0140-6736(99)04482-7) [DOI] [PubMed] [Google Scholar]
- 22.Fraser C, et al. 2009. Pandemic potential of a strain of influenza A (H1N1): early findings. Science 324, 1557–1561. ( 10.1126/science.1176062) [DOI] [PMC free article] [PubMed] [Google Scholar]
- 23.Balcan D, et al. 2009. Seasonal transmission potential and activity peaks of the new influenza A(H1N1): a Monte Carlo likelihood analysis based on human mobility. BMC Med. 7, 45 ( 10.1186/1741-7015-7-45) [DOI] [PMC free article] [PubMed] [Google Scholar]
- 24.Colizza V, Barrat A, Barthélemy M, Valleron A-J, Vespignani A. 2007. Modeling the worldwide spread of pandemic influenza: baseline case and containment interventions. PLoS Med. 4, 95–110. ( 10.1371/journal.pmed.0040013) [DOI] [PMC free article] [PubMed] [Google Scholar]
- 25.Garnett GP, Anderson RM. 1996. Sexually transmitted diseases and sexual behavior: insights from mathematical models. J. Infect. Dis. 174, S150–S161. ( 10.1093/infdis/174.Supplement_2.S150) [DOI] [PubMed] [Google Scholar]
- 26.Parashar UD, Hummelman EG, Bresee JS, Miller MA, Glass RI. 2003. Global illness and deaths caused by rotavirus disease in children. Emerg. Infect. Dis. 9, 565–572. ( 10.3201/eid0905.020562) [DOI] [PMC free article] [PubMed] [Google Scholar]
- 27.Colizza V, Pastor-Satorras R, Vespignani A. 2007. Reaction-diffusion processes and metapopulation models in heterogeneous networks. Nat. Phys. 3, 276–282. ( 10.1038/nphys560) [DOI] [Google Scholar]
- 28.Colizza V, Vespignani A. 2007. Invasion threshold in heterogeneous metapopulation networks. Phys. Rev. Lett. 99, 148701 ( 10.1103/PhysRevLett.99.148701) [DOI] [PubMed] [Google Scholar]
- 29.Vespignani A. 2012. Modelling dynamical processes in complex socio-technical systems. Nat. Phys. 8, 32–39. ( 10.1038/nphys2160) [DOI] [Google Scholar]
- 30.Nicolaides C, Cueto-Felgueroso L, González MC, Juanes R. 2012. A metric of influential spreading during contagion dynamics through the air transportation network. PLoS ONE 7, e40961 ( 10.1371/journal.pone.0040961) [DOI] [PMC free article] [PubMed] [Google Scholar]
- 31.Meloni S, Arenas A, Moreno Y. 2009. Traffic-driven epidemic spreading in finite-size scale-free networks. Proc. Natl Acad. Sci. USA 106, 16 897–16 902. ( 10.1073/pnas.0907121106) [DOI] [PMC free article] [PubMed] [Google Scholar]
- 32.Castellano C, Pastor-Satorras R. 2012. Competing activation mechanisms in epidemics on networks. Sci. Rep. 2, 371 ( 10.1038/srep00371) [DOI] [PMC free article] [PubMed] [Google Scholar]
- 33.Pastor-Satorras R, Vespignani A. 2001. Epidemic spreading in scale-free networks. Phys. Rev. Lett. 86, 3200–3203. ( 10.1103/PhysRevLett.86.3200) [DOI] [PubMed] [Google Scholar]
- 34.Freeman LC. 1977. A set of measures of centrality based on betweenness. Sociometry 40, 35–41. ( 10.2307/3033543) [DOI] [Google Scholar]
- 35.Barrat A, Barthélemy M, Pastor-Satorras R, Vespignani A. 2004. The architecture of complex weighted networks. Proc. Natl Acad. Sci. USA 101, 3747–3752. ( 10.1073/pnas.0400087101) [DOI] [PMC free article] [PubMed] [Google Scholar]
- 36.Kitsak M, Gallos LK, Havlin S, Liljeros F, Muchnik L, Stanley HE, Makse HA. 2010. Identification of influential spreaders in complex networks. Nat. Phys. 6, 888–893. ( 10.1038/nphys1746) [DOI] [Google Scholar]
- 37.Balcan D, Vespignani A. 2011. Phase transitions in contagion processes mediated by recurrent mobility patterns. Nat. Phys. 7, 581–586. ( 10.1038/nphys1944) [DOI] [PMC free article] [PubMed] [Google Scholar]
- 38.Nakao A, Mikhailov AS. 2010. Turing patterns in network-organized activator–inhibitor systems. Nat. Phys. 6, 544–550. ( 10.1038/nphys1651) [DOI] [Google Scholar]
- 39.Arenas A, Guilera AD, Kurths J, Moreno Y, Zhou C. 2008. Synchronization in complex networks. Phys. Rep. 469, 93–153. ( 10.1016/j.physrep.2008.09.002) [DOI] [Google Scholar]
- 40.Baronchelli A, Castellano C, Pastor-Satorras R. 2011. Voter models on weighted networks. Phys. Rev. E 83, 066117 ( 10.1103/PhysRevE.83.066117) [DOI] [PubMed] [Google Scholar]
- 41.Pastor-Satorras R, Vespignani A. 2002. Epidemic dynamics in finite size scale-free networks. Phys. Rev. E 65, 035108(R) ( 10.1103/PhysRevE.65.035108) [DOI] [PubMed] [Google Scholar]
- 42.Catanzaro M, Boguñá M, Pastor-Satorras R. 2005. Generation of uncorrelated random scale-free networks. Phys. Rev. E 71, 027103 ( 10.1103/PhysRevE.71.027103) [DOI] [PubMed] [Google Scholar]
- 43.Barthélemy M, Godréche C, Luck J-M. 2010. Fluctuation effects in metapopulation models: Percolation and pandemic threshold. J. Theory Biol. 267, 554–564. ( 10.1016/j.jtbi.2010.09.015) [DOI] [PubMed] [Google Scholar]