

Abstract
Clarithromycin is an antibacterial widely used for the treatment of a myriad of infections. Various methods including HPLC have been reported for its drug plasma concentration but they are more complex. In this study, we developed an electrochemical method for estimation of clarithromycin in blood using differential pulse polarography (DPP) after oral administration of pure clarithromycin suspension. The differential pulse polarography of clarithromycin showed peak with peak potential Ep is −1460 mV SCE at pH 6.5 ± 0.1. The developed electrochemical method was standardized and validated for the determination of clarithromycin in blood serum of albino rats. PK analysis included Cmax, Tmax, AUC0-24, elimination rate constant (Kel) and t1/2. Cmax were found to be 1.34 ± 0.16 mg/ml and 1.99 ± 0.22 mg/ml for plain clarithromycin and suspension formulation, respectively. Effects of ammonium tartarate concentration and pH were also studied as specificity parameters. Developed electrochemical method was found to be simple, accurate method for to estimate blood-clarithromycin profile and can also be used similarly for various dosage forms.
Keywords: Clarithromycin, Polarography, Electrochemical, Serum
1. Introduction
Clarithromycin, 6-O-methylerythromycin (PubChem Compound ID: 84029), is a semi-synthetic broad antibacterial spectrum macrolide antibiotic, widely used for the treatment of a myriad of infections such as those caused by Haemophilus influenza and Mycobacterium avium etc.1 Number of methods has been reported for the estimation of clarithromycin such as high-performance liquid chromatography (HPLC) with electrochemical detection has been widely used for the determination of drug in plasma.2, 3 Other chromatographic methods, HPLC with mass-spectrometry4 and pre-column fluorescence derivatization5 are also available. Although these methods offer selective detection of clarithromycin, they are much more complex than the conventional ultraviolet (UV) detection. Polarographic estimation method for clarithromycin was also reported by linear single sweep polarography.6
Electrochemical analysis has always been recognized as a powerful tool for measuring biomolecules in the biological system. Its remarkable sensitivity, simple instrumentation, lower cost, non-destructive, minimum detection limit, simple operation procedure, faster and reliable results make it more efficient in different biological system analysis.7
In such polarographic catalytic wave, polarographic reduction of the reducible groups of organic compounds was simultaneous with chemical regeneration of the reducible groups through oxidation of their free radicals by oxidant on electrode surface.
From analytical point of view, the sensitivity of differential pulse polarography (DPP) is even better than that of normal pulse polarography (NPP). Normal pulse voltammetry exhibits improved sensitivity by reducing most of the charging current by sampling the total current as late as possible after the application of each potential pulse. Another defect of NPP is poor resolution between neighboring waves because of drawn-out sigmoidal I-E response. DPP was so designed to overcome these problems by arranging a charging current of smaller magnitude, and by producing a peak-shaped I-E curve. The potential sequence on a single mercury drop and the potential sequence used for recording an entire differential pulse polarogram. The current is sampled twice during a drop lifetime.
In present study, we have developed a standardized DPP method for analysis of clarithromycin in serum.
2. Experimental
2.1. Reagents
Clarithromycin was obtained from Bennet Pharmaceutical, Baroda as gift sample. Ammonium tartrate was purchased from CDH (Ltd), India. Double distilled water and ethanol were used for preparing solutions. pH adjustment was made using dilute solution of HCl and NaOH. All other reagents were of analytical grade.
2.2. Instrumentation
The analyses were performed on differential pulse polarography (DPP), Micro-processor (μp) polarographic analyzer model CL-362. An Elico digital pH meter model 335 was used for pH measurement. The polarographic cell consisted of three electrode assembly with a saturated calomel electrode (reference electrode) and platinum electrode (auxiliary electrode). The working electrode was a dropping mercury electrode (DME). The capillary characteristic of the DME had an m2/3, t1/6 value of 2.5 mg2/3 s−1/2 at 60 cm effective height of mercury column.
2.3. Differential pulse polarography (DPP) of clarithromycin
Different concentrations of clarithromycin with 1 M ammonium tartrate as reducing agent were taken in polarographic cell and volume was made up to 15 ml with supporting electrolyte. The pH of the prepared test solution was adjusted to 6.5 and scanned between 0 and 2000 mV voltages.
2.4. Preparation of calibration curves and quantization
Standard clarithromycin solutions of 10-50 μg were prepared in acetone. The concentration of the clarithromycin was calculated using peak height ratios of sample to internal standard peak height (Ip). Calibration standards and quality control standards were prepared in rat blood serum by spiking a pool of serum to a known concentration and then serially diluting it with blank serum to attain the desired concentration range. The blood of the rat was collected in an Eppendorf tube and after half an hour centrifuged with micro centrifuged at 5000 rpm for 5 min, and then supernatant serum was collected with micropipette. Serum was diluted to 10 times with phosphate buffer saline (pH 7.4). For the preparation standard curve of clarithromycin with DPP, 1 ml of each standard sample was added with ammonium tartrate of 1 M (supporting electrolyte) followed by 0.1 ml serum solution and the total volume was made up to 15 ml with ammonium tartrate solution. The solution was scanned between 0 and 2000 mV voltages, which gives the peak potential (Ep) of drug at 1460 mV shown in Fig. 1. Current Vs Voltage curve were obtained after scanning of every sample and peak height (Ip) were calculated and standard curve were plotted between Ip and concentration (μg/ml).
Fig. 1.
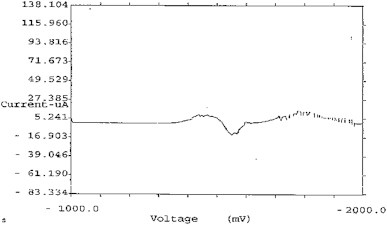
Peak potential of clarithromycin at 1460 mV.
2.5. Serum drug level studies
The albino rats of either sex were used for the present blood level study. The rat was maintained on standard commercial diet and water. Healthy rat of uniform body weight (100 g) with no prior drug treatment were used for the study. The animals were administered 10 ml plain drug suspension orally with the help of cannula prepared in PBS (pH 7.4) using the dose of 5 mg/kg body weight. The in vivo activity was performed with the permission of animal ethical committee of Dr. Hari Singh Gour University, Sagar, M.P. through their vide letter no. animal eths. Comm./10/87/54 dated 20/22-09-05.
After every 1 h interval, 0.5 ml of blood sample was collected by capillary from retro-orbital plexus in micro centrifuge tubes. The serum was quantitatively analyzed for drug with polarography at 1460 mV voltage with the previously discussed conditions.
2.6. Assay validation
DPP analysis depends on the physical environment and chemical behavior of the biomolecule(s). The external spiking method has been used to validate the DPP methods applying for the analysis of drug serum concentration after oral administration of pure clarithromycin suspension. The polarographic results on the spiked samples showed good recovery of electro-active compound from the analyte. Thus, it confirmed the utility of the developed procedure for an accurate analysis of clarithromycin in the serum.
2.7. Application
The assay was used for a comparative bioavailability study of optimized formulation containing dose of clarithromycin (5 mg/kg). The reference product was clarithromycin powder. The formulation was administrated to six rats, fasted subjects who received one of the study medications. Food and drinks were not allowed until 3 h after ingestion of the drug. Multiple blood samples (0.2 ml) were collected before and 1, 2, 3, 4, 5, 6, 7, 8 and 24 h post-dosing using method previously reported by Parasuraman et al, 2010.8 The serum was immediately separated by centrifugation and frozen at −4 °C until analysis.
2.8. Statistical analysis
Statistical analysis was performed using SPSS10.1 Chicago (USA) and all results were expressed as mean ± standard deviation (SD). The biological parameters were calculated with the help of pK analyst scientific programme (Micromath Inc., UK).
3. Results and discussion
3.1. Electrochemical analysis of clarithromycin
Clarithromycin shows the polarographic peak due to the reduction of the carbonyl group C O in C-9 and C-1 position which was polarographically electro-active. Applying a negative-going scan allowed reduction of the carbonyl group.
To optimize the medium condition for polarographic catalytic wave of clarithromycin, both the type of medium, oxidant and pH value of medium used were chosen. Strongly acidic media (pH < 5) should be not used because clarithromycin is susceptible to acid degradation.
Under the above-mentioned experimental condition clarithromycin are easily reducible at DME surface. In 1 M ammonium tartrate (pH 6.5) clarithromycin gave a well-defined polarographic peak potential (Ep) at 1460 mV. The wave height was proportional to the concentration of drug. The result of polarographic analysis with blank serum showed that serum did not show any interference in the polarographic result at 1460 mV. Quantitative analysis of sample was done by wave height and the statistical analysis of the results by external spiking method. The standardized method was found to be accurate for the determination of these compounds.
Results of the bioavailability study have been summarized in Table 1. These results showed that microspheres released clarithromycin slowly. Such controlled release profile is desirable for the absorption of drug through intestine, specifically the colonic region of the gastrointestinal tract (the absorption window). So, developed electrochemical method could be employed well for in vivo study of other drug delivery systems bearing clarithromycin.
Table 1.
Mean pharmacokinetic parameters of clarithromycin and formulation after oral administration.
| Formulation | Dose (mg/kg) | Cmax (μg/ml) | Tmax (h) | AUC0-24 (μg h/ml) | Elimination rate constant (Kel) | t1/2 (h) |
|---|---|---|---|---|---|---|
| Plain clarithromycin | 5 | 1.34 ± 0.16 | 3 | 10.81 | 0.089 | 7.76 |
| Suspension formulation | 5 | 1.99 ± 0.22 | 7 | 27.57 | 0.170 | 4.07 |
Values are reported as mean ± S.D. (n = 3).
3.2. Effect of ammonium tartrate concentration
Second-order derivative peak current Ip is depend on the ammonium tartrate concentration. When ammonium tartrate was absent, the Ip of the reduction wave was small but when ammonium tartrate was present, the Ep of the reduction wave of clarithromycin remained unchanged and the Ip increased greatly. The Ip increased gradually with ammonium tartrate concentration from 0.1 M to 2.0 M. While ammonium tartrate concentration was in the range of 0.1 M-1 M, the Ip achieved the maximum value. The Ip decreased slightly when ammonium tartrate concentration increase after 1 M.
3.3. Effect of pH
The pH of test solution is a key factor to get better polarographic waves. The pH of the medium was varied 5.0-8.0. In the present experiment the pH 6.5 ± 0.1 of the test solutions has been used for the determination of clarithromycin in serum samples.
At this pH of test solution the observed polarogram/peak, were well-defined and id/Ep of the polarogram was found to be proportional to the clarithromycin concentration. The influence of pH value in the range of pH 5.0-8.0 on peak potential of the reduction wave of clarithromycin was examined. When the pH value was less than 6.0, the peak shape was poor and the reduction current Ip decreased slowly with pH value. While the pH was in the range from 6.2 to 6.8, the peak shape became favorable and the reduction current remained nearly unchanged.
4. Conclusion
The standardized methods were found highly accurate for the determination of clarithromycin in the serum. Quantitative analysis of the sample was carried out by wave height and external spiking methods. Due to the sensitivity, accuracy, simplicity, rapidity and reliability of the results, this method could be used successfully for the qualitative and quantitative analysis of the clarithromycin in blood serum and may be recommended for its use for the other analytical purpose.
Conflicts of interest
All authors have none to declare.
Acknowledgment
The authors are thankful to Bennet Pharmaceuticals for providing pure drug sample. We also want to acknowledge All India Council of Technical Education (AICTE) for financial assistance of one of the author (Ashish Jain).
References
- 1.Peters D.H., Clissold S.P. Clarithromycin - a review of its antimicrobial activity, pharmacokinetic properties and therapeutic potential. Drugs. 1992;44:117. doi: 10.2165/00003495-199244010-00009. [DOI] [PubMed] [Google Scholar]
- 2.Wibawa J.I.D., Shaw P.N., Barrett D.A. Quantification of clarithromycin, its 14-hydroxy and decladinose metabolites in rat plasma, gastric juice and gastric tissue using high-performance liquid chromatography with electrochemical detection. J Chromatogr B. 2003;783:359. doi: 10.1016/s1570-0232(02)00765-1. [DOI] [PubMed] [Google Scholar]
- 3.Niopas I., Daftsios A.C. Determination of clarithromycin in human plasma by HPLC with electrochemical detection: validation and application in pharmacokinetic study. Biomed Chromatogr. 2001;15:507. doi: 10.1002/bmc.111. [DOI] [PubMed] [Google Scholar]
- 4.Van Rooyen G.F., Smit M.J., de Jager A.D. Sensitive liquid chromatography-tandem mass spectrometry method for the determination of clarithromycin in human plasma. J Chromatogr B. 2002;768:223. doi: 10.1016/s1570-0232(01)00566-9. [DOI] [PubMed] [Google Scholar]
- 5.Torano J.S., Guchelaar H.J. Quantitative determination of the macrolide antibiotics erythromycin, roxithromycin, azithromycin and clarithromycin in human serum by high-performance liquid chromatography using pre-column derivatization with 9-fluorenyl-methyloxycarbonyl chloride and fluorescence detection. J Chromatogr B. 1998;720:89. doi: 10.1016/s0378-4347(98)00456-3. [DOI] [PubMed] [Google Scholar]
- 6.Ma H.L., Xu M.T., Song J.F. Polarographic catalytic wave of clarithromycin and its application. Yao Xue Xue Bao. 2004;39:821–825. [PubMed] [Google Scholar]
- 7.Xin W.K., Gao X.X. Study of the effect of lanthanide ions on the kinetic of glutamate dehydrogenase by a chronoamoerometric method. Analyst. 1996;121:687–690. [Google Scholar]
- 8.Parasuraman S., Raveendran R., Kesavan R. Blood sample collection in small laboratory animals. J Pharmacol Pharmacother. 2010;1:87–93. doi: 10.4103/0976-500X.72350. [DOI] [PMC free article] [PubMed] [Google Scholar]