Abstract
Purpose of review
Optical coherence tomography (OCT) has revolutionized the clinical practice of ophthalmology. It is a noninvasive imaging technique that provides high-resolution, cross-sectional images of the retina, retinal nerve fiber layer and the optic nerve head. This review discusses the present applications of the commercially available spectral-domain OCT (SD-OCT) systems in the diagnosis and management of retinal diseases, with particular emphasis on choroidal imaging. Future directions of OCT technology and their potential clinical uses are discussed.
Recent findings
Analysis of the choroidal thickness in healthy eyes and disease states such as age-related macular degeneration, central serous chorioretinopathy, diabetic retinopathy and inherited retinal dystrophies has been successfully achieved using SD-OCT devices with software improvements. Future OCT innovations such as longer-wavelength OCT systems including the swept-source technology, along with Doppler OCT and en-face imaging, may improve the detection of subtle microstructural changes in chorioretinal diseases by improving imaging of the choroid.
Summary
Advances in OCT technology provide for better understanding of pathogenesis, improved monitoring of progression and assistance in quantifying response to treatment modalities in diseases of the posterior segment of the eye. Further improvements in both hardware and software technologies should further advance the clinician’s ability to assess and manage chorioretinal diseases.
Keywords: applications of optical coherence tomography, chorioretinal diseases, retina, spectral-domain optical coherence tomography, swept-source optical coherence tomography
INTRODUCTION
Optical coherence tomography (OCT) has evolved over the past decade as one of the most important ancillary tests in ophthalmic practice. It is a noninvasive imaging technique and provides highresolution, cross-sectional images of the retina, the retinal nerve fiber layer (RNFL) and the optic nerve head. With axial resolution in the 5–7 μm range, it provides close to an in-vivo ‘optical biopsy’ of the retina. OCT employs light from a broadband light source, which is divided into a reference and a sample beam, to obtain a reflectivity versus depth profile of the retina. The light waves that are backscattered from the retina, interfere with the reference beam, and this interference pattern is used to measure the light echoes versus the depth profile of the tissue in vivo [1,2].
At its advent, time-domain detection was the technique employed by commercially available OCT systems such as the Stratus OCT (Carl Zeiss Meditec, Inc, Dublin, CA). Time-domain OCT (TD-OCT) systems featured scan rates of 400 A-scans per second with an axial resolution of 8–10 μm in tissue [2]. In 2006, the first commercially available spectral-domain (Fourier domain) OCT (SD-OCT) system was introduced. SD-OCT employs detection of the light echoes simultaneously by measuring the interference spectrum, using an interferometer with a high-speed spectrometer. This technique achieves scan rates of 20 000–52 000 A-scans per second and a resolution of 5–7 μm in tissue [3,4].
Although OCT is used extensively for clinical decision making and monitoring of many posterior segment diseases based on macular, optic nerve and RNFL imaging, until recently, the choroid was not able to be clearly imaged with this technique. New innovations in SD-OCT hardware and software now allow for accurate choroidal thickness measurements. In addition, choroidal morphological changes on OCT are now being appreciated. As a result, choroidal imaging is an emerging area of research.
The choroid cannot be well visualized using the Stratus OCT, as the retinal pigment epithelium (RPE) is highly light scattering, resulting in attenuation of the relatively weak reflection signal from the choroid. In addition, because of the relatively low signal-to-noise ratio of TD-OCT, the signal and image information from the deeper layers of the choroid is not of high enough quality to see precise morphological details. Also, the pixel density of TD-OCT, which is limited by the number of axial scans in the OCT image, makes visualization of the choroid difficult.
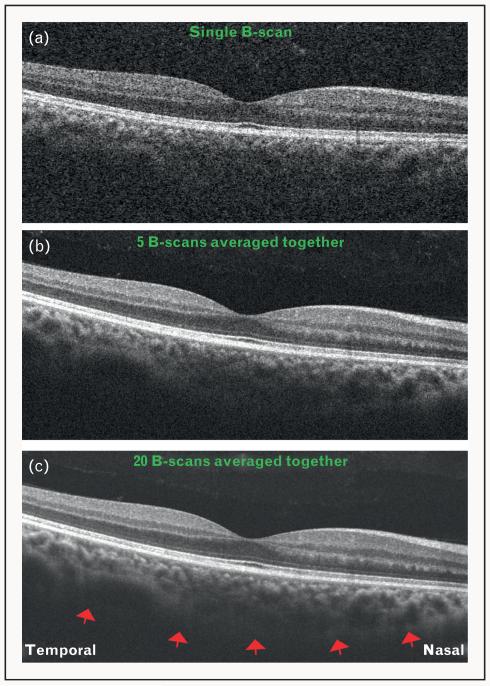
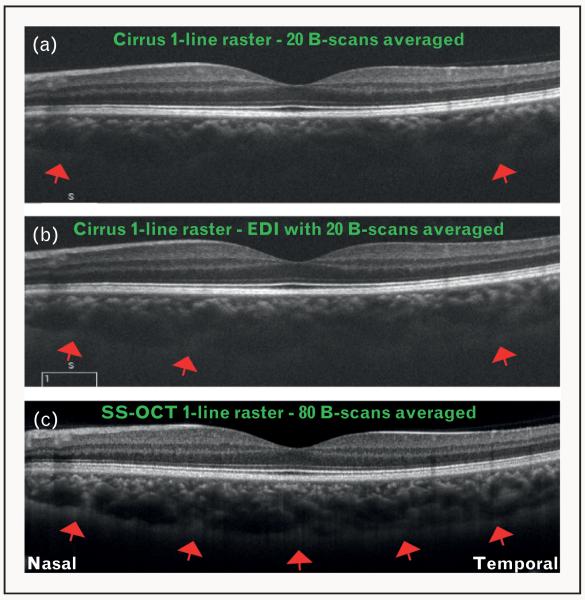
SD-OCT systems can image the choroid, however, using techniques such as image averaging and enhanced depth imaging (EDI). Image averaging involves obtaining multiple B-scans from the same retinal location that are then averaged together to increase the signal-to-noise ratio, typically in proportion to the square root of the number of images averaged [5,6]. When multiple images are averaged, the software reduces the ‘speckle.’ This sharpens the continuity and enhances the retinal and choroidal features [Fig. 1]. Along with image averaging, EDI involves setting the choroid adjacent to the zero delay line, which allows enhanced visualization of choroid up to the sclera, by taking advantage of the sensitivity roll-off characteristic of SD-OCT systems [5-7,8■■,9■■,10] [Fig. 2].
FIGURE 1.
Optical coherence tomography (OCT) images obtained using Cirrus high definition OCT (HD-OCT) system, showing increasing signal quality with the technique of image averaging. (a) A single B-scan showing low signal and increased noise. The choroid–sclera interface cannot be visualized. (b) Five B-scans averaged together to improve the signal. Note that the choroid–sclera interface is still not clearly visualized. (c) Twenty B-scans averaged together. Note the improvement in signal quality, with a fairly distinct delineation of the choroid–sclera interface (red arrows).
FIGURE 2.
Optical coherence tomography (OCT) images showing increasing signal quality with the technique of enhanced depth imaging (EDI) and longer-wavelength sweeping laser light source. (a) OCT image obtained using Cirrus HD-OCT system with 20 B-scans averaged together, but without EDI. Note that choroid–sclera interface is visualized only slightly toward the far temporal and nasal aspects (red arrows). (b) OCT image obtained using Cirrus HD-OCT system with 20 B-scans averaged together and EDI. Note the improvement in the visualization of choroid–sclera interface (red arrows). (c) OCT image obtained using a swept-source OCT (SS-OCT) system centered at a wavelength of 1050 nm, and an imaging speed of 100 000 A-scans per second. Note that the signal quality is markedly improved, and the choroid–sclera interface can be visualized throughout the line scan (red arrows). Also note that within the same acquisition time (as for Cirrus HD-OCT), the SS-OCT was able to average 80 B-scans, further increasing signal quality.
Apart from the commercially available systems, prototype OCT systems have contributed to an ever-growing body of research studies in this field. These include, but are not limited to, the ultra high-resolution OCT (UHR-OCT) [11], SD-OCT systems employing a longer-wavelength light source permitting deeper tissue penetration, and swept-source OCT (SS-OCT) systems [12■■,13]. UHR-OCT uses broadband light sources to achieve 3 μm resolution in tissue [11]. SS-OCT uses another form of Fourier domain detection to measure light echoes. It employs a tunable frequency swept laser light source, which sequentially emits various frequencies in time, and the interference spectrum is measured by photodetectors instead of a spectrometer. This increases the signal quality in deep tissue by elimination of the sensitivity of a spectrometer to higher frequency modulation as with SD-OCT [12■■,14-18], thereby improving the visualization of the choroid [Fig. 2].
This review discusses the present applications of the various commercially available SD-OCT systems in the diagnosis and management of retinal diseases, with particular emphasis on choroidal imaging. Further, future directions of OCT technology, specifically the innovations in OCT technology with the research prototype OCT systems, their potential clinical uses, and benefits for choroidal imaging are discussed.
PRESENT APPLICATIONS OF OPTICAL COHERENCE TOMOGRAPHY
At present, OCT imaging is used extensively for imaging the macula, optic nerve and RNFL, and aids in analyzing the morphology and quantifying changes in various disease states. For example, the automated retinal thickness measurements generated by the SD-OCT systems are used clinically for the monitoring progression of diseases such as wet age-related macular degeneration (AMD) and macular edema from various causes including diabetes and retinal vein occlusion. The ability to detect fluid within the retina and the thickness alterations induced by this fluid helps direct clinical decisions regarding treatment [19]. The diagnosis of macular hole and its differentiation between lamellar holes and pseudomacular holes have become straightforward using OCT [20]. In addition, the size and configuration of macular holes, determined by OCT, correlates well with the functional and anatomic outcomes following surgical intervention [20-23]. Evaluation of the vitreoretinal interface using OCT is important in the evaluation and treatment of diseases of the vitreomacular interface such as epiretinal membranes and vitreomacular traction [24]. In addition, optic disc morphology and RNFL thickness measurements, using OCT, monitor the progression and helps quantitatively assess the treatment response in patients with glaucoma [25,26].
Choroidal imaging in healthy eyes
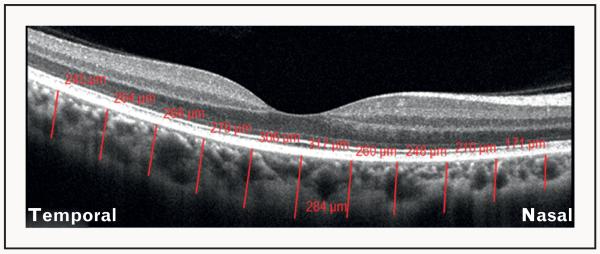
Most commercially available SD-OCT systems can be used to evaluate choroidal thickness [5,6,8■■,27]. The method for choroidal thickness analysis involves manual measurements perpendicularly from the outer edge of the hyperreflective RPE to the inner sclera (choroid–sclera junction) using the respective software within the system [4-6,8■■] [Fig. 3]. The choroid in healthy eyes is thickest subfoveally and thins nasally more than temporally [5,6,8■■,27] [Fig. 3]. In addition, a negative correlation exists between choroidal thickness and age. Margolis et al. [6] and Manjunath et al. [27] reported the mean subfoveal choroidal thickness of 287 ± 76 μm using the Spectralis OCT and 272 ± 81 μm using the Cirrus OCT device in 54 and 34 healthy eyes, respectively. A recent investigation analyzed the reproducibility of choroidal thickness measurements, showing a good intervisit and interobserver correlation of measurements (r = 0.89 and r = 0.97 respectively, P < 0.05) [28]. In addition, among the three commercially available SD-OCT systems, a good reproducibility of choroidal thickness measurements has been reported (P < 0.0001) [8■■].
FIGURE 3.
Illustration of the method used for the assessment of choroidal thickness on optical coherence tomography (OCT). OCT image of a healthy eye obtained using Cirrus HD-OCT system, showing the measurement of choroidal thickness perpendicularly from the outer border of the hyperreflective retinal pigment epithelium to the inner border of the choroid-scleral interface at 11 locations: beneath the fovea, and at 500-μm intervals up to 2500-μm temporal and nasal to the fovea (red lines). The numbers in red depict the choroidal thickness measurements at each of the measured location. This was performed using the Cirrus linear measurement tool. This method is being used increasingly for the evaluation of choroidal thickness in healthy and diseased states.
Choroidal imaging in disease
Presently, SD-OCT systems are being used extensively for evaluation of the choroid in many posterior segment diseases. OCT applications of some of the common diseases are discussed.
Age-related macular degeneration
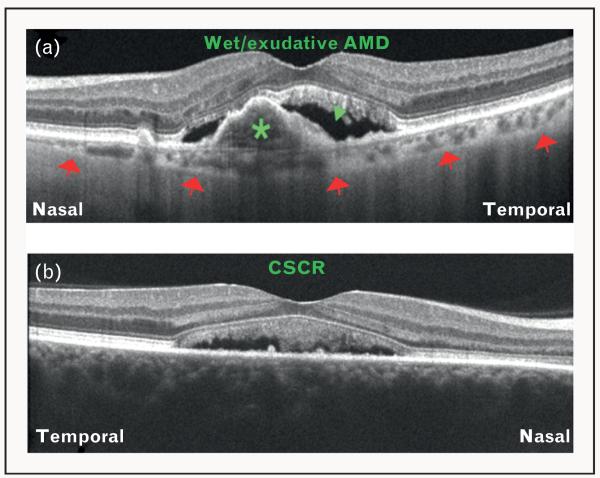
Age-related macular degeneration (AMD) is a leading cause of visual impairment in patients over 60 years of age in developed countries [29]. The evaluation and management of AMD utilize several investigation modalities, but advancements in OCT technology have significantly contributed to better understanding of the disease, and have helped with monitoring the progression and therapeutic response of corticosteroids and antivascular endothelial growth factor (VEGF) agents in wet (neovascular) AMD [30]. Choroidal involvement in the pathogenesis of AMD has earned great interest recently. Manjunath et al. [10] reported a mean subfoveal choroidal thickness of 194.6 ± 88.4 μm in 40 eyes and 213.4 ± 92.2 μm in 17 eyes with wet and dry AMD, respectively, when compared with 272 ± 81 μm in age-matched healthy eyes [10]. In addition, this study also reported an inverse correlation of age with choroidal thickness in eyes with dry AMD (r = −0.7, P = 0.002). This was further supported by Spaide et al. [31], who described a distinct entity known as age-related choroidal atrophy [31], suggesting the contribution of both, increasing age as well as the choroidal vasculature, in the pathogenesis of AMD [10,31]. Other diseases of the choroidal circulation, including central serous chorioretinopathy (CSCR) and polyploidal choroidal vasculopathy (PCV), demonstrate a thicker choroid when compared with healthy eyes and those with wet AMD [32,33]. Thus, the assessment of choroidal thickness using SD-OCT may assist in differentiating neovascular AMD from CSCR and/or PCV [Fig. 4].
FIGURE 4.
Differentiation of diseases using choroidal thickness as a parameter on optical coherence tomography (OCT). (a) OCT image obtained using Cirrus HD-OCT demonstrating features of wet/exudative age-related macular degeneration (AMD) including pigment epithelial detachment (green asterisk) and subretinal fluid collection (green arrowhead). Note that the choroid is thinner than normal (red arrows = choroid–sclera interface). (b) OCT image obtained using Cirrus HD-OCT demonstrating features of central serous chorioretinopathy (CSCR). Note that the choroid is so thick that the choroid-scleral interface cannot be visualized. This is because of the loss of signal penetration and intensity at increasing depth, due to signal roll-off distal to the zero delay line.
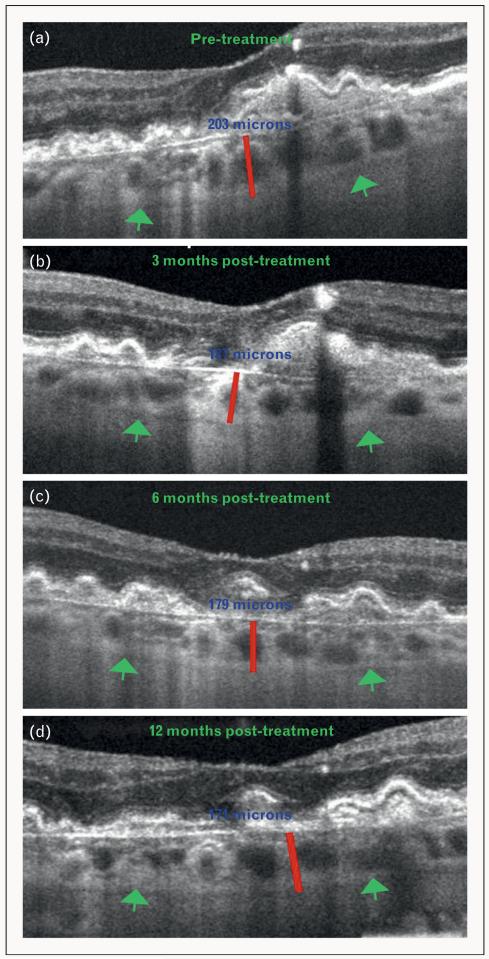
Anti-VEGF therapy for wet AMD reliably stabilizes and often improves visual acuity and is therefore extensively employed. Recent evidence suggests that treatment with anti-VEGF agents may over time lead to choroidal thinning [34,35■■,36■■]. Ellabban et al. showed no effect on choroidal thickness of anti-VEGF therapy for choroidal neovascularization (CNV) associated with wet AMD and other diseases [35■■]. However, Branchini et al. [36■■] recently showed a mean subfoveal choroidal thickness of 207.4 ± 22.1 μm prior to anti-VEGF treatment in eyes with wet AMD. This then reduced to 194.7 ± 21.9 μm at 3 months, 164.9 18.0 μm at 6 months and 171.8 17.4 μm at 12 months following treatment with anti-VEGF agents [36■■]. Given that anti-VEGF agents are used as a treatment of choice for many posterior segment pathologies including wet AMD, a reduction in choroidal thickness following anti-VEGF therapy, as demonstrated using SD-OCT [Fig. 5], may have clinical implications for their use in wet AMD and other chorioretinal diseases.
FIGURE 5.
Demonstration of choroidal thinning, following antivascular endothelial growth factor (anti-VEGF) therapy for wet/exudative age-related macular degeneration (AMD), using Cirrus HD-OCT. (a) OCT image of an eye affected with wet AMD obtained before initiation of anti-VEGF treatment. (b) OCT image of an eye affected with wet AMD obtained 3 months post anti-VEGF treatment. (c) OCT image of an eye affected with wet AMD obtained 6 months post anti-VEGF treatment. (d) OCT image of an eye affected with wet AMD obtained 12 months post anti-VEGF treatment. Green arrows indicate the choroid–sclera interface and red lines show the measurement of subfoveal choroidal thickness. Note the gradual subfoveal choroidal thinning after treatment with anti-VEGF agents (blue numbers).
Central serous chorioretinopathy
CSCR is a disease characterized by an exudative/serous detachment of the neurosensory retina from the RPE. Conventional investigations such as indocyanine green (ICG) angiography and fluorescein angiography show a generalized disruption of the choroidal vasculature in eyes affected with CSCR, with diffuse hyperpermeability [37]. On OCT, an elevation of the neurosensory retina from the RPE, with an optically empty space in between, is observed [Fig. 4]. Recent studies using three different SD-OCT devices [7,32,38] reported a significant increase in the thickness of the choroid in eyes affected with acute CSCR. In 28 eyes of 19 patients with CSCR, the mean choroidal thickness was 505 ± 124 μm on Spectralis OCT. This was 85% greater than that of age-matched healthy eyes (P < 0.001). This finding suggests that the pathophysiology of CSCR may involve an increase in the hydrostatic pressure in choroidal vessels.
Generally, CSCR resolves spontaneously within 3–6 months, but in some patients subretinal fluid can persist for many months, leading to permanent visual dysfunction. This chronic from of CSCR may require intervention with treatments such as laser photocoagulation and photodynamic therapy (PDT). Recently, an investigation revealed a significant reduction in choroidal thickness, from 389 ± 106 μm at baseline to 330 ± 103 μm (P < 0.001), 4 weeks following PDT in eyes ±affected with CSCR [39]. This, however, was not true for eyes that were treated with laser photocoagulation 4 weeks after treatment (345 ± 127 μm versus 340 ± 124 μm, P = 0.2). Such a reduction in choroidal thickness following PDT for CSCR has been demonstrated in another more recent investigation as well [40■■]. Given the widespread use of PDT for the treatment of CSCR, analysis of choroidal thickness using SD-OCT may be a parameter to assess for disease activity following treatment. In addition, evaluation of choroidal thickness may assist in differentiating CSCR from other causes of exudative/serous retinal detachment.
Diabetic retinopathy
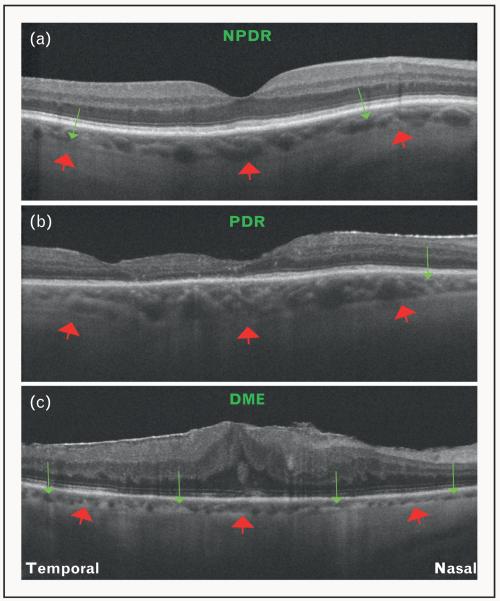
Diabetic retinopathy is the leading cause of visual impairment in working-age adults worldwide. The pathogenesis and clinical features of diabetic retinopathy are primarily attributed to retinal vascular damage. However, studies on vascular filling of the choroidal vessels suggest that choroidal angiopathy may also be involved. Delayed choroidal vascular filling, which manifests as choroidal hypofluorescence on ICG, is observed in eyes affected with diabetic retinopathy, and correlates with the severity of disease [41-47]. Using SD-OCT, analysis of choroidal thickness in eyes affected with diabetic retinopathy has been performed [Fig. 6]. Regatieri et al. [9■■] reported a significant thinning of the choroid in eyes with proliferative diabetic retinopathy and diabetic macular edema, but not in eyes with nonproliferative diabetic retinopathy, when compared with age-matched healthy eyes. Esmaeelpour et al. [48] analyzed the subfoveal choroidal thickness in eyes with different clinical features of diabetic retinopathy, and found that eyes with microaneurysms, hard exudates and macular edema had a mean subfoveal choroidal thickness of 208 ± 49 μm, 205 ± 54 μm and 211 ± 76 μm, respectively, when compared with 327 ± 74 μm in healthy eyes (P < 0.001). This suggests that choroidal angiopathy may be related to disease severity, and choroidal thickness analysis using SD-OCT may be an important parameter to assess for the severity of diabetic retinopathy.
FIGURE 6.
Optical coherence tomography (OCT) features of diabetic retinopathy. (a) OCT image of an eye affected with nonproliferative diabetic retinopathy (NPDR) obtained using Cirrus HD-OCT. Note that the choroid is thinner than normal (red arrows = choroid–sclera interface), and focal areas of choroidal thinning can be appreciated (green arrows). (b) OCT image of an eye affected with proliferative diabetic retinopathy (PDR) obtained using Cirrus HD-OCT. Red arrows represent the choroid–sclera interface. Note an area of focal choroidal thinning (green arrow). (c) OCT image of an eye with resolving diabetic macular edema (DME), following treatment with multiple intravitreal injections, obtained using Cirrus HD-OCT. Red arrows represent the choroid–sclera interface. In contrast with NPDR and PDR, note the diffuse thinning of the choroid (green arrows).
Inherited retinal diseases
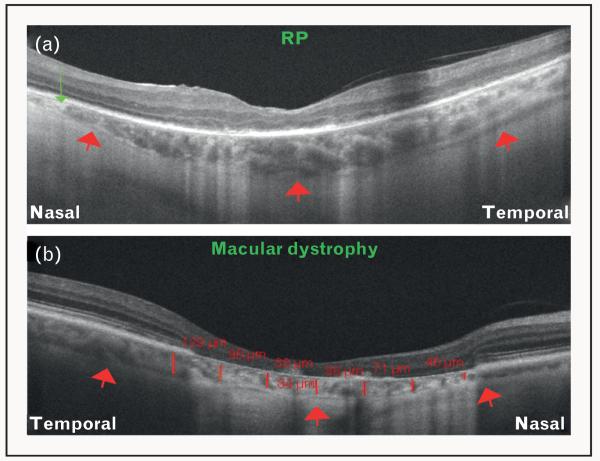
Evaluation of various features in the retina of patients with retinal dystrophies, in particular retinitis pigmentosa, has been investigated using SD-OCT [49]. However, the choroid has only recently been evaluated in these diseases using SD-OCT [Fig. 7]. Scanning Doppler flowmetry studies show that choroidal blood flow is diminished, and correlates with the cone function in eyes affected with retinitis pigmentosa [50]. Yeoh et al. [51] first described the changes in the structure and thickness of the choroid in retinal dystrophies other than retinitis pigmentosa, and reported focal and/or diffuse choroidal thinning in eyes with severe disease. Recently, Dhoot et al. [52■] demonstrated a mean choroidal thickness of 245.6 ± 103 μm in 21 patients with retinitis pigmentosa, in comparison with 337.8 ± 109 μm in healthy eyes (P < 0.0001) using Spectralis EDI OCT. These studies provide a new insight regarding the involvement of choroid in inherited retinal dystrophies.
FIGURE 7.
Optical coherence tomography (OCT) features of inherited retinal dystrophies. (a) OCT image of an eye affected with retinitis pigmentosa (RP) obtained using Cirrus HD-OCT. Red arrows represent the choroid–sclera interface. Note the focal thinning of choroid nasally (green arrow). (b) OCT image of an eye affected with a macular dystrophy obtained using Cirrus HD-OCT. Red arrows represent the choroid–sclera interface. Note the significant loss of the retinal layers. Also note the significant choroidal thinning observed in this case (red lines and numbers).
Intraocular tumors
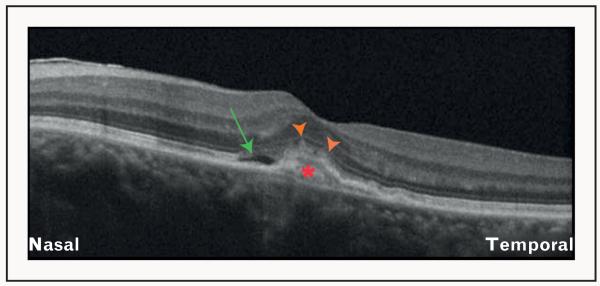
Intraocular tumors such as choroidal melanomas, nevi and osteomas have recently been studied using SD-OCT. A recent investigation demonstrated that delineation of tumor borders and analysis of choriocapillaris and larger vessels within the tumors can be achieved using SD-OCT [53■]. Choroidal osteoma has been studied and its reflectivity on SD-OCT has been described [54■]. Thus SD-OCT allows characterization of the thickness as well as the reflective quality of choroidal neoplastic lesions [Fig. 8].
FIGURE 8.
Optical coherence tomography (OCT) features of an eye with choroidal osteoma. OCT image obtained using the Cirrus HD-OCT showing an irregular plate-like hyperreflectivity of the lesion (red asterisk) extending into the retina, with atrophy of the overlying retinal pigment epithelium (orange arrowheads). Subretinal fluid collection can also be observed (green arrow).
FUTURE DIRECTIONS
With the growing evidence regarding the involvement of choroid in retinal diseases, it has become increasingly important to visualize the choroid in anatomic detail. Up until recently, the choroid could not be visualized effectively. Recent innovations in technology have helped with overcoming this limitation. Further ongoing advancements are expected to provide an even better understanding of choroidal involvement in retinal diseases using various techniques.
Longer wavelength and swept source technology
An accurate assessment of the choroid using OCT requires that the choroid be visualized up to the choroid–sclera interface. Studies using Cirrus OCT system report a clear visualization of the choroid–scleral interface in 70–75% of healthy and diseased eyes [6,7,9■■,10]. To our knowledge, the percentage of eyes that have a clearly delineated choroid–sclera interface has not been reported with Spectralis and RTVue OCT systems. For adequate analysis of choroidal thickness and volume in healthy and diseased states, the clarity of the choroid–sclera interface is imperative. This can be achieved by increasing the depth of tissue penetration using a longer wavelength of incident light centered near 1050 nm, so that attenuation from scattering can be reduced [13]. Prototype OCT systems using longer wavelength have demonstrated an enhanced visualization of the choroid, also through opaque media [56,57]. SS-OCT technology is also expected to improve the visualization of the choroid [14-16]. Because swept laser light sources can rapidly sweep the required frequencies, the acquisition of scans is much faster in SS-OCT, when compared with the SD-OCT systems. The SS-OCT systems have axial scan rates of up to 100 000–236 000 A-scans per second, which is five to 10 times that of the SDOCT systems, and can achieve 11 μm axial resolutions in tissue [12■■,58,59]. Because data can be acquired much faster, volumetric assessment of the choroid is also feasible [12■■,16].
As longer-wavelength OCT systems including SS-OCT become available, the visualization of choroid–sclera interface is expected to improve. This is important in diseases such as CSCR, where the choroid is thicker than normal, and thus difficult to evaluate across its entire width. In addition, volumetric analysis of the choroid, as well as that of the various pathological features such as choroidal neovascularization and subretinal/intraretinal fluid, may be possible. Such a volumetric analysis is expected to help with monitoring the progression of diseases such as wet AMD, CSCR and diabetic retinopathy, as well as assessment of the response to treatments such as anti-VEGF agents, laser photocoagulation and PDT.
Doppler optical coherence tomography
In contrast to ICG and fluorescein angiography, which are two-dimensional investigations for blood flow analysis, Doppler OCT is a promising technology, in that it is depth resolved, such that precise location of vascular abnormalities can be localized using cross-sectional imaging. Doppler OCT can evaluate blood flow and volume of retinal and choroidal vasculature [60-64], highlight vessels where the flow is present [65] and evaluate abnormalities in retinal and choroidal vasculature [66]. Given theevidence of choroidal angiopathy in various retinal diseases, this technology promises to help with monitoring of chorioretinal diseases, in particular wet AMD. It is also expected to aid in the differentiation among diseases such as wet AMD, CSCR and PCV.
En-face imaging
Software modifications, improvements and efficient processing of data are important for effective evaluation of changes in retina and choroid in posterior segment diseases. One of the advancements, known as en-face imaging, allows the clinician to visualize three-dimensional data in a fundus projection. Using this technique, particular retinal and/or choroidal layers at a given depth are projected onto an en-face view. Although cross-sectional images (B-scans) have helped delineate pathological features in retinal diseases, as such, microstructural changes and morphology of the retinal and choroidal vasculature are hard to evaluate using B-scans. This is expected to improve as en-face imaging provides further detail about the subtle pathological features in the retina and choroid in diseased states [67]. In addition, the involvement of the specific vascular layers of the choroid in different diseases such as AMD, CSCR, diabetic retinopathy and inherited retinal dystrophies is expected to delineate in further detail using this technique.
CONCLUSION
OCT technology provides for enhancement of the understanding, monitoring progression and response to various treatment modalities employed in chorioretinal diseases. As such, these advancements have revolutionized ophthalmic practice over the last decade. Further innovations in both hardware and software technologies are expected to aid in the assessment of chorioretinal diseases in more detail.
KEY POINTS.
Choroid is implicated to be involved in the pathogenesis of retinal diseases, but until the advent of SD-OCT, its visualization was not feasible.
Analysis of the choroid in healthy and diseased states such as AMD, CSCR, diabetic retinopathy and inherited retinal dystrophies has been successfully achieved using three commercially available SD-OCT systems.
Longer wavelength OCT systems including the swept-source technology, Doppler OCT and en-face imaging, will help detect subtle microstructural changes in chorioretinal diseases.
Acknowledgements
None.
This work was supported in part by a Research to Prevent Blindness Unrestricted grant to the New England Eye Center/Department of Ophthalmology, Tufts University School of Medicine, NIH contracts RO1-EY11289–23, R01-EY13178–07, R01-EY013516–07 and the Massachusetts Lions Eye Research Fund.
Footnotes
Conflicts of interest
J.S.D. receives research support from Carl Zeiss Meditech, Inc. and Optovue, Inc.
REFERENCES AND RECOMMENDED READING
Papers of particular interest, published within the annual period of review, have been highlighted as:
■ of special interest
■■ of outstanding interest
Additional references related to this topic can also be found in the Current World Literature section in this issue (pp. 268–269).
- 1.Huang D, Swanson EA, Lin CP, et al. Optical coherence tomography. Science. 1991;254:1178–1181. doi: 10.1126/science.1957169. [DOI] [PMC free article] [PubMed] [Google Scholar]
- 2.Sull AC, Vuong LN, Price LL, et al. Comparison of spectral/Fourier domain optical coherence tomography instruments for assessment of normal macular thickness. Retina. 2010;30:235–245. doi: 10.1097/IAE.0b013e3181bd2c3b. [DOI] [PMC free article] [PubMed] [Google Scholar]
- 3.de Boer JF, Cense B, Park BH, et al. Improved signal-to-noise ratio in spectral-domain compared with time-domain optical coherence tomography. Opt Lett. 2003;28:2067–2069. doi: 10.1364/ol.28.002067. [DOI] [PubMed] [Google Scholar]
- 4.Leitgeb R, Hitzenberger C, Fercher A. Performance of Fourier domain vs. time domain optical coherence tomography. Opt Express. 2003;11:889–894. doi: 10.1364/oe.11.000889. [DOI] [PubMed] [Google Scholar]
- 5.Spaide RF, Koizumi H, Pozzoni MC. Enhanced depth imaging spectral-domain optical coherence tomography. Am J Ophthalmol. 2008;146:496–500. doi: 10.1016/j.ajo.2008.05.032. [DOI] [PubMed] [Google Scholar]
- 6.Manjunath V, Taha M, Fujimoto JG, Duker JS. Choroidal thickness in normal eyes measured using Cirrus HD optical coherence tomography. Am J phthalmol. 2010;150:325e1–329e1. doi: 10.1016/j.ajo.2010.04.018. [DOI] [PMC free article] [PubMed] [Google Scholar]
- 7.Imamura Y, Fujiwara T, Margolis R, Spaide RF. Enhanced depth imaging optical coherence tomography of the choroid in central serous chorioretinopathy. Retina. 2009;29:1469–1473. doi: 10.1097/IAE.0b013e3181be0a83. [DOI] [PubMed] [Google Scholar]
- 8■■.Branchini L, Regatieri CV, Flores-Moreno I, et al. Reproducibility of choroidal thickness measurements across three spectral domain OCT systems. Ophthalmology. 2012;119:119–123. doi: 10.1016/j.ophtha.2011.07.002. [DOI] [PMC free article] [PubMed] [Google Scholar]
- 9■■.Regatieri CV, Branchini L, Carmody J, et al. Choroidal thickness in patients with diabetic retinopathy analyzed by spectral-domain optical coherence tomography. Retina. 2012;32:563–568. doi: 10.1097/IAE.0b013e31822f5678. This study analyzed the choroid using SD-OCT in eyes with diabetic retinopathy. It shows a reduction in choroidal thickness in eyes with moderate-to-severe diabetic retinopathy, when compared with age-matched healthy eyes, and that the presence of diabetic macular edema is associated with a significant decrease in the choroidal thickness.
- 10.Manjunath V, Goren J, Fujimoto JG, Duker JS. Analysis of choroidal thickness in age-related macular degeneration using spectral-domain optical coherence tomography. Am J Ophthalmol. 2011;152:663–668. doi: 10.1016/j.ajo.2011.03.008. [DOI] [PMC free article] [PubMed] [Google Scholar]
- 11.Ho J, Witkin AJ, Liu J, et al. Documentation of intraretinal retinal pigment epithelium migration via high-speed ultrahigh-resolution optical coherence tomography. Ophthalmology. 2011;118:687–693. doi: 10.1016/j.ophtha.2010.08.010. [DOI] [PMC free article] [PubMed] [Google Scholar]
- 12■■.Grulkowski I, Liu JJ, Potsaid B, et al. Retinal, anterior segment and full eye imaging using ultrahigh speed swept source OCT with vertical-cavity surface emitting lasers. Biomed Opt Express. 2012;3:2733–2751. doi: 10.1364/BOE.3.002733. [DOI] [PMC free article] [PubMed] [Google Scholar]
- 13.Unterhuber B, Povazay B, Hermann H. In vivo retinal optical coherence tomography at 1040 nm-enhanced penetration into the choroid’. Opt. Express. 2005;13:3252–3258. doi: 10.1364/opex.13.003252. [DOI] [PubMed] [Google Scholar]
- 14.Chinn SR, Swanson EA, Fujimoto JG. Optical coherence tomography using a frequency-tunable optical source. Opt Lett. 1997;22:340–342. doi: 10.1364/ol.22.000340. [DOI] [PubMed] [Google Scholar]
- 15.de Boer JF, Milner TE, van Gemert MJ, Nelson JS. Two-dimensional birefrin-gence imaging in biological tissue by polarization-sensitive optical coherence tomography. Opt Lett. 1997;22:934–936. doi: 10.1364/ol.22.000934. [DOI] [PubMed] [Google Scholar]
- 16.Drexler W, Fujimoto JG. State-of-the-art retinal optical coherence tomography. Prog Retin Eye Res. 2008;27:45–88. doi: 10.1016/j.preteyeres.2007.07.005. [DOI] [PubMed] [Google Scholar]
- 17.Choma MA, Yang C, Izatt JA. Instantaneous quadrature low-coherence interferometry with 3 × 3 fiber-optic couplers. Opt Lett. 2003;28:2162–2164. doi: 10.1364/ol.28.002162. [DOI] [PubMed] [Google Scholar]
- 18.Choma MA, Hsu K, Izatt JA. Swept source optical coherence tomography using an all-fiber 1300-nm ring laser source. J Biomed Opt. 2005;10:44009. doi: 10.1117/1.1961474. [DOI] [PubMed] [Google Scholar]
- 19.Brown DM, Regillo CD. Anti-VEGF agents in the treatment of neovascular age-related macular degeneration: applying clinical trial results to the treatment of everyday patients. Am J Ophthalmol. 2007;144:627–637. doi: 10.1016/j.ajo.2007.06.039. [DOI] [PubMed] [Google Scholar]
- 20.Haouchine B, Massin P, Tadayoni R, et al. Diagnosis of macular pseudoholes and lamellar macular holes by optical coherence tomography. Am J Ophthal-mol. 2004;138:732–739. doi: 10.1016/j.ajo.2004.06.088. [DOI] [PubMed] [Google Scholar]
- 21.Kusuhara S, Teraoka Escano MF, Fujii S, et al. Prediction of postoperative visual outcome based on hole configuration by optical coherence tomography in eyes with idiopathic macular holes. Am J Ophthalmol. 2004;138:709–716. doi: 10.1016/j.ajo.2004.04.063. [DOI] [PubMed] [Google Scholar]
- 22.Negretto AD, Gomes AM, Goncalves FP, et al. Use of anatomical measures of idiopathic macular hole obtained through optical coherence tomography as a predictive factor in visual results: a pilot study. Arq Bras Oftalmol. 2007;70:777–783. doi: 10.1590/s0004-27492007000500010. [DOI] [PubMed] [Google Scholar]
- 23.Hillenkamp J, Kraus J, Framme C, et al. Retreatment of full-thickness macular hole: predictive value of optical coherence tomography. Br J Ophthalmol. 2007;91:1445–1449. doi: 10.1136/bjo.2007.115642. [DOI] [PMC free article] [PubMed] [Google Scholar]
- 24.Voo I, Mavrofrides EC, Puliafito CA. Clinical applications of optical coherence tomography for the diagnosis and management of macular diseases. Ophthal-mol Clin North Am. 2004;17:21–31. doi: 10.1016/j.ohc.2003.12.002. [DOI] [PubMed] [Google Scholar]
- 25.Ojima T, Tanabe T, Hangai M, et al. Measurement of retinal nerve fiber layer thickness and macular volume for glaucoma detection using optical coherence tomography. Jpn J Ophthalmol. 2007;51:197–203. doi: 10.1007/s10384-006-0433-y. [DOI] [PubMed] [Google Scholar]
- 26.Garas A, Vargha P, Hollo G. Reproducibility of retinal nerve fiber layer and macular thickness measurement with the RTVue-100 optical coherence tomograph. Ophthalmology. 2010;117:738–746. doi: 10.1016/j.ophtha.2009.08.039. [DOI] [PubMed] [Google Scholar]
- 27.Margolis R, Spaide RF. A pilot study of enhanced depth imaging optical coherence tomography of the choroid in normal eyes. Am J Ophthalmol. 2009;147:811–815. doi: 10.1016/j.ajo.2008.12.008. [DOI] [PubMed] [Google Scholar]
- 28.Ikuno Y, Maruko I, Yasuno Y, et al. Reproducibility of retinal and choroidal thickness measurements in enhanced depth imaging and high-penetration optical coherence tomography. Invest Ophthalmol Vis Sci. 2011;52:5536–5540. doi: 10.1167/iovs.10-6811. [DOI] [PubMed] [Google Scholar]
- 29.Klein R, Klein BE, Linton KL. Prevalence of age-related maculopathy. The Beaver Dam Eye Study. Ophthalmology. 1992;99:933–943. doi: 10.1016/s0161-6420(92)31871-8. [DOI] [PubMed] [Google Scholar]
- 30.Fung AE, Lalwani GA, Rosenfeld PJ, et al. An optical coherence tomography-guided, variable dosing regimen with intravitreal ranibizumab (Lucentis) for neovascular age-related macular degeneration. Am J Ophthalmol. 2007;143:566–583. doi: 10.1016/j.ajo.2007.01.028. [DOI] [PubMed] [Google Scholar]
- 31.Spaide RF. Age-related choroidal atrophy. Am J Ophthalmol. 2009;147:801–810. doi: 10.1016/j.ajo.2008.12.010. [DOI] [PubMed] [Google Scholar]
- 32.Kim SW, Oh J, Kwon SS, et al. Comparison of choroidal thickness among patients with healthy eyes, early age-related maculopathy, neovascular age-related macular degeneration, central serous chorioretinopathy, and polypoidal choroidal vasculopathy. Retina. 2011;31:1904–1911. doi: 10.1097/IAE.0b013e31821801c5. [DOI] [PubMed] [Google Scholar]
- 33.Koizumi H, Yamagishi T, Yamazaki T, et al. Subfoveal choroidal thickness in typical age-related macular degeneration and polypoidal choroidal vasculopathy. Graefes Arch Clin Exp Ophthalmol. 2011;249:1123–1128. doi: 10.1007/s00417-011-1620-1. [DOI] [PubMed] [Google Scholar]
- 34.Sayanagi K, Jo Y, Ikuno Y. Transient choroidal thinning after intravitreal bevacizumab injection for myopic choroidal neovascularization. J Clinic Ex-periment Ophthalmol. 2011;2:1–5. [Google Scholar]
- 35■■.Ellabban AA, Tsujikawa A, Ogino K, et al. Choroidal thickness after intravitreal ■ ranibizumab injections for choroidal neovascularization. Clin Ophthalmol. 2012;6:837–844. doi: 10.2147/OPTH.S30907. [DOI] [PMC free article] [PubMed] [Google Scholar]
- 36■■.Branchini L, Regatieri CV, Adhi M, et al. The effect of intravitreal anti-VEGF therapy on choroidal thickness in neovascular AMD using spectral domain optical coherence tomography. JAMA Ophthalmol. 2013 doi: 10.1001/jamaophthalmol.2013.692. in press. This study analyzed the effect on choroidal thickness using SD-OCT in eyes treated with anti-VEGF agents for wet AMD. It shows that the choroidal thickness reduces significantly at 3, 6 and 12 months following anti-VEGF therapy, when compared with the baseline measurements before initiation of treatment.
- 37.Gemenetzi M, De Salvo G, Lotery AJ. Central serous chorioretinopathy: an update on pathogenesis and treatment. Eye (Lond) 2010;24:1743–1756. doi: 10.1038/eye.2010.130. [DOI] [PubMed] [Google Scholar]
- 38.Manjunath V, Fujimoto JG, Duker JS. Cirrus HD-OCT high definition imaging is another tool available for visualization of the choroid and provides agreement with the finding that the choroidal thickness is increased in central serous chorioretinopathy in comparison to normal eyes. Retina. 2010;30:1320–1321. doi: 10.1097/IAE.0b013e3181e798b1. [DOI] [PMC free article] [PubMed] [Google Scholar]
- 39.Maruko I, Iida T, Sugano Y, et al. Subfoveal choroidal thickness after treatment of central serous chorioretinopathy. Ophthalmology. 2010;117:1792–1799. doi: 10.1016/j.ophtha.2010.01.023. [DOI] [PubMed] [Google Scholar]
- 40■ ■.Pryds A, Larsen M. Choroidal thickness following extrafoveal photodynamic treatment with verteporfin in patients with central serous chorioretinopathy. Acta Ophthalmol. 2012;90:738–743. doi: 10.1111/j.1755-3768.2011.02157.x. [DOI] [PubMed] [Google Scholar]
- 41.Shiragami C, Shiraga F, Matsuo T, et al. Risk factors for diabetic choroidopathy in patients with diabetic retinopathy. Graefe’s Arch Clin Exp Ophthalmol. 2002;240:436–442. doi: 10.1007/s00417-002-0451-5. [DOI] [PubMed] [Google Scholar]
- 42.Bartsch DU, Weinreb RN, Zinser G, Freeman WR. Confocal scanning infrared laser ophthalmoscopy for indocyanine green angiography. Am J Ophthalmol. 1995;120:642–651. doi: 10.1016/s0002-9394(14)72211-1. [DOI] [PubMed] [Google Scholar]
- 43.Takahashi K, Muraoka K, Tokui K, et al. Detection of diabetic choroidopathy by panoramic infrared angiography (in Japanese) Rinsho Ganka (Jpn J Clin Ophthalmol. 1994;48:1027–1037. [Google Scholar]
- 44.Fukushima I, McLeod DS, Lutty GA. Intrachoroidal microvascular abnormality: a previously unrecognized form of choroidal neovascularization. Am J Ophthalmol. 1997;124:473–487. doi: 10.1016/s0002-9394(14)70863-3. [DOI] [PubMed] [Google Scholar]
- 45.Hidayat AA, Fine BS. Diabetic choroidopathy: light and electron microscopic observations of seven cases. Ophthalmology. 1985;92:512–522. [PubMed] [Google Scholar]
- 46.Hirvela H, Laatikainen L. Diabetic retinopathy in people aged 70 years or older. The Oulu Eye Study. Br J Ophthalmol. 1997;81:214–217. doi: 10.1136/bjo.81.3.214. [DOI] [PMC free article] [PubMed] [Google Scholar]
- 47.Shiraki K, Moriwaki M, Kohno T, et al. Age-related scattered hypofluorescent spots on late-phase indocyanine green angiograms. Int Ophthalmol. 1999;23:105–109. doi: 10.1023/a:1026571327117. [DOI] [PubMed] [Google Scholar]
- 48.Esmaeelpour M, Povazay B, Hermann B, et al. Mapping choroidal and retinal thickness variation in type 2 diabetes using three-dimensional 1060-nm optical coherence tomography. Invest Ophthalmol Vis Sci. 2011;52:5311–5316. doi: 10.1167/iovs.10-6875. [DOI] [PubMed] [Google Scholar]
- 49.Witkin AJ, Ko TH, Fujimoto JG, et al. Ultra-high resolution optical coherence tomography assessment of photoreceptors in retinitis pigmentosa and related diseases. Am J Ophthalmol. 2006;142:945–952. doi: 10.1016/j.ajo.2006.07.024. [DOI] [PMC free article] [PubMed] [Google Scholar]
- 50.Falsini B, Anselmi GM, Marangoni D, et al. Subfoveal choroidal blood flow and central retinal function in retinitis pigmentosa. Invest Ophthalmol Vis Sci. 2011;52:1064–1069. doi: 10.1167/iovs.10-5964. [DOI] [PubMed] [Google Scholar]
- 51.Yeoh J, Rahman W, Chen F, et al. Choroidal imaging in inherited retinal disease using the technique of enhanced depth imaging optical coherence tomography. Graefes Arch Clin Exp Ophthalmol. 2010;248:1719–1728. doi: 10.1007/s00417-010-1437-3. [DOI] [PubMed] [Google Scholar]
- 52■■.Dhoot DS, Huo S, Yuan A, et al. Evaluation of choroidal thickness in retinitis pigmentosa using enhanced depth imaging optical coherence tomography. Br J Ophthalmol. 2013;97:66–69. doi: 10.1136/bjophthalmol-2012-301917. This study analyzed the choroid using SD-OT in eyes with retinitis pigmentosa. It demonstrates that the eyes affected with retinitis pigmentosa have a significantly thinner choroid when compared with age-matched healthy eyes.
- 53.Torres VL, Brugnoni N, Kaiser PK, Singh AD. Optical coherence tomography enhanced depth imaging of choroidal tumors. Am J Ophthalmol. 2011;151:586–593. doi: 10.1016/j.ajo.2010.09.028. [DOI] [PubMed] [Google Scholar]
- 54■ ■.Freton A, Finger PT. Spectral domain-optical coherence tomography analysis of choroidal osteoma. Br J Ophthalmol. 2012;96:224–228. doi: 10.1136/bjo.2011.202408. This study describes the features of choroidal osteoma using SD-OCT. It demonstrates that SD-OCT provides deeper and higher resolution images of choroidal osteoma when compared with TD-OCT.
- 55■■.Adhi M, Bryant JS, Alwassia AA, et al. De-novo appearance of choroidal osteoma in an eye with previous branch retinal vein occlusion. Ophthalmic Surg Laser Imaging. 2013;44:77–80. doi: 10.3928/23258160-20121221-17. This case report describes a patient with a history of branch retinal vein occlusion (BRVO), who presented with a choroidal osteoma years after laser-induced photocoagulation for macular edema associated with BRVO. It shows the SD-OCT features of a choroidal osteoma.
- 56.Povazay B, Bizheva K, Hermann B, et al. Enhanced visualization of choroidal vessels using ultrahigh resolution ophthalmic OCT at 1050 nm. Opt Express. 2003;11:1980–1986. doi: 10.1364/oe.11.001980. [DOI] [PubMed] [Google Scholar]
- 57.Povazay B, Hermann B, Unterhuber A, et al. Three-dimensional optical coherence tomography at1050 nm versus 800 nm in retinal pathologies: enhanced performance and choroidal penetration in cataract patients. J Biomed Opt. 2007;12:041211. doi: 10.1117/1.2773728. [DOI] [PubMed] [Google Scholar]
- 58.Srinivasan VJ, Huber R, Gorczynska I, et al. High-speed, high-resolution optical coherence tomography retinal imaging with a frequency-swept laser at 850 nm. Opt Lett. 2007;32:361–363. doi: 10.1364/ol.32.000361. [DOI] [PubMed] [Google Scholar]
- 59.Huber R, Adler DC, Srinivasan VJ, Fujimoto JG. Fourier domain mode locking at 1050 nm for ultra-high-speed optical coherence tomography of the human retina at 236,000 axial scans per second. Opt Lett. 2007;32:2049–2051. doi: 10.1364/ol.32.002049. [DOI] [PubMed] [Google Scholar]
- 60.Izatt JA, Kulkarni MD, Yazdanfar S, et al. In vivo bidirectional color Doppler flow imaging of picoliter blood volumes using optical coherence tomography. Opt Lett. 1997;22:1439–1441. doi: 10.1364/ol.22.001439. [DOI] [PubMed] [Google Scholar]
- 61.Leitgeb R, Schmetterer L, Drexler W, et al. Real-time assessment of retinal blood flow with ultrafast acquisition by color Doppler Fourier domain optical coherence tomography. Opt Express. 2003;11:3116–3121. doi: 10.1364/oe.11.003116. [DOI] [PubMed] [Google Scholar]
- 62.White B, Pierce M, Nassif N, et al. In vivo dynamic human retinal blood flow imaging using ultrahigh-speed spectral domain optical coherence tomography. Opt Express. 2003;11:3490–3497. doi: 10.1364/oe.11.003490. [DOI] [PubMed] [Google Scholar]
- 63.Wang Y, Lu A, Gil-Flamer J, et al. Measurement of total blood flow in the normal human retina using Doppler Fourier-domain optical coherence tomography. Br J Ophthalmol. 2009;93:634–637. doi: 10.1136/bjo.2008.150276. [DOI] [PMC free article] [PubMed] [Google Scholar]
- 64.Leitgeb RA, Schmetterer L, Hitzenberger CK, et al. Real-time measurement of in vitro flow by Fourier-domain color Doppler optical coherence tomography. Opt Lett. 2004;29:171–173. doi: 10.1364/ol.29.000171. [DOI] [PubMed] [Google Scholar]
- 65.Makita S, Hong Y, Yamanari M, et al. Optical coherence angiography. Opt Express. 2006;14:7821–7840. doi: 10.1364/oe.14.007821. [DOI] [PubMed] [Google Scholar]
- 66.Miura M, Makita S, Iwasaki T, Yasuno Y. Three-dimensional visualization of ocular vascular pathology by optical coherence angiography in vivo. Invest Ophthalmol Vis Sci. 2011;52:2689–2695. doi: 10.1167/iovs.10-6282. [DOI] [PubMed] [Google Scholar]
- 67.Srinivasan VJ, Adler DC, Chen Y, et al. Ultrahigh-speed optical coherence tomography for three-dimensional and en face imaging of the retina and optic nerve head. Invest Ophthalmol Vis Sci. 2008;49:5103–5110. doi: 10.1167/iovs.08-2127. [DOI] [PMC free article] [PubMed] [Google Scholar]


