

Abstract
Irritable bowel syndrome (IBS) is a common gastrointestinal disorder characterized by recurring abdominal pain associated with alterations in bowel habits. We hypothesized patients with chronic visceral pain associated with IBS may have microstructural differences in the brain compared with healthy control subjects (HCs), indicative of long-term neural reorganization of chronic pain pathways and regions associated with sensory integration. In the current study we performed population-based voxel-wise DTI comparisons and probabilistic tractography in a large sample of phenotyped patients with IBS (n=33) and HCs (n=93). Patients had lower fractional anisotropy (FA) in thalamic regions, the basal ganglia and sensory/motor association/integration regions as well as higher FA in frontal lobe regions and the corpus callosum. In addition, patients had reduced mean diffusivity (MD), within the globus pallidus, and higher MD in the thalamus, internal capsule, and coronal radiata projecting to sensory/motor regions, suggestive of differential changes in axon/dendritic density in these regions. Sex differences in FA and MD were also observed in the patients but not in HCs. Probabilistic tractography confirmed a higher degree of connectivity in patients between the thalamus and pre-frontal cortex, as well as the medial dorsal thalamic nuclei and anterior cingulate cortex, and a lower degree of connectivity between the globus pallidus and thalamus. Together, these results support the hypothesis that patients with chronically recurring visceral pain from IBS have long-term microstructural changes within the brain, particular in regions associated with integration of sensory information and cortico thalamic modulation.
Introduction
Irritable bowel syndrome (IBS) is a common gastrointestinal disorder defined by symptoms of chronically recurring abdominal pain associated with alterations in bowel habits. Although the pathophysiology remains poorly understood, there is general consensus that it reflects alterations in brain-gut interactions [51]. Many of the alterations reported in IBS patients and pre-clinical models are consistent with altered CNS processing and modulation of visceral information including central pain amplification [50], altered autonomic output [68] and alterations in cognitive and affective functioning [5; 47; 44]. However, ongoing sensitization of primary visceral afferents generating persistently altered input into the central neuroaxis may also play a role in the observed CNS changes [51]. Based on these observations, and analogous to reports in other persistent pain syndromes [7; 36; 28; 53], we hypothesized that behavioral alterations observed in IBS patients may be associated with long-term microstructural reorganization in the brain. This hypothesis is also supported by reports demonstrating regional alterations in gray [17; 63] and white matter [23] in smaller samples of IBS patients.
Evidence for functional and structural brain changes in regions of the homeostatic afferent network, including thalamus, anterior cingulate cortex and insula subregions have been reported in IBS [67] and other persistent pain disorders [7]. Similar to the anterior insula, the basal ganglia (BG) play a prominent role in integration of multiple sensory and non-sensory information [26; 56]. Numerous studies have implicated the BG in the modulation and interpretation of both acute and chronic pain [8; 15; 25; 24; 19], while multiple persistent pain disorders, including IBS have shown altered functional responses in the BG in response to experimental stimuli [40; 10; 65; 67]. Since multisensory integration is known to occur within the BG [26; 56], it is conceivable that the microstructure of the BG may be altered in chronic pain. Based on these observations, we hypothesized that IBS patients may show microstructural alterations within regions of the homeostatic afferent network and the BG.
Diffusion tensor imaging (DTI) is a magnetic resonance imaging (MRI) technique that can elicit subvoxel, microstructural information within tissues by measuring both the directionality and magnitude of water self-diffusion [9]. The average apparent diffusion coefficient (ADC, or mean diffusivity MD), a measure of mean water mobility, as well as the fractional anisotropy (FA), a scalar measure of relative diffusion anisotropy, have been used as surrogate measures for microstructural integrity within the human brain. Recent DTI investigations involving a small number of patients have shown preliminary evidence for microstructural changes within sensory processing regions in patients with chronic pancreatitis [37], chronic back pain [20; 7], chronic pelvic pain [36], and chronic pain associated with IBS[23]. In the current study we aimed to determine if IBS patients show microstructural changes within the brain, by comparing voxel-wise DTI measurements within white matter tracts and deep gray matter structures in a large sample of phenotyped IBS patients and HCs. Additionally, we tested whether there were significant differences in the number of fiber tract connections between areas of the brain involved in pain processing between IBS and HCs using probabilistic DTI tractography.
Methods
Patients
A total of n = 126 volunteers were included, all enrolled in studies at the Center for Neurobiology of Stress between 2007 and 2011. The sample included 93 HCs and 33 age and sex matched subjects who met symptom criteria for IBS.[33] Mean age for the HCs was 30.4 ± 10.4 years old and 33.2 ± 10.8 years old for IBS patients (t-test, P = 0.191). Body mass index (BMI) was similar between healthy control volunteers and IBS patients (BMI, t-test, P = 0.122). Other patient characteristics, including abdominal pain severity and duration are shown in Table 1. All procedures complied with the principles of the Declaration of Helsinki and were approved by the Institutional Review Board at our institution.
Table 1.
Patient Characteristics
| HC(n = 93) | IBS (n = 33) | |
|---|---|---|
| Age | 30.4 +/− 10.4 | 33.2 +/− 10.8 |
| Sex | 21 Males / 72 Females | 12 Males / 21 Females |
| Body Mass Index | 23.6 +/− 3.0 | 24.7 +/− 4.6 |
| STAI Trait Anxiety | 42.1 +/− 7.7 | 48.2 +/− 9.6 |
| Overall Symptoms in Past Week (0–20) | 11.0 +/− 4.6 | |
| Usual Symptom Severity (1–5) | 3.2 +/− 0.7 | |
| Symptom Duration (Years) | 11.5 +/− 1.53 S.E.M. |
Usual Symptom Severity Score: 1=none; 2=mild; 3=moderate; 4=severe; 5=very severe
Diffusion Tensor Imaging (DTI)
Diffusion-weighted MR images (DWIs) were collected according to one of three acquisition schemes (Table 2). In the first acquisition scheme, DWIs were collected in 64 equidistant diffusion sensitizing directions with b = 1,000 s/mm2, along with a single b = 0 s/mm2 image, with echo time (TE)/repetition time (TR) = 96ms/7400ms; matrix size = 96x96; field-of-view (FOV)=288mm; and a slice thickness = 3mm with no interslice gap. In the second acquisition scheme, DWIs were again collected in 64 equidistant diffusion sensitizing directions with b = 1,000 s/mm2 along with a single b = 0 s/mm2 image using similar scan parameters to protocol #1, but on a different 3T MR system. TE, TR, FOV, directional information and slice thickness parameters were similar between these two acquisition schemes. The third acquisition scheme consisted of DWIs collected in a total of 61 equidistant diffusion sensitizing directions with b = 1,000 s/mm2 and a total of 8 b = 0 s/mm2 images interleaved within the 64 DWIs. TE was slightly shorter and TR was slightly longer in this protocol compared to the first two acquisition schemes, which allowed for slightly higher image resolution (128x128 matrix size and 2mm slice thickness). Acquisition scheme was used as a covariate in DTI analysis in order to determine the potential effects on group comparisons.
Table 2.
DTI Acquisition Protocols
| Acquisition Protocol #1 | Acquisition Protocol #2 | Acquisition Protocol #3 | |
|---|---|---|---|
| Scanner | Siemens Allegra | Siemens Trio | Siemens Trio |
| Field Strength | 3T | 3T | 3T |
| Echo Time (TE) | 96ms | 92.6ms | 88ms |
| Repetition Time (TR) | 7400ms | 7000ms | 9400ms |
| Matrix Size | 96x96 | 96x96 | 128x128 |
| Field-of-View (FOV) | 288mm | 288mm | 288mm |
| Slice Thickness (Gap) | 3mm (0mm) | 3mm (0mm) | 2mm (0mm) |
| Number of Directions | 64 | 64 | 61 |
| Number of b=0 images | 1 | 1 | 8 |
| Number of Patients | 54 | 50 | 22 |
After acquisition of DWIs, eddy-current and motion correction was performed using a 12-degree of freedom affine transformation using FSL (FMRIB; Oxford, UK; http://www.fmrib.ox.ac.uk/fsl/). The resulting registration matrices for each diffusion weighted image volume were used to update the b-matrices prior to calculation of the diffusion tensor. Data were then imported into the Analysis of Functional NeuroImages software package (AFNI; available at http://afni.nimh.nih.gov) and the 3x3 2nd order diffusion tensor was constructed. The eigenvalues and eigenvectors were extracted from the diffusion tensor and the mean diffusivity MD and FA were calculated [59].
Statistical Parameter Mapping
FA images for each patient were registered to the John’s Hopkins University DTI atlas (ICBM-DTI-81 1mm FA atlas) using a 12-degree of freedom linear affine transformation using FSL. After linear registration, elastic (nonlinear) registration was performed between individual FA maps and the ICBM-DTI-81 FA atlas using the FNIRT command in FSL. The transformation matrices (linear then nonlinear) were then used to align the other scalar metrics (ADC and eigenvalues) to the same atlas space.
Once each patient’s FA and MD maps were aligned to atlas space using both linear and nonlinear registration, white matter regions were segmented using an FA threshold of 0.3. Deep gray matter regions, including the thalamus and basal ganglia, were also included in the analysis. Statistical parameter maps (SPMs) were created by performing a voxel-wise t-test with covariates to test for regional differences between control and IBS patients for both FA and MD using AFNI. Specifically, a t-test was performed to compare control and IBS DTI measurements while accounting for age, sex, BMI, anxiety score, subjective symptom scores, and DTI acquisition protocol. The final SPMs consisted of voxels demonstrating statistical significance between groups or within covariates (t-test, P < 0.05), a false discovery rate (FDR), q < 0.05 [39], and a minimum cluster size of 250 μL. The use of a 250 μL minimum cluster size was chosen based on the cluster-based permutation correction technique outlined by Bullmore et al. [21] and corresponds to the minimum cluster size for less than a 5% chance of obtaining a cluster larger than this by chance. Briefly, data from all subjects were randomly assigned to two groups with equal numbers to the number of patients in the original groups (HCs and IBS). Statistical parameter mapping was performed for FA maps between these two randomly assigned groups using a voxel-wise t-test (without covariates). The volume of all statistically significant clusters (P < 0.05 and FDR q<0.05) was then documented. After 500 permutations using a similar technique of randomly assigning patients to two groups, the distribution of significant cluster sizes were examined. The minimum cluster size of 250 μL was then chosen based on the minimum cluster size for less than a 5% chance of obtaining a cluster larger than this by chance. This methodology is similar to other SPM techniques used to determine group differences in other MR measurements [39; 34; 35]. The image-processing pipeline is shown graphically in Figure 1.
Figure 1. Statistical parameter mapping (SPM) pipeline for DTI metrics.

A) FA maps from each patient were calculated, then B) registered to the ICBM-DTI-81 atlas using both linear and nonlinear registration. All other DTI measurements were then aligned using these transformation matrices. C) Regions with FA greater than 0.3 were threshold on the FA atlas to isolate regions of white matter. Regions of the thalamus and basal ganglia (BG) were also included in the mask. D) A t-test with covariates were performed using AFNI (3dttest++) in order to compare HCs to IBS patients while considering the scan protocol, subject age, sex, body mass index (BMI), and anxiety score. E) A statistical threshold of P < 0.05 and a false discovery rate (FDR) q < 0.05 were used to identify regions of statistical significance. F) Additionally, a minimum cluster size of 250 uL was used to further isolate regions of statistical significance in the final SPMs.
Probabilistic Tractography
Probabilistic DTI tractography was performed using the FMRIB Diffusion Toolbox (FDT & Probtrackx; FMRIB; Oxford, UK; http://www.fmrib.ox.ac.uk/fsl/fdt/). After DTI data for each patient was eddy current corrected, Markov Chain Monte Carlo sampling was used to build the diffusion orientation distribution functions (ODFs) for each voxel [11] using Bedpostx (BEDPOSTX; FMRIB; Oxford, UK; http://www.fmrib.ox.ac.uk/fsl/fdt/), modeling a total of 2 fibers per voxel and a total of 1000 iterations. After the distributions for each diffusion parameter were generated for each patient was created, seed and target ROIs were placed on specific anatomical landmarks in the MNI atlas to quantify the connectivity between these structures. A total of 5000 individual pathways were generated from the seed points using a step length of 0.5mm and a maximum of 2000 steps. A cosine curvature threshold of 0.2 (approximately 80 degrees) was used to limit how sharply pathways can deflect during tract generation. The log-transformed total number of fiber tracts passing from any point in the seed ROI through any region of the target ROI were retained and compared between IBS and HCs using the Mann-Whitney statistical test. Log-transformation was performed to improve both visualization and quantification of tract density data due to the wide variability in the number of tracts observed between IBS and HCs. The connectivity between the following structures were investigated based on regions thought to be involved in the chronic pain pathways [19; 54]: 1) fiber tracts passing between the thalamus and the pre-frontal cortex through the anterior cingulate cortex (ACC); 2) fiber tracts passing between the thalamus and pre-frontal cortex not passing through the ACC; 3) fiber tracts passing between the medial dorsal nucleus (MDN) of the thalamus and the ACC; 4) fibers passing between the ACC and the pre-frontal cortex; 5) fiber tracts passing between the ventral posterior nucleus (VPN) of the thalamus and the insula; 6) fiber tracts passing between the thalamus to the primary sensory cortex; 7) fibers passing between the ACC and the insula; and 8) fibers passing between the globus pallidus (GP) and the thalamus. (It is important to note the term “fiber tract” is used in the context of the”pseudo-axonal tracts” derived from DTI tractography and shouldn’t be confused with anatomical “white matter tracts”, as the relationship between DTI-derived and anatomical fiber tracts has not been fully established to date). Thalamic nuclei were identified from the regions of interest described in Behrens et al [12].
DTI Correlations of IBS Symptom Severity
Each IBS patient was phenotyped according to a range of parameters, including body mass index (BMI), STAI trait anxiety, and Bowel Symptom Questionnaire (BSQ) symptom severity. BSQ symptom severity was semi-quantitatively measured using a questionnaire that included an evaluation of each IBS patient’s “overall symptom severity within the past week”, ranging from 0 to 20. Average DTI measurements for MNI atlas-defined ROIs were calculated for each IBS patient and correlated with symptom severity scores. ROIs included regions in the thalamus, basal ganglia, globus pallidus, putamen, sensory and motor white matter tracts, among others. Additionally, we explored the correlation between fiber tract density from probabilistic tractography and symptom severity. Correlations between DTI parameters and IBS symptom severity were also compared within male and female groups. Pearson’s correlation coefficient was used to test whether symptom severity scores were linearly correlated with DTI measurements.
Results
High quality DTI data were obtained from all 126 subjects enrolled in the current study. SPMs showed no statistical difference in FA or MD between DTI acquisition protocols when they were used as a covariate (Table 2), suggesting these data may be combined and used for comparisons between HCs and IBS cohorts. Covariate analyses revealed no spatially-specific differences in FA or MD when comparing IBS and HCs with respect to age, sex, BMI, or anxiety score.
Fractional Anisotropy (FA) Differences between IBS and Healthy Controls
IBS patients have a substantially lower FA within the globus pallidus and putamen compared with HCs (Figure 2). Patients also had a lower FA within the thalamus (Figure 3A), primary and secondary somatosensory and motor regions (Figure 3B), as well as the posterior cingulate white matter bundle (Figure 3C). As illustrated in Table 3, the globus pallidus, medial thalamus, putamen, and substantia nigra were all significantly higher in HCs compared with IBS patients. When segmenting the thalamus into subsections based on the partitions proposed by Behrens et al. [12; 13], results suggested a significantly lower FA in patients compared with HC in thalamic regions which project to pre-frontal regions (Figure 4). IBS patients had higher FA values compared to HCs in pre-frontal white matter regions (Figure 3D) and specific regions within the corpus callosum (Figure 3E).
Figure 2. Differences in fractional anisotropy (FA) within the basal ganglia.

A) Axial SPMs showing a higher FA in the globus pallidus (GP) in HCs compared to patients with IBS, along with average color FA maps for both HCs and IBS patients showing dramatic changes within the basal ganglia. B) Coronal SPMs showing higher FA in the GP as well as the putamen in HCs when compared with IBS patients, which is also apparent when examining the average color FA maps for both HCs and IBS patients directly. Red arrows show regions of dramatic difference on color FA maps between HC and IBS patients.
Figure 3. SPMs showing regions of statistically different fractional anisotropy (FA) in IBS compared to HCs.

A) SPMs showing higher FA in the globus pallidus (GP), putamen, and medial thalamus in HCs compared with IBS patients. B) SPMs demonstrating higher FA in sensory and motor association regions as well as primary cortical projections from the thalamus in HCs compared with IBS patients. C) SPMs illustrating higher FA in the thalamus and posterior cingulate white matter in HCs compared with IBS patients. D) SPMs demonstrating higher FA in the frontal lobe and the anterior cingulate white matter regions in IBS patients compared to HCs. E) SPMs illustrating higher FA in regions of the corpus callosum in IBS patients compared with HCs.
Table 3. Regional FA differences between HC and IBS patients.
Level of significance, P = 0.0104. False discovery rate (FDR), q = 0.05. Minimum cluster size = 250 uL.
| Anatomic Region(s) | Cluster Volume [uL] | Control vs. IBS |
|---|---|---|
| Bilateral Globus Pallidus - Internal Segment | 11830 | Higher FA in Controls |
| Bilateral Thalamus - Medial Dorsal Nuclei | ||
| Bilateral Putamen | ||
| Bilateral Substantia Nigra | ||
| R. Coronal Radiata | 1886 | Higher FA in Controls |
| R. Sensory Association Fibers from Thalamus | ||
| R. S1/2 M1 | ||
| L. Coronal Radiata | 1814 | Higher FA in Controls |
| L. Sensory Association Fibers from Thalamus | ||
| L. S1/2 M1 | ||
| R. Posterior Cingulate (White Matter) | 915 | Higher FA in Controls |
| L. Posterior Cingulate (White Matter) | 488 | Higher FA in Controls |
| R. Anterior Cingulate (White Matter) | 2013 | Higher FA in IBS |
| R. Pre-Frontal White Matter Projections | ||
| L. Anterior Cingulate (White Matter) | 1032 | Higher FA in IBS |
| L. Pre-Frontal White Matter Projections | ||
| Corpus Callosum | 2129 | Higher FA in IBS |
Figure 4. Statistical parameter maps (SPMs) for fractional anisotropy (FA) in the thalamus.
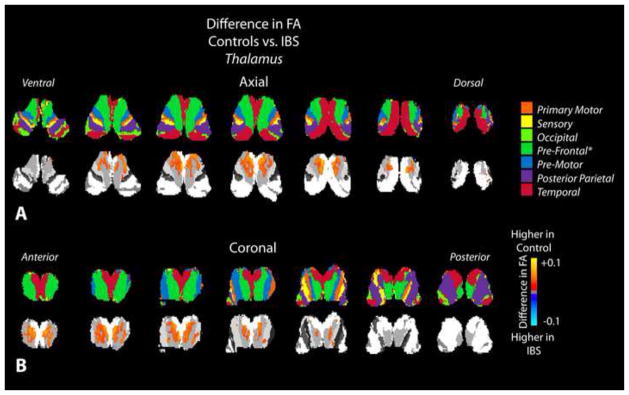
A) Axial and B) coronal slices through the thalamus including the partitions proposed by Behrens et al. [12; 13] (top row) and SPMs (bottom row), suggesting a higher FA in thalamic areas connected to prefrontal regions in healthy controls compared to IBS patients.
MD Differences between IBS and Healthy Controls
In addition to a lower FA within the globus pallidum, IBS patients also had statistically lower MD within the same region compared to HCs (Figure 5). Patients demonstrated a substantially higher MD compared with HCs within a large volume of tissue extending from the internal capsule and thalamus through the corona radiata aligned near sensory and motor projections (Figure 6). Segmentation of the thalamus using the partitions proposed by Behrens et al. [12; 13] indicated an elevated MD in IBS within thalamic regions associated with sensory, pre-frontal, and posterior parietal regions (Figure 7).
Figure 5. Differences in mean diffusivity (MD) within the basal ganglia.

A) Axial and B) coronal SPMs demonstrating elevated MD within the globus pallidus (GP) in HCs compared with IBS patients. This difference in MD between HCs and IBS patients can also be observed by visual examination of the average color MD for each group.
Figure 6. SPMs comparing mean diffusivity (MD) between healthy controls and IBS patients in the internal capsule, thalamus, and coronal radiata.

SPMs demonstrate an elevated MD in patients with IBS compared to HCs in the internal capsule, thalamus, and coronal radiata.
Figure 7. Statistical parameter maps (SPMs) comparing mean diffusivity (MD) between healthy controls and IBS patients in the thalamus.
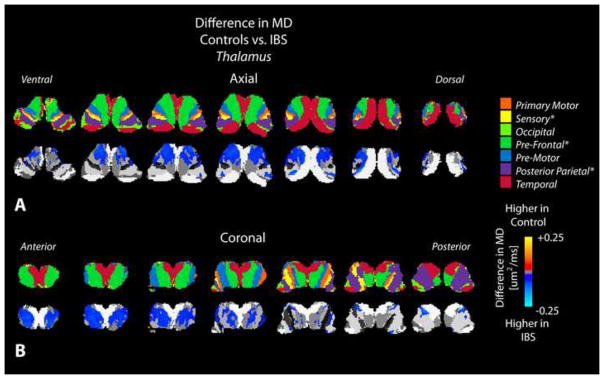
A) Axial and B) coronal slices through the thalamus including the partitions proposed by Behrens et al. [12; 13] (top row) and SPMs (bottom row), suggesting a higher MD in thalamic areas connected to sensory, prefrontal, and posterior parietal regions in IBS patients compared to healthy controls.
Sex Differences in FA and MD within IBS Patients
No spatially-specific correlation between FA or MD and sex was found within HCs; however, the data suggested differences in both FA and MD existed between males and females within the patient group. Specifically, female IBS patients had a statistically lower FA within the globus pallidum, regions of the thalamus, and primary sensory and motor regions compared to male IBS subjects (Figure 8A). Additionally, female patients had statistically higher MD within the coronal radiata, thalamic regions, and cingulate white matter bundle compared with male subjects (Figure 8B); however, female subjects also had significantly lower MD within the globus pallidum. (Figure 8B).
Figure 8. SPMs comparing FA and MD between male and female IBS patients.

A) SPMs clearly demonstrate a significantly higher FA in male compared with female IBS patients within the globus pallidus (GP), medial thalamic regions, and primary somatosensory and motor regions. B) SPMs examining the difference in MD between male and female IBS patients illustrate a significantly higher MD in female compared with male IBS patients in the coronal radiata, thalamus, and posterior cingulate white matter; however, male IBS patients had a significantly higher MD in the globus pallidus (GP) compared with female IBS patients.
Probabilistic Tractography in Chronic Pain Pathways
Probabilistic tractography was performed between various structures involved in the chronic pain pathway to explore differences in relative structural connectivity between IBS and HCs. Connections passing between the MDN of the thalamus and pre-frontal cortex showed a significantly higher number of connections in IBS patients compared with HCs (Figure 9A and 9B; Mann-Whitney, P = 0.0005), consistent with greater structural connectivity between these regions. This apparent increase was not due to direct connections between the thalamus and pre-frontal cortex, which were not significant different between the two populations (Mann-Whitney, P = 0.9717), but rather were likely due to connections passing through the ACC to the pre-frontal cortex, as the number of connections passing between the MDN and ACC were also significantly higher in IBS patients compared to HCs (Figure 9C; Mann-Whitney, P = 0.0002). Additionally, IBS patients showed a reduced connectivity between regions of the globus pallidus and the thalamus compared with HCs (Figure 9D; Mann-Whitney, P = 0.0189). No difference in the number of connections between IBS and ICs were detected for the ACC and pre-frontal cortex (Mann-Whitney, P = 0.4455), ACC and insula (Mann-Whitney, P = 0.6635), thalamus and primary sensory cortex (Mann-Whitney, P = 0.0979), or the thalamus and insula (Mann-Whitney, P = 0.2863).
Figure 9. Probabilistic tractography and structural connectivity in specific chronic pain pathways.

A) Example DTI fiber tract density images connecting the thalamus to prefrontal cortex in a HC (top) and IBS patient (bottom). Results illustrate a lower tract density in these pathways in HCs compared with IBS patients. B) Number of tracts connecting the thalamus to prefrontal cortical regions were significantly higher (Mann-Whitney, P =0.0005) in IBS patients (median = 1,398,000 tracts) compared with HCs (median = 630,312 tracts). C) Number of tracts connecting the medial dorsal nuclei (MDN) to the anterior cingulate cortex (ACC) were significantly higher (Mann-Whitney, P = 0.0002) in IBS patients (median = 168,000 tracts) compared with HCs (median = 36,875 tracts). D) Number of tracts connecting the globus pallidus (GP) to the thalamus are significantly lower (Mann-Whitney, P = 0.0189) in IBS patients (median = 1,713 tracts) compared with HCs (median = 9,382 tracts).
DTI Correlations of IBS Symptom Severity
Results suggest BSQ-defined overall symptom severity scores were weakly correlated with average FA within the GP, average MD within the primary sensory cortex, log-transformed number of fiber tracts between the thalamus and primary sensory cortex, and log-transformed number of tracts between the thalamus and insula. Specifically, average FA within the GP was negatively correlated with overall symptom severity (Pearson’s correlation coefficient, R2 = 0.1475, P = 0.0397), suggesting a decrease in directional coherence of structures within the GP for increasing in symptom severity. Average MD in the white matter regions adjacent to the primary sensory cortex were positively correlated with symptom severity (R2 = 0.2010, P = 0.0190), indicating that microstructural density of white matter regions near the sensory cortex may decrease with increasing severity of perceived chronic pain. When exploring the relationships between the number of fiber tracts estimated from probabilistic tractography and IBS symptom severity, results suggested the log-transformed number of fiber tracts connecting the thalamus and primary sensory cortex (R2 = 0.2979, P = 0.0191) and the log-transformed number of fiber tracts connecting the thalamus and insula (R2 = 0.1755, P = 0.0466) were both negatively correlated with overall symptom severity. These results support the hypothesis that perceived IBS symptom severity may be related to decreased connectivity between the thalamus and both primary sensory cortex as well as insular regions. No other DTI indices illustrated statistically significant linear correlations with IBS symptom severity.
The correlation between DTI parameters and IBS symptom severity was also examined with respect to patient sex. Results suggested a negative correlation between IBS symptom severity and average FA within the BG (R2 =0.4793, P = 0.0182), ACC (R2 = 0.4199, P = 0.0311), and white matter regions near the insula (R2 = 0.4086, P = 0.0342) within male patients; however, no statistically significant correlations were found between mean FA measurements and IBS symptoms within female patients. Female patients, on the other hand, exhibited a positive correlation between IBS overall symptom severity and mean MD within the BG (R2 = 0.2902, P = 0.0257), putamen (R2 = 0.3559, P = 0.0115), and white matter regions adjacent to the primary somatosensory cortex (R2 = 0.2585, P = 0.0372). Male patients exhibited similar trends with mean MD (BG, R2 = 0.3628, P = 0.0861 and putamen, R2 = 0.3852, P = 0.074); however, male patients also demonstrated a statistically significant positive correlation between mean MD within white matter regions adjacent to the insula (R2 = 0.4860, P = 0.0369). Both males and females demonstrated a strong negative correlation between the log-transformed number of DTI-derived fiber tracts connecting the thalamus and primary somatosensory cortex (Males, R2 = 0.6933, P = 0.0397; Females, R2 = 0.6042, P = 0.0011). In males, we also observed a negative correlation between IBS symptom severity and the log-transformed number of connections between the thalamus and prefrontal cortex (with or without passing through the ACC; R2 = 0.6610, P = 0.0492) and between the ACC and insula (R2 = 0.7232, P = 0.0319).
Discussion
Consistent with the neurobiological differences noted in studies of brain function, [69; 46; 29; 60; 17; 67], and cortical gray matter in IBS [64] we now describe marked alterations in white matter and subcortical gray matter structure in a sample of male and female IBS patients. Evidence of significant microstructural changes were identified in deep gray matter structures associated with pain processing/modulation, including the BG and thalamic regions, as well as changes within white matter structures within the frontal lobe and the corona radiata adjacent to the primary and secondary sensory regions.
Altered fractional anisotropy of cortico-thalamic-basal ganglia circuits
The most prominent microstructural findings differentiating IBS from HCs were observed in the BG and thalamus (Figures 2, 4, 5, and 7). While often not the primary focus in task related functional imaging studies in IBS, the BG are an integral part of pain processing and have been shown to have functional alterations during experimental pain in IBS [65; 67]. As a multisensory integration site, the BG have connections to the thalamus and multiple cortical sites, forming cortico-BG-thalamic-cortical loops that may serve to modulate pain related behavior and learning [41; 32; 19]. Abnormal function of these circuits may thus be involved in the complex interactions between pain, emotion and behavior seen in IBS and other, often overlapping pain syndromes, such as fibromyalgia, vulvodynia, and interstitial cystitis/painful bladder syndrome [49; 3]. We report here that IBS subjects show lower FA and higher MD in the putamen, thalamus, and thalamic radiations to sensory motor regions bilaterally, consistent with reduced axon or dendritic density and directional coherence (Figure 12) in the cortico-BG-thalamic-cortical loops associated with pain. The putamen is involved in somatotopic modulation of pain [16; 66], through the dopaminergic system [42], and has been shown by DTI tractography to be physically connected to the other regions involved in modulation of pain [66]. The putamen has shown decreased gray matter volume in chronic pelvic pain [4] and IBS [43]. The thalamic region that showed decreased FA in IBS is associated with projections to the anterior cingulate and prefrontal cortices, however, in contrast to the thalamus, the FA in the prefrontal cortex is higher in IBS, as are the number of tracts connecting the thalamus to the prefrontal cortex. This imbalance in cortico-BG-thalamic-cortical interactions may bias the response to incoming viscerosensory signals in IBS. It is conceivable these changes, which appear within regions of well described pain circuits, may be due to long-term activation of prefrontal regions in expectation of abdominal pain/discomfort or due to modulation of chronic sensory input resulting in an increase in the coherence of frontal axon fiber orientation. Another possibility would be the longstanding presence of increased viscerosensory input from the periphery (e.g. due to sensitization of visceral afferent pathways), however in that setting one might expect less prominent differences in the frontal cortex and would postulate greater differences in the corticospinal tracts.
Figure 12. DTI interpretation of connectivity in the major chronic pain pathways in IBS.
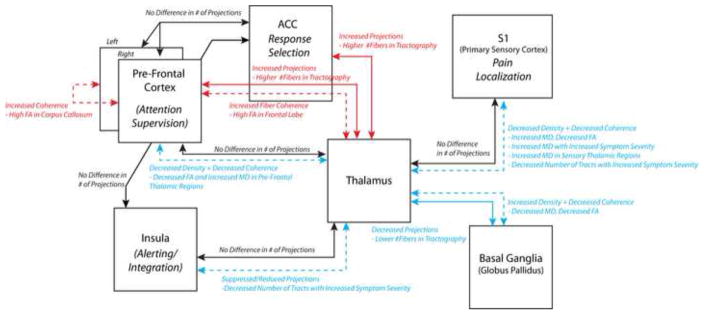
Probabilistic tractography connectivity between regions, reflecting the relative number of fiber tracts, are shown in solid arrows; whereas interpretation of voxel-based analysis of DTI indices, e.g. FA and MD reflecting directional coherence and density of microstructure, are shown in dashed arrows. Red connections indicate increased connectivity, coherence, or density in IBS compared with HCs; blue connections indicate decreased connectivity, coherence, or density in IBS patients compared with HCs; and black connections indicate no difference in connectivity, coherence or density.
Fractional anisotropy measures the movement of water molecules along an elipsoid tensor, thus evaluates for the presence of organized, constrained pathways in a brain region. This is often interpreted to be a measure of white matter tract integrity, myelinization, or fiber tract size and coherence. Mean diffusivity estimates the overall (multidirectional) diffusion within a region, where high diffusivity implies less structural density. Although a decrease in FA typically coincides with an increase in MD in many pathologic conditions, in the globus pallidus region we observed a significant reduction in both FA and MD in IBS patients compared to HCs. This combination of DTI features may imply a greater density of neural fibers or dendritic arborizations resulting in a decreased MD [62] and a decrease in the coherence of axon or dendritic fiber orientations resulting in a decreased FA (see Figure 12). Prior evidence implicates the globus pallidus in the modulation and behavioral responses to pain. Specifically, the globus pallidus has been shown to be involved in modulation of pain via the endogenous opioid system [31; 18; 61], and bilateral stimulation of this region has shown to decrease chronic pain in patients with dystonia [30; 45; 27]. Thus, the DTI changes observed in the current study appear consistent with repeated activation of the GP associated with the recurrent experience of abdominal pain resulting in an increase in the number of dendritic arborizations without a corresponding increase in the coherence of fiber directionality.
Showing a more expected pattern, we observed a significantly lower FA in other pain related areas, including regions of the putamen, substantia nigra, and white matter regions associated with projection of somatosensory and motor information with an increase in MD within these regions. This pattern of FA and MD measurements may imply a reduction in projections and density of neural fibers in these regions, which may be due to chronic engagement of the pain circuitry. Based on the existing evidence that improvements in brain structure can occur following successful interventions and/or symptom relief, it is more likely that the microstructural changes observed here are a consequences of altered input from the periphery, and less likely due to pre-existing vulnerability factors at the CNS level [57; 52; 64].
Sex Differences in DTI metrics within IBS Patients
As with many other chronic pain conditions and disorders of mood, IBS is more common in women [22] and sex-related differences in the autonomic, perceptual, and emotional responses of IBS patients to aversive visceral stimuli have been reported [22]. Sex differences in abnormalities of brain function and structure in the setting of chronic pain are less well described [48]. The sex differences we show in FA and MD within the IBS group suggest more pronounced white matter changes in female patients, but are restricted to the same regions, which differed between HC and IBS.
Brain structure in persistent pain syndromes
Results from the current study support the hypothesis that chronic IBS results in microstructural reorganization of chronic pain pathways (Figure 12). Converging evidence from studies using multiple neuroimaging modalities in other persistent pain conditions [7; 28] is consistent with the limited number of reports on IBS related alterations in brain structure and function, including the current report. In a sample of healthy subjects, Moisset et al have shown that the white matter tracts associated with functional activation during visceral pain can be identified with DTI, including tracts connecting the thalamus, somatosensory cortex, prefrontal cortex (including the anterior cingulate cortex) and insula [54]. The current results strongly support this previous observations, suggesting strong differences in fiber tract connectivity between the thalamus and prefrontal cortex along with the thalamus and ACC. Additionally, we observed a significant correlation between perceived symptom severity and connectivity between the thalamus and somatosensory cortex as well as the thalamus and insula, further supporting these previous observations. Although we observed apparent alterations in brain microstructure in IBS patients compared with HCs, as well as microstructural changes that correlate with symptom severity, the specific cell types involved in these alterations cannot be definitely delineated with DTI. Thus, the current study cannot precisely determine whether neural reorganization occurs within the brain of chronic IBS patients.
To date the only report of altered white matter structure in IBS is from a small sample (n=10) in which a region of interest analysis showed increased FA in the fornix and external capsule [23]. Abnormalities in the prefrontal cortex and basal ganglia appear to be shared across a number of persistent pain syndromes [1], though some syndrome specific abnormalities may be expected. In temporomandibular disorder, decreases in FA similar to those noted in the current study were found in the thalamus, cingulum, and somatosensory regions [53]. In complex regional pain syndrome, decreases in FA in the cingulum and altered functional connectivity have been documented [38; 2]. Although no strong group differences were observed, Farmer et al. [36] reported disruption in the interactions between white matter (as measured by the FA skeleton) and gray matter in chronic prostatitis/chronic pelvis pain, a population in which prefrontal gray matter changes were prominent. White matter and subcortical gray matter structures have also been reported in patients with disorders of mood [58; 14; 55; 6]. Given the high prevalence of trait anxiety and the increased frequency of anxiety and depressive disorders in persistent pain syndromes, subjects with a DSM4 diagnosis of psychiatric disease were excluded from the study and the degree of current subclinical anxiety and depressive symptoms were included as a covariate in our analyses. While these affective symptoms explained a significant portion of the variance in in our previous study of gray matter changes in IBS [63], they did not play a significant role in the DTI results reported here. The specific role that the observed changes in brain microstructure play in IBS symptom development and/or persistence remains unclear. Examination of the time course over which changes in brain structure develop, their potential response to effective treatment, and variation with the natural fluctuations in symptoms seen in the course of the syndrome will be required to put these observations in clinical context.
Conclusions
IBS patients show a pattern of altered white matter and subcortical gray matter microstructure consistent with impairment of the cortico-thalamic-BG-cortical loops involved in processing of pain related signals. These results imply long-term microstructural reorganization associated with chronic visceral pain, as illustrated in Figure 12. Future longitudinal studies in larger patient populations need to evaluate if pharmacological or non-pharmacological treatment responses are associated with normalization of the observed alterations.
Figure 10. Significant correlations between DTI metrics and symptom severity in patients with IBS.

A) A significant negative correlation was detected between the average FA within the globus pallidus (GP), measured bilaterally, and the overall symptom severity on a BSQ (Pearson’s correlation coefficient, R2 = 0.1475, P = 0.0397). B) A significant positive correlation was also detected between average MD within the white matter regions adjacent to the primary sensory cortex, measured bilaterally, and the overall symptom severity on a BSQ (Pearson’s correlation coefficient, R2 = 0.2010, P = 0.0190). C) A significant negative correlation was found between the log-transformed number of fiber tracts connecting the thalamus and primary sensory cortex, as measured from probabilistic DTI tractography, and overall symptom severity on a BSQ (Pearson’s correlation coefficient, R2 = 0.2979, P = 0.0191). D) A significant negative correlation was also detected between the log-transformed number of fiber tracts connecting the thalamus and insula and overall symptom severity (Pearson’s correlation coefficient, R2 = 0.1755, P = 0.0466).
Figure 11. Microstructural interpretation of specific changes in fractional anisotropy (FA) and mean diffusivity (MD).

Top Left: In voxels with high MD and high FA, axons or dendritic arborizations are loosely packed (high MD) but maintain high directional coherence (high FA). Top Right: In voxels with low MD and high FA, axons or dendritic arborizations are tightly packed (low MD) and have a high degree of directional coherence (high FA). Bottom Left: In voxels with high MD and low FA, axons or dendritic arborizations are loosely packed (high MD) and lack directional coherence (low FA). Bottom Right: In voxels with low MD and low FA, axons or dendritic arborizations are tightly packed (low MD) but lack directional coherence (low FA).
Table 4. Regional MD differences between HC and IBS patients.
Level of significance, P = 0.0207. False discovery rate (FDR), q = 0.05. Minimum cluster size = 250 uL.
| Anatomic Region(s) | Cluster Volume [uL] | Control vs. IBS |
|---|---|---|
| Bilateral Coronal Radiata | 65135 | Higher MD in IBS |
| Bilateral Thalamus - Medial Dorsal Nuclei | ||
| Bilateral Putamen | ||
| Periaqueductal Gray Matter in Midbrain | 2977 | Higher MD in IBS |
| Bilateral Substantia Nigra | ||
| L. Globus Pallidus | 1770 | Higher MD in Controls |
| R. Globus Pallidus | 1195 | Higher MD in Controls |
Summary.
The current study involving patients with chronic visceral pain associated with irritable bowel syndrome (IBS) demonstrates microstructural differences in the brain compared with healthy control subjects (HCs), indicative of long-term neural reorganization of chronic pain pathways and regions associated with sensory integration.
Acknowledgments
Grant Support: NIH/NCI 1 R21 CA167354-01 (BME); UCLA Institute for Molecular Medicine Seed Grant (BME); UCLA Radiology Exploratory Research Grant (BME); University of California Cancer Research Coordinating Committee Grant (BME); ACRIN Young Investigator Initiative Grant (BME); NIDDK grants DK 058351 (EAM) and DK 064539 (EAM)
Footnotes
Conflicts of Interest
No authors have any conflicts of interest regarding the subject matter in this manuscript.
Publisher's Disclaimer: This is a PDF file of an unedited manuscript that has been accepted for publication. As a service to our customers we are providing this early version of the manuscript. The manuscript will undergo copyediting, typesetting, and review of the resulting proof before it is published in its final citable form. Please note that during the production process errors may be discovered which could affect the content, and all legal disclaimers that apply to the journal pertain.
References
- 1.Apkarian AV. The brain in chronic pain: clinical implications. Pain Manag. 2011;1(6):577–586. doi: 10.2217/pmt.11.53. [DOI] [PMC free article] [PubMed] [Google Scholar]
- 2.Apkarian AV, Hashmi JA, Baliki MN. Pain and the brain: specificity and plasticity of the brain in clinical chronic pain. Pain. 2011;152(3 Suppl):S49–64. doi: 10.1016/j.pain.2010.11.010. [DOI] [PMC free article] [PubMed] [Google Scholar]
- 3.Arendt-Nielsen L, Graven-Nielsen T, Petrini L. In: Experimental Human Models and Assessment of Pain in Non-pain Conditions. Giamberardino MA, Jenseneditors TS, editors. Book Title|, Vol. Volume|. City|: Publisher|, Year|. p.^pp. Pages|. [Google Scholar]
- 4.As-Sanie S, Harris RE, Napadow V, Kim J, Neshewat G, Kairys A, Williams D, Clauw DJ, Schmidt-Wilcke T. Changes in regional gray matter volume in women with chronic pelvic pain: a voxel-based morphometry study. Pain. 2012;153(5):1006–1014. doi: 10.1016/j.pain.2012.01.032. [DOI] [PMC free article] [PubMed] [Google Scholar]
- 5.Attree EA, Dancey CP, Keeling D, Wilson C. Cognitive function in people with chronic illness: inflammatory bowel disease and irritable bowel syndrome. Appl Neuropsychol. 2003;10(2):96–104. doi: 10.1207/S15324826AN1002_05. [DOI] [PubMed] [Google Scholar]
- 6.Ayling E, Aghajani M, Fouche JP, van der Wee N. Diffusion tensor imaging in anxiety disorders. Curr Psychiatry Rep. 2012;14(3):197–202. doi: 10.1007/s11920-012-0273-z. [DOI] [PubMed] [Google Scholar]
- 7.Baliki MN, Schnitzer TJ, Bauer WR, Apkarian AV. Brain morphological signatures for chronic pain. PLoS One. 2011;6(10):e26010. doi: 10.1371/journal.pone.0026010. [DOI] [PMC free article] [PubMed] [Google Scholar]
- 8.Barker RA. The basal ganglia and pain. Int J Neurosci. 1988;41(1–2):29–34. doi: 10.3109/00207458808985739. [DOI] [PubMed] [Google Scholar]
- 9.Basser PJ, Mattiello J, LeBihan D. MR diffusion tensor spectroscopy and imaging. Biophys J. 1994;66(1):259–267. doi: 10.1016/S0006-3495(94)80775-1. [DOI] [PMC free article] [PubMed] [Google Scholar]
- 10.Becerra L, Morris S, Bazes S, Gostic R, Sherman S, Gostic J, Pendse G, Moulton E, Scrivani S, Keith D, Chizh B, Borsook D. Trigeminal neuropathic pain alters responses in CNS circuits to mechanical (brush) and thermal (cold and heat) stimuli. The Journal of neuroscience : the official journal of the Society for Neuroscience. 2006;26(42):10646–10657. doi: 10.1523/JNEUROSCI.2305-06.2006. [DOI] [PMC free article] [PubMed] [Google Scholar]
- 11.Behrens TE, Berg HJ, Jbabdi S, Rushworth MF, Woolrich MW. Probabilistic diffusion tractography with multiple fibre orientations: What can we gain? Neuroimage. 2007;34(1):144–155. doi: 10.1016/j.neuroimage.2006.09.018. [DOI] [PMC free article] [PubMed] [Google Scholar]
- 12.Behrens TE, Johansen-Berg H, Woolrich MW, Smith SM, Wheeler-Kingshott CA, Boulby PA, Barker GJ, Sillery EL, Sheehan K, Ciccarelli O, Thompson AJ, Brady JM, Matthews PM. Non-invasive mapping of connections between human thalamus and cortex using diffusion imaging. Nat Neurosci. 2003;6(7):750–757. doi: 10.1038/nn1075. [DOI] [PubMed] [Google Scholar]
- 13.Behrens TE, Woolrich MW, Jenkinson M, Johansen-Berg H, Nunes RG, Clare S, Matthews PM, Brady JM, Smith SM. Characterization and propagation of uncertainty in diffusion-weighted MR imaging. Magn Reson Med. 2003;50(5):1077–1088. doi: 10.1002/mrm.10609. [DOI] [PubMed] [Google Scholar]
- 14.Benedetti F, Yeh PH, Bellani M, Radaelli D, Nicoletti MA, Poletti S, Falini A, Dallaspezia S, Colombo C, Scotti G, Smeraldi E, Soares JC, Brambilla P. Disruption of white matter integrity in bipolar depression as a possible structural marker of illness. Biol Psychiatry. 2011;69(4):309–317. doi: 10.1016/j.biopsych.2010.07.028. [DOI] [PubMed] [Google Scholar]
- 15.Bernard JF, Huang GF, Besson JM. Nucleus centralis of the amygdala and the globus pallidus ventralis: electrophysiological evidence for an involvement in pain processes. J Neurophysiol. 1992;68(2):551–569. doi: 10.1152/jn.1992.68.2.551. [DOI] [PubMed] [Google Scholar]
- 16.Bingel U, Glascher J, Weiller C, Buchel C. Somatotopic representation of nociceptive information in the putamen: an event-related fMRI study. Cereb Cortex. 2004;14(12):1340–1345. doi: 10.1093/cercor/bhh094. [DOI] [PubMed] [Google Scholar]
- 17.Blankstein U, Chen J, Diamant NE, Davis KD. Altered brain structure in irritable bowel syndrome: potential contributions of pre-existing and disease-driven factors. Gastroenterology. 2010;138(5):1783–1789. doi: 10.1053/j.gastro.2009.12.043. [DOI] [PubMed] [Google Scholar]
- 18.Bloom FE. The endorphins: a growing family of pharmacologically pertinent peptides. Annu Rev Pharmacol Toxicol. 1983;23:151–170. doi: 10.1146/annurev.pa.23.040183.001055. [DOI] [PubMed] [Google Scholar]
- 19.Borsook D, Upadhyay J, Chudler EH, Becerra L. A key role of the basal ganglia in pain and analgesia--insights gained through human functional imaging. Mol Pain. 2010;6:27. doi: 10.1186/1744-8069-6-27. [DOI] [PMC free article] [PubMed] [Google Scholar]
- 20.Buckalew N, Haut MW, Aizenstein H, Morrow L, Perera S, Kuwabara H, Weiner DK. Differences in brain structure and function in older adults with self-reported disabling and nondisabling chronic low back pain. Pain Med. 2010;11(8):1183–1197. doi: 10.1111/j.1526-4637.2010.00899.x. [DOI] [PMC free article] [PubMed] [Google Scholar]
- 21.Bullmore ET, Suckling J, Overmeyer S, Rabe-Hesketh S, Taylor E, Brammer MJ. Global, voxel, and cluster tests, by theory and permutation, for a difference between two groups of structural MR images of the brain. IEEE Trans Med Imaging. 1999;18(1):32–42. doi: 10.1109/42.750253. [DOI] [PubMed] [Google Scholar]
- 22.Chang L, Heitkemper MM. Gender differences in irritable bowel syndrome. Gastroenterology. 2002;123(5):1686–1701. doi: 10.1053/gast.2002.36603. [DOI] [PubMed] [Google Scholar]
- 23.Chen JY, Blankstein U, Diamant NE, Davis KD. White matter abnormalities in irritable bowel syndrome and relation to individual factors. Brain Res. 2011;1392:121–131. doi: 10.1016/j.brainres.2011.03.069. [DOI] [PubMed] [Google Scholar]
- 24.Chudler EH. Response properties of neurons in the caudate-putamen and globus pallidus to noxious and non-noxious thermal stimulation in anesthetized rats. Brain Res. 1998;812(1–2):283–288. doi: 10.1016/s0006-8993(98)00971-8. [DOI] [PubMed] [Google Scholar]
- 25.Chudler EH, Dong WK. The role of the basal ganglia in nociception and pain. Pain. 1995;60(1):3–38. doi: 10.1016/0304-3959(94)00172-B. [DOI] [PubMed] [Google Scholar]
- 26.Chudler EH, Sugiyama K, Dong WK. Multisensory convergence and integration in the neostriatum and globus pallidus of the rat. Brain Res. 1995;674(1):33–45. doi: 10.1016/0006-8993(94)01427-j. [DOI] [PubMed] [Google Scholar]
- 27.Coubes P, Roubertie A, Vayssiere N, Hemm S, Echenne B. Treatment of DYT1-generalised dystonia by stimulation of the internal globus pallidus. Lancet. 2000;355(9222):2220–2221. doi: 10.1016/S0140-6736(00)02410-7. [DOI] [PubMed] [Google Scholar]
- 28.Davis KD, Moayedi M. Central Mechanisms of Pain Revealed Through Functional and Structural MRI. J Neuroimmune Pharmacol. 2012 doi: 10.1007/s11481-012-9386-8. [DOI] [PubMed] [Google Scholar]
- 29.Davis KD, Pope G, Chen J, Kwan CL, Crawley AP, Diamant NE. Cortical thinning in IBS: implications for homeostatic, attention, and pain processing. Neurology. 2008;70(2):153–154. doi: 10.1212/01.wnl.0000295509.30630.10. [DOI] [PubMed] [Google Scholar]
- 30.Davis KD, Taub E, Houle S, Lang AE, Dostrovsky JO, Tasker RR, Lozano AM. Globus pallidus stimulation activates the cortical motor system during alleviation of parkinsonian symptoms. Nat Med. 1997;3(6):671–674. doi: 10.1038/nm0697-671. [DOI] [PubMed] [Google Scholar]
- 31.DiFiglia M, Aronin N, Martin JB. Light and electron microscopic localization of immunoreactive Leu-enkephalin in the monkey basal ganglia. J Neurosci. 1982;2(3):303–320. doi: 10.1523/JNEUROSCI.02-03-00303.1982. [DOI] [PMC free article] [PubMed] [Google Scholar]
- 32.Draganski B, Kherif F, Kloppel S, Cook PA, Alexander DC, Parker GJ, Deichmann R, Ashburner J, Frackowiak RS. Evidence for segregated and integrative connectivity patterns in the human Basal Ganglia. The Journal of neuroscience : the official journal of the Society for Neuroscience. 2008;28(28):7143–7152. doi: 10.1523/JNEUROSCI.1486-08.2008. [DOI] [PMC free article] [PubMed] [Google Scholar]
- 33.Drossman DA. The functional gastrointestinal disorders and the Rome III process. Gastroenterology. 2006;130(5):1377–1390. doi: 10.1053/j.gastro.2006.03.008. [DOI] [PubMed] [Google Scholar]
- 34.Ellingson BM, Cloughesy TF, Pope WB, Zaw TM, Phillips H, Lalezari S, Nghiemphu PL, Ibrahim H, Naeini KM, Harris RJ, Lai A. Anatomic localization of O6-methylguanine DNA methyltransferase (MGMT) promoter methylated and unmethylated tumors: a radiographic study in 358 de novo human glioblastomas. Neuroimage. 2012;59(2):908–916. doi: 10.1016/j.neuroimage.2011.09.076. [DOI] [PubMed] [Google Scholar]
- 35.Ellingson BM, Lai A, Harris RJ, Selfridge JM, Yong WH, Das K, Pope WB, Nghiemphu PL, Vinters HV, Liau LM, Mischel PS, Cloughesy TF. Probabilistic Radiographic Atlas of Glioblastoma Phenotypes. AJNR Am J Neuroradiol. 2012 doi: 10.3174/ajnr.A3253. [DOI] [PMC free article] [PubMed] [Google Scholar]
- 36.Farmer MA, Chanda ML, Parks EL, Baliki MN, Apkarian AV, Schaeffer AJ. Brain functional and anatomical changes in chronic prostatitis/chronic pelvic pain syndrome. J Urol. 2011;186(1):117–124. doi: 10.1016/j.juro.2011.03.027. [DOI] [PMC free article] [PubMed] [Google Scholar]
- 37.Frokjaer JB, Olesen SS, Gram M, Yavarian Y, Bouwense SA, Wilder-Smith OH, Drewes AM. Altered brain microstructure assessed by diffusion tensor imaging in patients with chronic pancreatitis. Gut. 2011;60(11):1554–1562. doi: 10.1136/gut.2010.236620. [DOI] [PubMed] [Google Scholar]
- 38.Geha PY, Baliki MN, Harden RN, Bauer WR, Parrish TB, Apkarian AV. The brain in chronic CRPS pain: abnormal gray-white matter interactions in emotional and autonomic regions. Neuron. 2008;60(4):570–581. doi: 10.1016/j.neuron.2008.08.022. [DOI] [PMC free article] [PubMed] [Google Scholar]
- 39.Genovese CR, Lazar NA, Nichols T. Thresholding of statistical maps in functional neuroimaging using the false discovery rate. Neuroimage. 2002;15(4):870–878. doi: 10.1006/nimg.2001.1037. [DOI] [PubMed] [Google Scholar]
- 40.Gracely RH, Petzke F, Wolf JM, Clauw DJ. Functional magnetic resonance imaging evidence of augmented pain processing in fibromyalgia. Arthritis Rheum. 2002;46(5):1333–1343. doi: 10.1002/art.10225. [DOI] [PubMed] [Google Scholar]
- 41.Herrero MT, Barcia C, Navarro JM. Functional anatomy of thalamus and basal ganglia. Childs Nerv Syst. 2002;18(8):386–404. doi: 10.1007/s00381-002-0604-1. [DOI] [PubMed] [Google Scholar]
- 42.Jaaskelainen SK, Rinne JO, Forssell H, Tenovuo O, Kaasinen V, Sonninen P, Bergman J. Role of the dopaminergic system in chronic pain -- a fluorodopa-PET study. Pain. 2001;90(3):257–260. doi: 10.1016/S0304-3959(00)00409-7. [DOI] [PubMed] [Google Scholar]
- 43.Jiang Z, Labus JS, Ashe-McNalley C, Kurth F, Ebrat B, Zamanyan A, Shi Y, Genco A, Hobel S, Joshi SH, Schwartz C, Thompson P, Dinov I, Toga AW, Mayer EA. Cortical Thinning in Female Patients With Irritable Bowel Syndrome. Gastroenterology. 2012;142(5 Supplement 1):S-547. [Google Scholar]
- 44.Kennedy PJ, Clarke G, Quigley EM, Groeger JA, Dinan TG, Cryan JF. Gut memories: towards a cognitive neurobiology of irritable bowel syndrome. Neurosci Biobehav Rev. 2012;36(1):310–340. doi: 10.1016/j.neubiorev.2011.07.001. [DOI] [PubMed] [Google Scholar]
- 45.Krauss JK, Pohle T, Weber S, Ozdoba C, Burgunder JM. Bilateral stimulation of globus pallidus internus for treatment of cervical dystonia. Lancet. 1999;354(9181):837–838. doi: 10.1016/S0140-6736(99)80022-1. [DOI] [PubMed] [Google Scholar]
- 46.Kwan CL, Diamant NE, Pope G, Mikula K, Mikulis DJ, Davis KD. Abnormal forebrain activity in functional bowel disorder patients with chronic pain. Neurology. 2005;65(8):1268–1277. doi: 10.1212/01.wnl.0000180971.95473.cc. [DOI] [PubMed] [Google Scholar]
- 47.Lackner JM, Quigley BM, Blanchard EB. Depression and abdominal pain in IBS patients: the mediating role of catastrophizing. Psychosom Med. 2004;66(3):435–441. doi: 10.1097/01.psy.0000126195.82317.46. [DOI] [PubMed] [Google Scholar]
- 48.Mayer EA, Aziz Q, Coen S, Kern M, Labus JS, Lane R, Kuo B, Naliboff B, Tracey I. Brain imaging approaches to the study of functional GI disorders: a Rome working team report. Neurogastroenterol Motil. 2009;21(6):579–596. doi: 10.1111/j.1365-2982.2009.01304.x. [DOI] [PMC free article] [PubMed] [Google Scholar]
- 49.Mayer EA, Bushnell MC. In: Functional Pain Disorders: Time for a Paradigm Shift? Mayer EA, Bushnelleditors MC, editors. |. Book Title|, Vol. Volume|. City|: Publisher|, Year|. p.^pp. Pages|. [Google Scholar]
- 50.Mayer EA, Naliboff BD, Craig AD. Neuroimaging of the brain-gut axis: from basic understanding to treatment of functional GI disorders. Gastroenterology. 2006;131(6):1925–1942. doi: 10.1053/j.gastro.2006.10.026. [DOI] [PubMed] [Google Scholar]
- 51.Mayer EA, Tillisch K. The brain-gut axis in abdominal pain syndromes. Annu Rev Med. 2011;62:381–396. doi: 10.1146/annurev-med-012309-103958. [DOI] [PMC free article] [PubMed] [Google Scholar]
- 52.Moayedi M, Weissman-Fogel I, Crawley AP, Goldberg MB, Freeman BV, Tenenbaum HC, Davis KD. Contribution of chronic pain and neuroticism to abnormal forebrain gray matter in patients with temporomandibular disorder. NeuroImage. 2011;55(1):277–286. doi: 10.1016/j.neuroimage.2010.12.013. [DOI] [PubMed] [Google Scholar]
- 53.Moayedi M, Weissman-Fogel I, Salomons TV, Crawley AP, Goldberg MB, Freeman BV, Tenenbaum HC, Davis KD. White matter brain and trigeminal nerve abnormalities in temporomandibular disorder. Pain. 2012;153(7):1467–1477. doi: 10.1016/j.pain.2012.04.003. [DOI] [PubMed] [Google Scholar]
- 54.Moisset X, Bouhassira D, Denis D, Dominique G, Benoit C, Sabate JM. Anatomical connections between brain areas activated during rectal distension in healthy volunteers: a visceral pain network. Eur J Pain. 2010;14(2):142–148. doi: 10.1016/j.ejpain.2009.04.011. [DOI] [PubMed] [Google Scholar]
- 55.Murphy ML, Frodl T. Meta-analysis of diffusion tensor imaging studies shows altered fractional anisotropy occurring in distinct brain areas in association with depression. Biol Mood Anxiety Disord. 2011;1(1):3. doi: 10.1186/2045-5380-1-3. [DOI] [PMC free article] [PubMed] [Google Scholar]
- 56.Nagy A, Eordegh G, Paroczy Z, Markus Z, Benedek G. Multisensory integration in the basal ganglia. Eur J Neurosci. 2006;24(3):917–924. doi: 10.1111/j.1460-9568.2006.04942.x. [DOI] [PubMed] [Google Scholar]
- 57.Obermann M, Nebel K, Schumann C, Holle D, Gizewski ER, Maschke M, Goadsby PJ, Diener HC, Katsarava Z. Gray matter changes related to chronic posttraumatic headache. Neurology. 2009;73(12):978–983. doi: 10.1212/WNL.0b013e3181b8791a. [DOI] [PubMed] [Google Scholar]
- 58.Phan KL, Orlichenko A, Boyd E, Angstadt M, Coccaro EF, Liberzon I, Arfanakis K. Preliminary evidence of white matter abnormality in the uncinate fasciculus in generalized social anxiety disorder. Biol Psychiatry. 2009;66(7):691–694. doi: 10.1016/j.biopsych.2009.02.028. [DOI] [PMC free article] [PubMed] [Google Scholar]
- 59.Pierpaoli C, Basser PJ. Toward a quantitative assessment of diffusion anisotropy. Magn Reson Med. 1996;36(6):893–906. doi: 10.1002/mrm.1910360612. [DOI] [PubMed] [Google Scholar]
- 60.Rapps N, van Oudenhove L, Enck P, Aziz Q. Brain imaging of visceral functions in healthy volunteers and IBS patients. J Psychosom Res. 2008;64(6):599–604. doi: 10.1016/j.jpsychores.2008.02.018. [DOI] [PubMed] [Google Scholar]
- 61.Sandyk R. The endogenous opioid system in neurological disorders of the basal ganglia. Life Sci. 1985;37(18):1655–1663. doi: 10.1016/0024-3205(85)90292-9. [DOI] [PubMed] [Google Scholar]
- 62.Schwartz ED, Cooper ET, Fan Y, Jawad AF, Chin CL, Nissanov J, Hackney DB. MRI diffusion coefficients in spinal cord correlate with axon morphometry. Neuroreport. 2005;16(1):73–76. doi: 10.1097/00001756-200501190-00017. [DOI] [PubMed] [Google Scholar]
- 63.Seminowicz DA, Labus JS, Bueller JA, Tillisch K, Naliboff BD, Bushnell MC, Mayer EA. Regional gray matter density changes in brains of patients with irritable bowel syndrome. Gastroenterology. 2010;139(1):48–57. e42. doi: 10.1053/j.gastro.2010.03.049. [DOI] [PMC free article] [PubMed] [Google Scholar]
- 64.Seminowicz DA, Wideman TH, Naso L, Hatami-Khoroushahi Z, Fallatah S, Ware MA, Jarzem P, Bushnell MC, Shir Y, Ouellet JA, Stone LS. Effective treatment of chronic low back pain in humans reverses abnormal brain anatomy and function. The Journal of neuroscience : the official journal of the Society for Neuroscience. 2011;31(20):7540–7550. doi: 10.1523/JNEUROSCI.5280-10.2011. [DOI] [PMC free article] [PubMed] [Google Scholar]
- 65.Song GH, Venkatraman V, Ho KY, Chee MW, Yeoh KG, Wilder-Smith CH. Cortical effects of anticipation and endogenous modulation of visceral pain assessed by functional brain MRI in irritable bowel syndrome patients and healthy controls. Pain. 2006;126(1–3):79–90. doi: 10.1016/j.pain.2006.06.017. [DOI] [PubMed] [Google Scholar]
- 66.Starr CJ, Sawaki L, Wittenberg GF, Burdette JH, Oshiro Y, Quevedo AS, McHaffie JG, Coghill RC. The contribution of the putamen to sensory aspects of pain: insights from structural connectivity and brain lesions. Brain. 2011;134(Pt 7):1987–2004. doi: 10.1093/brain/awr117. [DOI] [PMC free article] [PubMed] [Google Scholar]
- 67.Tillisch K, Mayer EA, Labus JS. Quantitative meta-analysis identifies brain regions activated during rectal distension in irritable bowel syndrome. Gastroenterology. 2011;140(1):91–100. doi: 10.1053/j.gastro.2010.07.053. [DOI] [PMC free article] [PubMed] [Google Scholar]
- 68.Tillisch K, Mayer EA, Labus JS, Stains J, Chang L, Naliboff BD. Sex specific alterations in autonomic function among patients with irritable bowel syndrome. Gut. 2005;54(10):1396–1401. doi: 10.1136/gut.2004.058685. [DOI] [PMC free article] [PubMed] [Google Scholar]
- 69.Yuan YZ, Tao RJ, Xu B, Sun J, Chen KM, Miao F, Zhang ZW, Xu JY. Functional brain imaging in irritable bowel syndrome with rectal balloon-distention by using fMRI. World J Gastroenterol. 2003;9(6):1356–1360. doi: 10.3748/wjg.v9.i6.1356. [DOI] [PMC free article] [PubMed] [Google Scholar]