Abstract
The stochastic accumulation framework provides a mechanistic, quantitative account of perceptual decision-making and how task performance changes with experimental manipulations. Importantly, it provides an elegant account of the speed–accuracy trade-off (SAT), which has long been the litmus test for decision models, and also mimics the activity of single neurons in several key respects. Recently, we developed a paradigm whereby macaque monkeys trade speed for accuracy on cue during visual search task. Single-unit activity in frontal eye field (FEF) was not homomorphic with the architecture of models, demonstrating that stochastic accumulators are an incomplete description of neural activity under SAT. This paper summarizes and extends this work, further demonstrating that the SAT leads to extensive, widespread changes in brain activity never before predicted. We will begin by reviewing our recently published work that establishes how spiking activity in FEF accomplishes SAT. Next, we provide two important extensions of this work. First, we report a new chronometric analysis suggesting that increases in perceptual gain with speed stress are evident in FEF synaptic input, implicating afferent sensory-processing sources. Second, we report a new analysis demonstrating selective influence of SAT on frequency coupling between FEF neurons and local field potentials. None of these observations correspond to the mechanics of current accumulator models.
Keywords: speed–accuracy trade-off, perceptual decision-making, visual attention, visual search, computational models, frontal eye field
1. The stochastic accumulator framework
The act of choice is a commitment to one course of action instead of other potential actions. A decision process whereby available evidence for the alternatives is weighed guides the most effective choices. Decades of research—using behavioural analysis and computational modelling of manual or saccadic choice reaction times and accuracy rates—has led to the broad consensus that the decision process can be understood as a stochastic accumulation of evidence [1–4]. Sensory evidence sampled from the environment for each alternative is accumulated, and a choice is enacted when the first accumulation process reaches some criterion. Although there are several variants on this framework, all have several aspects in common: a baseline or starting level of each accumulator, which can be affected by biases or expectations, an accumulation rate determined by the strength or reliability of the evidence provided in the perceptual input and a threshold level of accumulation mapped to a particular response [5] (figure 1).
Figure 1.
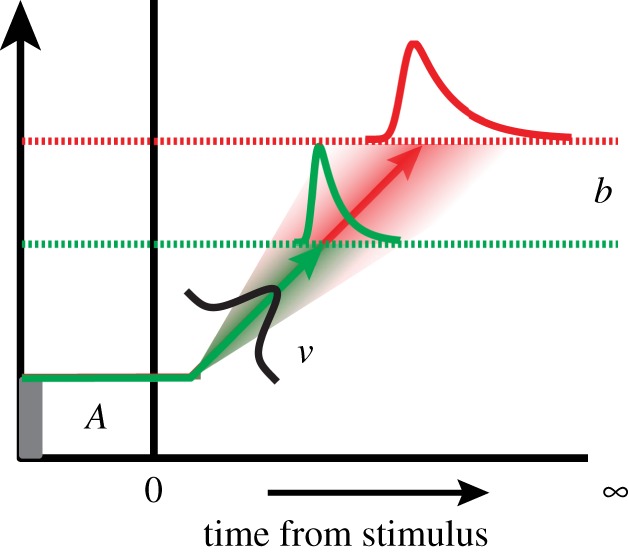
Basic model framework. Accumulators begin each trial with some pre-set level of activity, A. Following stimulus onset, accumulators begin to rise towards a threshold level of activity that acts as a decision trigger, b. When the threshold is lowered, responses are generally faster, but more prone to error. When raised, responses tend to be slower, but have the benefit of more samples of information. The rate at which information accumulates depends on the quality of the sensory evidence; when stimuli are identical, this drift rate, v should be constant on average, though intra- and inter-trial variability are allowed in several model variations. Here and throughout this work, green traces correspond to a speed stress (fast) condition, and red traces correspond to an accuracy stress (accurate) condition.
With just a few parameters, stochastic accumulator models account for a large proportion of behavioural variability—predicting the shapes of reaction time distributions and error rates, while simultaneously explaining how those distributions and error rates change as a function of various experimental manipulations. Of particular importance is the speed–accuracy trade-off (SAT) [6], a universal and pervasive phenomenon that must be accommodated by any tenable decision model. According to stochastic accumulator models, SAT is achieved through a modification of the accumulation threshold: when set lower, response time (RT) is shortened due to the smaller excursion accumulators must traverse to terminate the decision process. However, this also reduces the amount of noise that can be averaged out of the accumulation process, thereby also increasing the error rate. The reverse holds true for observers placed under accuracy stress. One should appreciate that the model does not simply predict the difference in mean RT and error rate between speed and accuracy conditions, however. The elegance of the model is borne out in the fact that the shapes of participants' RT distributions change in specific ways, and stochastic accumulator models predict these shapes precisely [1,2,5,7–15]. Given the success of the framework, it is natural to investigate how the brain accomplishes these perceptual decisions. Will the form of neural processes parallel the form of the accumulators? Here, we review our recent work in non-human primates, suggesting that neural activity differs substantially in several ways from the architecture of current accumulator models. Next, we present several novel analyses that further substantiate our conclusion that psychological accumulator models do not capture the diverse reality of neural activity during decision formation. These include chronometric analyses of single units, local field potentials (LFPs) and electroencephalogram (EEG), as well as the results of a time-frequency, spike-field coherence (SFC) analysis.
2. Brain regions and cell classes
The relationship between stochastic accumulation and neural activity is most well characterized in the macaque oculomotor system using tasks that require monkeys to make saccadic eye movements to indicate choice [16–20] (but see [21,22]). According to the framework, saccades occur once accumulated sensory evidence reaches a decision threshold. In a sense, the decision process can be likened to a transformation of sensory information into motor execution. It should thus not be surprising that the brain regions critical for saccadic decisions are also those identified with sensorimotor integration, including the frontal eye field (FEF), superior colliculus (SC) and lateral intraparietal area (LIP). These structures are composed of many functionally distinct cell classes [23–25]. The heterogeneity of neural activity during decision-making tasks has been highlighted in many recent studies [23,26–29]. Here, we will focus on two. Pre-saccadic movement neurons exhibit weak or no response to visual stimulation, but increase their firing rate in the period prior to a saccade (figure 2a). In comparison, visual neurons exhibit a vigorous burst of activity following the presentation of a stimulus falling within its receptive field (RF), but have no pre-saccadic modulation. As illustrated in figure 2b, visual neurons exhibit an initially non-selective visual response that evolves to discriminate target items (solid lines) from distractor items (dashed lines) presented in their RF.
Figure 2.
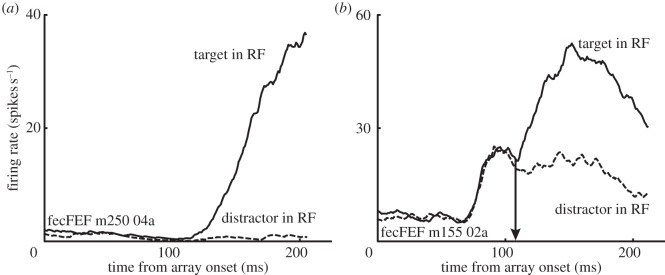
(a) Representative FEF movement neuron. The cell demonstrates no visual response, and remains at baseline for eye movements directed away from the RF. In comparison, neural activity gradually increases before eye movements into the RF. (b) Representative FEF visual neuron. The cell is initially non-selective, but evolves to discriminate target from distractor stimuli. The time at which the neuron statistically discriminates target from distractor items placed in its RF (the target selection time) is marked by an arrow (see text).
Pre-saccadic movement neurons demonstrate several properties that suggest they embody the stochastic accumulation process. First, models predict that the accumulation rate should be proportional to the strength of sensory evidence. For instance, manipulations that alter the visibility of a critical stimulus should be best accounted for by a model allowing the rate parameter to vary across conditions. This has been validated in quantitative fits to human behaviour: manipulations that affect the strength or quality of perceptual information are best captured by models that allow accumulation rate to vary between conditions [10,30,31]. Similarly, the rate at which pre-saccadic neural activity in FEF [17,18,29,32], LIP [16,33,34] and SC [19,35] builds up prior to saccade varies monotonically with the strength of sensory evidence. Second, accumulator models suggest that all else being equal, variability in RT is due to the amount of time required for accumulation to reach a fixed threshold. In other words, accumulator models can capture wide variability in RT without the need for a variable threshold. This remains true even when conditions differ in difficulty, such as with a visual search1 set size manipulation [36,37]. This, too, is borne out in the pre-saccadic activity of movement neurons: for several types of tasks, the level of neural activity at decision is invariant over RT quantiles and task manipulations [16–19], particularly when monkeys cannot predict the nature of the upcoming trial. A small number of studies have shown changing neural threshold when task conditions are presented in blocks or cued trial-to-trial [38,39]. While less specific than single-unit neurophysiology, it is noteworthy that the covariation between model parameter and neural activity has been verified on the larger scale of brain networks in humans, using functional brain imaging [40–45], magnetoencephalography [46] and EEG [47,48] (for a review, see Bogacz et al. [4]).
Still more evidence is gleaned from countermanding tasks that require subjects to occasionally cancel a prepared saccade. Movement neurons in both SC and FEF are observed to initially increase but then decline in activity following a stop or change signal [27,49,50]. Crucially, whether or not monkeys can cancel a saccade depends on whether or not a threshold discharge rate was reached [51,52] (for a review, see [53,54]).
The identification of movement neurons with stochastic accumulators also follows from anatomical considerations. Because stochastic accumulators trigger overt choice at the moment the accumulation reaches threshold, so too must accumulator neurons trigger movement at some physiological threshold. Movement neurons are well suited for this, having direct projections to brainstem nuclei responsible for initiating eye movements [55–59].
In comparison, when tested under conditions of visual search, visually responsive neurons in FEF, SC and LIP represent the salience of stimuli presented in their RF through a modulation of firing rate [60–67] (but see [68,69], cf. [70]). Here, salience refers to both the physical conspicuousness of an item, such as luminance, contrast or status as a feature singleton (bottom-up salience), as well as its behavioural relevance determined by the requirements of the task (top-down salience). The union of top-down and bottom-up influences provides a viable mechanism for segregation of the visual field—a process that is a central role in several behavioural models of visual search [71–74]. The evolution of the salience map can be quantified by comparing neural activity on trials when a target fell in the RF versus trials in which a distractor appeared in the RF. The time at which neural activity statistically discriminates target from non-target stimuli (the target selection time, TST) as well as the magnitude of discrimination has behavioural consequences. For instance, slower (faster) RTs are associated with a later (earlier) differentiation of target and non-target stimuli [75]. Increasing the number of competitor stimuli both delays and reduces the difference between target and non-target stimuli [76,77], and errors tend to result when the salience map favours distractor over target stimuli [78,79]. Thus, the salience map represented by visual neurons may be the perceptual evidence that is input to stochastic accumulators leading to guided action.
3. Gated accumulator model
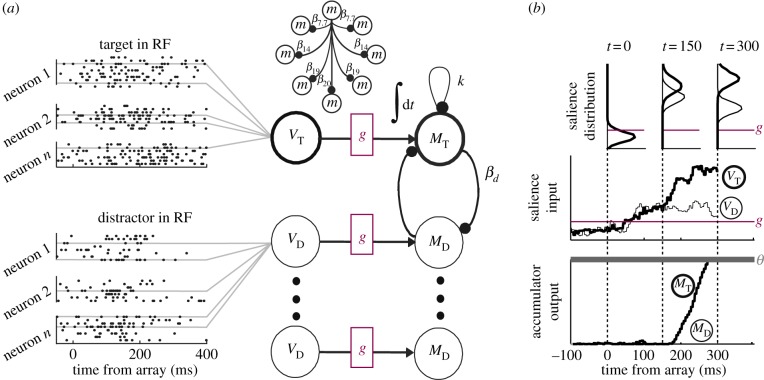
The above suggests a straightforward model to explain visual search: visual neurons represent the salience evidence that is accumulated by movement neurons, and saccadic decisions occur when movement neuron activity reaches a fixed threshold. To test this, we used a neurally constrained modelling approach [37]. The model, depicted in figure 3, takes as input spike trains recorded from FEF visual neurons2 and produces as output predicted behaviour (RT and accuracy rate) as well as several key properties of FEF movement neurons. Specifically, the time-course of accumulation suggested by the best-fitting model closely matched the dynamics of real neural activity exhibited by FEF movement cells. The success of this model (and a subsequent extension [80]), constrained by neural data, indicates that the general framework is viable. To summarize, data stemming from computational modelling, behavioural experiments and single-unit electrophysiology consistently agree that stochastic accumulator models are more than a convenient approximation, but are realized in the neural mechanisms responsible for perceptual decision-making.
Figure 3.
Gated stochastic accumulator model. (a) Neural activity recorded from FEF visual neurons provided salience input. VT, activity when a target fell in the neuron's RF, VD, activity when distractors fell in the RF. Salience input was gated, g such that stochastic accumulation could not begin until a critical level of input was achieved. Once reached, movement units corresponding to choices into (MT) or away from (MD) the RF began accumulating evidence. Movement accumulators were subject to leakage, k and lateral inhibition, β. (b) A decision was committed once accumulation reached a fixed threshold, θ. The model not only accounts for overt behaviour but also accounts for the form of FEF movement neuron activity.
4. Speed–accuracy trade-off with non-human primates
One gap in the above is that changes in SAT have never been observed in non-human species. As a consequence, the linchpin observation of decreasing threshold with increasing speed stress has not been validated in single-unit responses. The identification of FEF movement neurons with stochastic accumulators leads to an exceptionally clear prediction: the threshold neural activity—the spiking output in the moments prior to saccade—should vary with SAT condition, such that neural threshold is highest under accuracy stress and lowest under speed stress, consistent with the consensus derived from behavioural and modelling studies described above. To test this hypothesis directly, we trained monkeys to alter SAT settings on cue [81] and recorded single neuron activity from movement and visual neurons in FEF.
Monkeys performed visual search for a target item presented among seven distractor items (figure 4a). SAT conditions (fast, neutral3 and accurate) were presented in short blocks of 10–20 trials each, cued only by the colour of the fixation point. The speed condition placed more emphasis on fast responding than correct responding through several reward and punishment (timeout) contingencies. Monkeys earned juice reward for responding correctly, but only if their RT met a response deadline predetermined through pilot testing (see [81]). If monkeys met the response deadline, but chose incorrectly, they were not rewarded but were also not penalized. Responses of any type that did not meet the deadline were followed by a long 4 s timeout. The converse was true for the accuracy condition: monkeys were rewarded for slow, correct responses, but were given timeout if their response was incorrect. We also included a neutral condition that had no response deadline. The use of response deadlines to control RT is highly effective and follows a long tradition in human SAT research [6,82]. We observed that this paradigm was equally effective in monkeys, who produced a classic SAT, characterized by decreasing RT and increasing error rate with speed emphasis (figure 4b). Just as importantly, monkeys adapted their behaviour instantaneously upon presentation of a new SAT cue, demonstrating a voluntary and flexible change of state.
Figure 4.
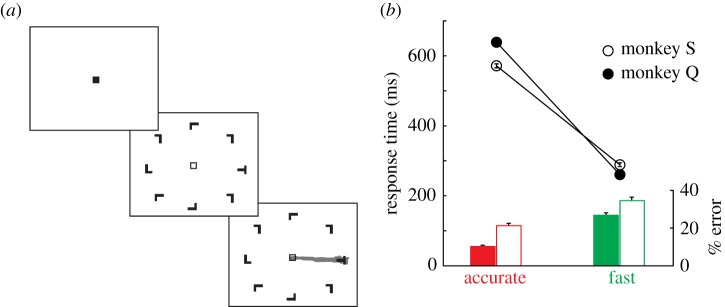
Visual search task with SAT manipulation. (a) Monkeys maintained gaze on a fixation point for 750–3000 ms to begin each trial. The colour of the fixation point (green or red) was consistently mapped for each monkey to either the fast or accurate conditions (here, green always corresponds to the fast condition). Then, an iso-eccentric array of T and L shapes appeared, one of which was defined as a target for that session; non-target distractors were drawn randomly from a non-target set. To earn liquid reward, monkeys made a single saccade to the target item and maintained gaze for 750 ms. Rewards and timeouts following errors differed between SAT conditions (see Heitz & Schall [81]). (b) Each of two monkeys produced a classic SAT, producing faster and more error prone responses in the fast condition than in the accurate condition.
The critical neural data were unambiguous: SAT-related changes in neural activity were not homomorphic with accumulator model architecture. Quite to the contrary, threshold neural activity varied with speed stress (figure 5a), but in the direction opposite to predictions (higher threshold for speed stress than accuracy stress). At the same time, threshold remained invariant with RT within conditions, suggesting that threshold variability was yoked not to RT per se, but to a cognitive state elicited by SAT cues. Moreover, SAT instructions affected not just one aspect (threshold) of neural activity, but also perceptual processes as well, as evidenced by changes in visually responsive neurons (figure 5b). Specifically, speed stress led to increases in baseline neural activity, the magnitude of visual responses to otherwise identical stimuli, and also the time required for visual neurons to select target from distractor items placed in its RF.
Figure 5.
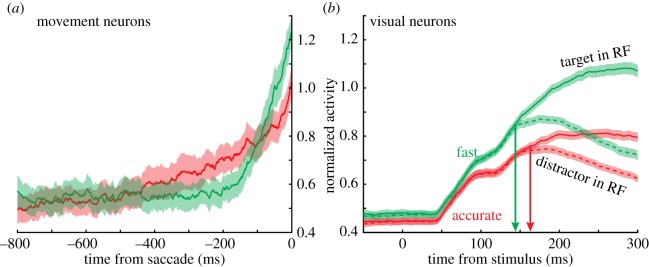
(a) Pre-saccadic movement activity varied as a function of SAT, but in a direction opposite to the form of accumulator models. Specifically, neural activity at saccade onset was higher, not lower, in the fast condition than in the accurate condition. (b) FEF visual neuron signalling also varied with SAT. The fast condition was associated with (i) greater baseline firing rate, (ii) amplified visual response to otherwise identical stimuli and (iii) delayed target selection time (arrows) in the accurate when compared with the fast condition. Shaded regions represent ± 1 s.e.m.
5. The integrated accumulator model
We found that SAT is accomplished through a multitude of adjustments in multiple processing stages. Despite these findings showing that conventional accumulator models do not map gracefully onto neural mechanisms, we thought it hasty to dismiss the stochastic accumulator framework altogether. Thus, we sought to reconcile these neural findings with the accumulator model framework based on one constraint of a performance parameter that did not vary with SAT in our task—the velocity and amplitude of the saccades produced under different speed–accuracy instructions were invariant (figure 6).
Figure 6.
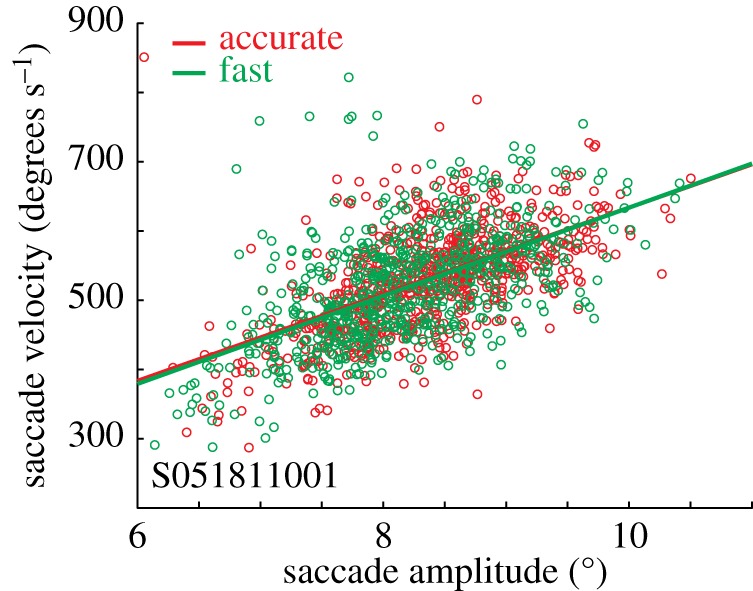
Eye movement metrics and dynamics from a representative session. The well-characterized relationship between saccade amplitude and saccade velocity (the ‘main sequence’) did not vary by SAT condition, despite remarkable variation in RT.
Saccade brainstem physiology operates like a trigger: the eyes move precisely when omnipause neurons receive threshold inhibition [83] from afferents originating in FEF, SC and elsewhere4 [55–58]. The metrics of the resulting saccade—its velocity and amplitude—are a precise function of the level of omnipause hyperpolarization received [84]. The fact that saccade velocity did not vary with SAT instruction requires that brainstem recipients of FEF output must reach an invariant state at saccade onset. Saccades are ballistic movements, such as the flight of an arrow. Equivalent distance and velocity of an arrow requires equivalent final tension in the bow at release. However, the bow can be drawn quickly or slowly. Therefore, we reasoned that the threshold neural activity observed in FEF (and we conjecture throughout the pre-saccadic circuit including the SC) must be constrained by the brainstem nuclei that directly receive the accumulating premotor signal.
We believe this appreciation of the final motor circuitry provides an important insight into why the FEF movement neuron activity varies as it does under SAT. The variation in movement neuron threshold with SAT is translated to a fixed threshold in the brainstem. This insight provided the foundation for a reconciliation of our findings with the stochastic accumulator framework by assuming that: (i) FEF movement neuron output is itself integrated in the brainstem (we conjecture that this integration is implicit on the membranes of omnipause neurons); (ii) saccades are produced when this integrated activity reaches a fixed threshold (otherwise saccade velocity and amplitude could not be equivalent); and (iii) the input varies as a function of SAT (the bow string can be drawn slowly or quickly to the desired amount of tension). Our model, known as the integrated accumulator provided fits to behaviour that were comparable with the standard accumulator models and it also replicated key features of the neurophysiology [81]. Validation of this model will require recordings from the brainstem during SAT; this is the focus of ongoing work.
6. Speed–accuracy trade-off leads to system-wide modulations
A strength of the integrated accumulator model is the appeal to a multi-stage accumulation process. The standard stochastic accumulator model considers only the deliberative stage of decision, making few assumptions about the nature and representation of the perceptual input, and no provision for any changes in the mechanisms following decision threshold crossing that are required to engage eye movements (or any other body movement). It is equally unclear exactly where stochastic accumulation occurs, and at what level the threshold is implemented (is each neuron an equally weighted accumulator, or is there a consensus within a given area?) [85]. In what follows, we highlight the argument for a multi-stage accumulation process. Specifically, we will show that that SAT affects the processing of visual stimuli and that this modulation is influenced by sources outside of FEF. This is problematic for any model that localizes stochastic accumulation to a single stage or brain area.
We conducted a chronometric analysis of FEF spikes and LFP5, and also the non-human primate N2pc [79,87,88], an attention-sensitive, target-selective EEG component [89–92] widely considered to reflect activity in extrastriate visual cortex such as V4 [93,94]. We confirmed previous work in showing that: (i) the initial visual response occurs earlier in FEF LFP than in single-unit responses, owing to its reflection of dendritic activity and hence input to an area [95,96]; but (ii) FEF single neurons become selective for context-specific stimuli (the TST) earlier than LFP [87,88,95], suggesting that FEF computes selective responses from initially unselective input; and (iii) target selectivity emerges earliest in single units and latest in N2pc, with LFP becoming selective at intermediate times. This is consistent with other work suggesting that target selectivity computed by FEF neurons, from initially unselective inputs, is later transmitted to extrastriate cortex [97]. Finally, we confirmed that, at least for FEF single neurons, (iv) TSTs for otherwise identical stimuli are earlier under speed stress than under accuracy stress.
We were specifically interested in the moment in time when neural activity significantly increased from baseline (onset time)6, the moment in time when neural activity discriminated the fast and accurate conditions (SAT discrimination time), and the moment in time when neural activity discriminated target from distractor items placed in its RF (TST).
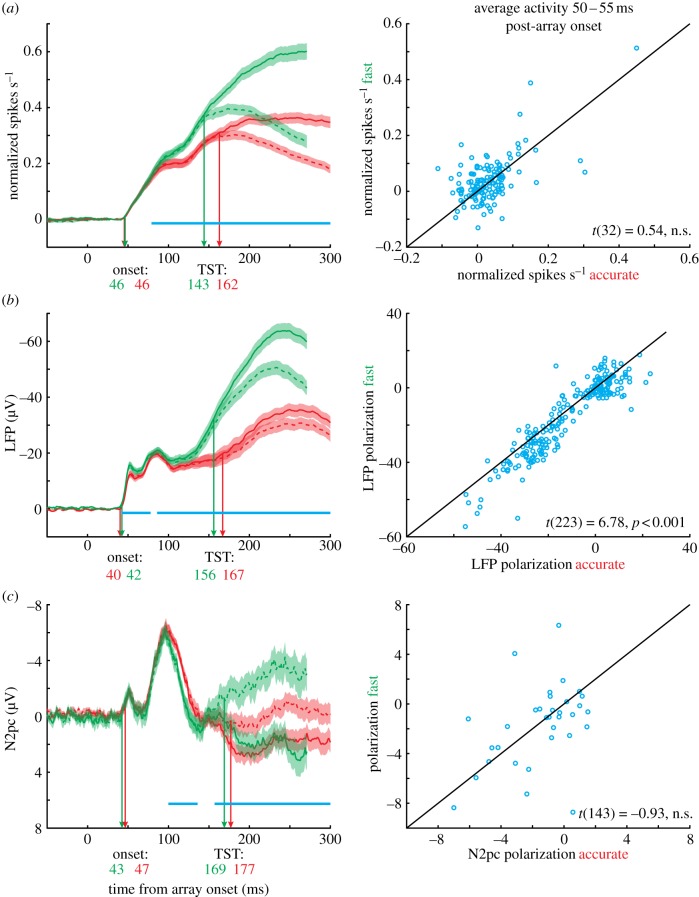
In a new analysis, we computed these metrics in 144 neurons, 224 LFP recordings, and 33 N2pc recordings7 from two monkeys performing the SAT visual search task, all recorded simultaneously. Onset times were computed using ms-by-ms non-parametric t-tests, testing against 0 after baseline correction −100 to 0 ms prior to target onset. The same procedure was followed for the SAT discrimination time, testing the fast condition against the accurate condition. Similarly, we compared trials when target items appeared in the RF versus when distractor items fell there to compute the TST [88]. Values were computed and tested statistically using a jack-knife bootstrapping procedure [99]. All statistical comparisons were computed at the population level.
The results were largely consistent with previous work (figure 7). Onset times were slightly but consistently earlier for LFPs (41 ms) than for single neurons (46 ms). The onset time for N2pc was more variable, but similar on average to single neurons (45 ms). The visual onset time did not differ significantly between SAT conditions, for any signal.
Figure 7.
(a) Chronometric analysis of single-units, (b) LFP and (c) N2pc. Note that single-unit activity has been baseline corrected so that visual responses of all three signals can be meaningfully compared. For each signal, we computed several metrics. The onset time was computed as the moment when neural signals differed significantly from baseline (average −100 to 0 ms prior to array appearance). Onset times were slightly earlier for LFP than for single units or N2pc (earliest arrows). The target selection time (TST) was the moment when neural activity discriminated target items (solid lines) from distractor items (dashed lines) in the RF. For the LFP and N2pc, the RF was defined as the contralateral hemifield. Note that LFPs typically express selection through an increased negativity, whereas N2pc tends to become more positive for target items. The TSTs were earliest for single units, followed by LFP, followed by N2pc. Moreover, selection times were later in the accurate than fast condition for each signal type. The SAT discrimination time was computed as the moment at which neural activity was significantly different for the fast and accurate conditions (blue lines indicate significant differences). This time was earliest for LFP, followed by single units, followed by N2pc. This pattern was evident across the population: scatter plots on the right compare average neural activity in the fast and accurate conditions from 50 to 55 ms post-array onset. The differences are significant only for the LFP.
Next, we computed the single unit, LFP and N2pc TSTs. For each signal, TSTs were significantly earlier for the fast when compared with accurate condition (single neurons: 143 versus 162 ms; LFP: 156 versus 167 ms, N2pc: 169 versus 177 ms). It is also clear that for each condition, the linear ordering was such that single units selected earliest, and N2pc selected latest [88].
Finally, and most importantly, we calculated the SAT encoding time: the moment at which the magnitude of neural activity discriminated the fast from accurate conditions. We observed that the visual response was magnified for the fast when compared with accurate condition earliest in the LFP (45 ms), followed by single neurons (79 ms) and N2pc (110 ms; blue lines). To emphasize this point, we plotted mean activity in the window 50–55 ms post-array onset for each signal type; this was only significant for LFP voltage (expressed as a larger negativity in the fast condition; figure 7, right-hand panels). These results suggest when monkeys were faced with speed stress, the system was pre-configured to amplify incoming visual signals. Thus, the amplification of perceptual gain is not local to FEF as it is evident in FEF input before spiking output. It is not puzzling that the fast and accurate conditions can be discriminated very early; monkeys were aware of which condition was to be presented by the colour of a fixation point presented 750–3000 ms prior to the critical stimulus. It is puzzling, though, that SAT condition affected the visual response so much earlier in the LFP when compared with spikes and the N2pc. This result demonstrates that SAT is accomplished by adaptations occurring in multiple brain regions for both visual processing and saccade planning. An important lesson to be learned from this is that if stochastic accumulator models are to be mapped onto brain processes, they should not be identified with one stage, one brain region, or one cell class.
7. Spike-field coherence correlates of speed–accuracy trade-off
Interest has increased in the role of SFC in mediating perceptual, cognitive and motor processes. Briefly, SFC emerges when neurons become entrained with the surrounding network in particular frequency bands over time. A body of evidence suggests that disparate brain regions may communicate not through spike counts per se, but rather through the timing of individual spikes and how those spikes are coupled to the greater surrounding network(s), also oscillating at a particular frequency [100,101]. Particularly important is that of oscillations in the gamma-range, approximately 30–50 Hz, or even higher. Several studies have demonstrated that gamma-band coherence is selectively enhanced when attention is directed into a shared RF [97,102–104]. The SFC for two signals is computed using a variety of methods, most of which involve two steps: transforming each continuous signal into the frequency domain while retaining temporal information using windowed Fourier transform8, and second, computing a normalized correlation between these power spectra over time [105]. Coherence magnitude ranges from 0 to 1 and increases to the extent that signals demonstrate phase and amplitude locking over trials.
Given the strong evidence for increases in gamma-band coherence with attention, we wondered how SFC varied with SAT instruction given the dramatic behavioural and neural changes between conditions. We hypothesized that gamma-band coherence would be increased in the accurate condition relative to the fast condition, because the former required more deliberate responses, whereas the latter simply stressed speed. To examine this, we computed the SFC9 between 353 simultaneously recorded FEF single units and LFPs.
The evidence was consistent with the hypothesis. Figure 8 quantifies the relationship for an exemplar session by subtracting coherence magnitude in the accurate condition from the fast condition. As is evident, coherence in the accuracy condition is significantly increased in the gamma band, centred at about 40 Hz (areas enclosed in white are significant at the p < 0.05 level). This elevated SFC was evident across the population of 353 neuron–LFP pairs (figure 9). This is particularly interesting, given that by most metrics, the fast condition elicited more spiking events and greater LFP amplitude. Still, on this finer scale, we observe that when monkeys were instructed to make very accurate decisions, there was an increase in gamma-band coherence between approximately 30 and 40 Hz.
Figure 8.
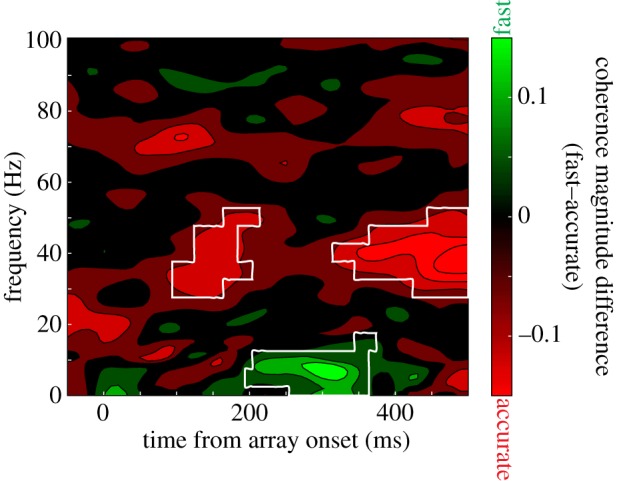
Spike-field coherence for a representative neuron and LFP simultaneously recorded from different electrodes. Positive, green values correspond to greater coherence in the fast condition, whereas negative, red values indicate greater coherence in the accurate condition. Areas of statistical significance (at the p < 0.05 level) are enclosed in white. Gamma-range coherence (30–40 Hz) is significantly greater in the accurate condition, whereas low-frequency coherence (less than or equal to approx. 10 Hz) is greater for the fast condition.
Figure 9.
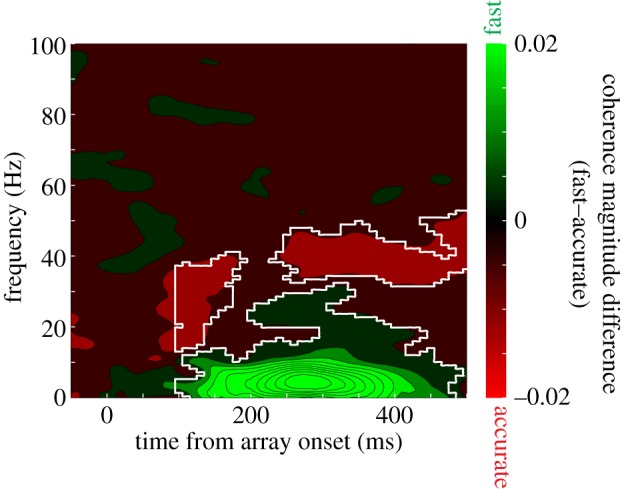
Spike-field coherence across 353 neuron–LFP pairs. Conventions as in figure 8.
Evident also in figures 8 and 9 is a marked increase in low-frequency coherence for the fast condition over the accurate condition. At first blush, this seems to be an uninteresting reflection of the overall greater magnitude of responses discussed earlier. However, this is not the case, as coherence requires trial-by-trial, moment-by-moment phase and amplitude locking. At least in early visual cortex, increases in low-frequency power have been associated with increased response gain for relevant stimuli and speeded reaction times, just as witnessed here [107,108].
8. Conclusions
The stochastic accumulator framework continues to inspire and constrain theoretical and empirical work on perceptual decision-making. We have summarized evidence showing that while stochastic accumulator models provide efficient quantitative explanations of overt behaviour, the mapping between model parameters and neural processes is much less clear than others and we had originally imagined. The various analyses reported here highlight the fact that the SAT is a multifaceted phenomenon, accomplished by multiple, distinct modulations of neurons instantiating different stages of processing. Thus, the formal model explanation of SAT by a single parameter cannot be mapped meaningfully onto brain processes. For that matter, no psychological accumulator model includes the variety of effects we report here involving discharge rates, field potentials and coherence. That said, we wish to stress that our objective is not to invalidate the conventional accumulator model. To the contrary, the stochastic accumulator framework continues to provide a sophisticated, formal account of behaviour in many tasks. Furthermore, we have demonstrated that an extension of the framework that incorporates multiple stages of accumulation can reconcile model and neural processes. However, the data used to formulate and constrain the integrated accumulator model were obtained from just one node in a complex network. FEF, while a critical node in the saccade decision circuit, is extensively interconnected with multiple afferent and efferent cortical and subcortical structures. A more complete understanding of SAT, and how the brain accomplishes perceptual decisions generally, awaits further data.
Funding statement
This work was supported by F32-EY019851 to R.P.H., and by R01-EY08890, P30-EY08126, P30-HD015052, and the E. Bronson Ingram Chair in Neuroscience.
Endnotes
A visual search task requires observers to locate some target item presented among non-target distractor items. The stimuli commonly consist of simple or complex shapes or colours, and trials can vary in the number of and characteristics of distractors present. Observers respond in a variety of ways, commonly by button press (item is present or not present) or by eye movement (look at and maintain fixation on the one target item).
The activity of visual-movement neurons was also sufficient for the model.
Here, we will present only the fast and accurate conditions. For details on the neutral condition, see Heitz & Schall [81].
It is known that the influence of movement neurons on omnipause neurons is ultimately inhibitory, though the details of this microcircuit are not understood [83].
The local field potential (LFP) reflects the synchronous activity of neurons approximately 100–250 µm near the recording electrode [86].
The reader should note that for many neurons, baseline firing rate was significantly greater in the fast condition than in the accurate condition, as detailed in Heitz & Schall [81]. This effect persisted across blocks of trials and itself indicates a persistent cognitive state change. Here, we were interested in effects apart from the baseline shift; therefore, although it is not standard practice, we baseline-corrected spike density functions in the same manner as the LFP and EEG.
During each experimental session, eight independent electrodes were lowered into FEF; each electrode provided one LFP and some number of single units, typically 1–2 (and occasionally 0). Meanwhile, monkeys were outfitted with several EEG electrodes. Electrodes T5 and T6 in the 10–20 system [98] were used to compute the N2pc and averaged). Unfortunately, electrode T5 was unusable for one monkey and was not included (for details, see Heitz et al. [79]).
We used a 200 ms Hanning window.
We included only LFPs and single units if they were recorded on separate electrodes to ensure that LFPs were not contaminated by spectral leakage. Statistical significance between the fast and accurate conditions was evaluated using a jack-knife bootstrapping technique [106].
References
- 1.Ratcliff R, Rouder J. 1998. Modeling response times for two-choice decisions. Psychol. Sci. 9, 347–356 (doi:10.1111/1467-9280.00067) [Google Scholar]
- 2.Ratcliff R, Smith PL. 2004. A comparison of sequential sampling models for two-choice reaction time. Psychol. Rev. 111, 333–367 (doi:10.1037/0033-295X.111.2.333) [DOI] [PMC free article] [PubMed] [Google Scholar]
- 3.Bogacz R. 2007. Optimal decision-making theories: linking neurobiology with behaviour. Trends Cogn. Sci. 11, 118–125 (doi:10.1016/j.tics.2006.12.006) [DOI] [PubMed] [Google Scholar]
- 4.Bogacz R, Wagenmakers E-J, Forstmann BU, Nieuwenhuis S. 2010. The neural basis of the speed–accuracy tradeoff. Trends Neurosci. 33, 10–16 (doi:10.1016/j.tins.2009.09.002) [DOI] [PubMed] [Google Scholar]
- 5.Bogacz R, Brown E, Moehlis J, Holmes P, Cohen JD. 2006. The physics of optimal decision making: a formal analysis of models of performance in two-alternative forced-choice tasks. Psychol. Rev. 113, 700–765 (doi:10.1037/0033-295X.113.4.700) [DOI] [PubMed] [Google Scholar]
- 6.Wickelgren WA. 1977. Speed–accuracy tradeoff and information processing dynamics. Acta Psychol. 41, 67–85 (doi:10.1016/0001-6918(77)90012-9) [Google Scholar]
- 7.Luce D. 1986. Response times: their role in inferring elementary mental organization. Oxford, UK: Oxford University Press [Google Scholar]
- 8.Nosofsky RM, Palmeri TJ. 1997. An exemplar-based random walk model of speeded classification. Psychol. Rev. 104, 266–300 (doi:10.1037/0033-295X.104.2.266) [DOI] [PubMed] [Google Scholar]
- 9.Reddi BA, Carpenter RH. 2000. The influence of urgency on decision time. Nat. Neurosci. 3, 827–830 (doi:10.1038/77739) [DOI] [PubMed] [Google Scholar]
- 10.Reddi BAJ, Asrress KN, Carpenter RHS. 2003. Accuracy, information, and response time in a saccadic decision task. J. Neurophysiol. 90, 3538–3546 (doi:10.1152/jn.00689.2002) [DOI] [PubMed] [Google Scholar]
- 11.Usher M, McClelland JL. 2001. The time course of perceptual choice: the leaky, competing accumulator model. Psychol. Rev. 108, 550–592 (doi:10.1037/0033-295X.108.3.550) [DOI] [PubMed] [Google Scholar]
- 12.Simen P, Cohen JD, Holmes P. 2006. Rapid decision threshold modulation by reward rate in a neural network. Neural Netw. 19, 1013–1026 (doi:10.1016/j.neunet.2006.05.038) [DOI] [PMC free article] [PubMed] [Google Scholar]
- 13.Brown SD, Heathcote A. 2008. The simplest complete model of choice response time: linear ballistic accumulation. Cogn. Psychol. 57, 153–178 (doi:10.1016/j.cogpsych.2007.12.002) [DOI] [PubMed] [Google Scholar]
- 14.Standage D, You H, Wang D-H, Dorris MC. 2011. Gain modulation by an urgency signal controls the speed–accuracy trade-off in a network model of a cortical decision circuit. Front. Comput. Neurosci. 5, 1–14 (doi:10.3389/fncom.2011.00007) [DOI] [PMC free article] [PubMed] [Google Scholar]
- 15.Logan GD. 1992. Shapes of reaction-time distributions and shapes of learning curves: a test of the instance theory of automaticity. J. Exp. Psychol. 18, 883–914 (doi:10.1037/0278-7393.18.5.883) [DOI] [PubMed] [Google Scholar]
- 16.Roitman JD, Shadlen MN. 2002. Response of neurons in the lateral intraparietal area during a combined visual discrimination reaction time task. J. Neurosci. 22, 9475–9489 [DOI] [PMC free article] [PubMed] [Google Scholar]
- 17.Hanes DP, Schall JD. 1996. Neural control of voluntary movement initiation. Science 274, 427–430 (doi:10.1126/science.274.5286.427) [DOI] [PubMed] [Google Scholar]
- 18.Woodman GF, Kang M-S, Thompson K, Schall JD. 2008. The effect of visual search efficiency on response preparation: neurophysiological evidence for discrete flow. Psychol. Sci. 19, 128–136 (doi:10.1111/j.1467-9280.2008.02058.x) [DOI] [PMC free article] [PubMed] [Google Scholar]
- 19.Ratcliff R, Hasegawa YT, Hasegawa RP, Smith PL, Segraves MA. 2007. Dual diffusion model for single-cell recording data from the superior colliculus in a brightness-discrimination task. J. Neurophysiol. 97, 1756–1774 (doi:10.1152/jn.00393.2006) [DOI] [PMC free article] [PubMed] [Google Scholar]
- 20.Mazurek ME, Roitman JD, Ditterich J, Shadlen MN. 2003. A role for neural integrators in perceptual decision making. Cereb. Cortex 13, 1257–1269 (doi:10.1093/cercor/bhg097) [DOI] [PubMed] [Google Scholar]
- 21.Maimon G, Assad JA. 2006. Parietal area 5 and the initiation of self-timed movements versus simple reactions. J. Neurosci. 26, 2487–2498 (doi:10.1523/JNEUROSCI.3590-05.2006) [DOI] [PMC free article] [PubMed] [Google Scholar]
- 22.Cisek P, Kalaska JF. 2005. Neural correlates of reaching decisions in dorsal premotor cortex: specification of multiple direction choices and final selection of action. Neuron 45, 801–814 (doi:10.1016/j.neuron.2005.01.027) [DOI] [PubMed] [Google Scholar]
- 23.Meister MLR, Hennig JA, Huk AC. 2013. Signal multiplexing and single-neuron computations in lateral intraparietal area during decision-making. J. Neurosci. 33, 2254–2267 (doi:10.1523/JNEUROSCI.2984-12.2013) [DOI] [PMC free article] [PubMed] [Google Scholar]
- 24.Bruce CJ, Goldberg ME. 1985. Primate frontal eye fields. I. Single neurons discharging before saccades. J. Neurophysiol. 53, 603–635 [DOI] [PubMed] [Google Scholar]
- 25.Wurtz RH, Mohler CW. 1976. Organization of monkey superior colliculus: enhanced visual response of superficial layer cells. J. Neurophysiol. 39, 745–765 [DOI] [PubMed] [Google Scholar]
- 26.Sato TR, Schall JD. 2003. Effects of stimulus-response compatibility on neural selection in frontal eye field. Neuron 38, 637–648 (doi:10.1016/S0896-6273(03)00237-X) [DOI] [PubMed] [Google Scholar]
- 27.Murthy A, Ray S, Shorter SM, Schall JD, Thompson KG. 2009. Neural control of visual search by frontal eye field: effects of unexpected target displacement on visual selection and saccade preparation. J. Neurophysiol. 101, 2485–2506 (doi:10.1152/jn.90824.2008) [DOI] [PMC free article] [PubMed] [Google Scholar]
- 28.Ding L, Gold JI. 2010. Caudate encodes multiple computations for perceptual decisions. J. Neurosci. 30, 15 747–15 759 (doi:10.1523/JNEUROSCI.2894-10.2010) [DOI] [PMC free article] [PubMed] [Google Scholar]
- 29.Ding L, Gold JI. 2012. Neural correlates of perceptual decision making before, during, and after decision commitment in monkey frontal eye field. Cereb. Cortex 22, 1052–1067 (doi:10.1093/cercor/bhr178) [DOI] [PMC free article] [PubMed] [Google Scholar]
- 30.Ratcliff R. 2002. A diffusion model account of response time and accuracy in a brightness discrimination task: fitting real data and failing to fit fake but plausible data. Psychon. Bull. Rev. 9, 278–291 (doi:10.3758/BF03196283) [DOI] [PubMed] [Google Scholar]
- 31.Palmer J, Huk AC, Shadlen MN. 2005. The effect of stimulus strength on the speed and accuracy of a perceptual decision. J. Vision 5, 376–404 (doi:10.1167/5.5.1) [DOI] [PubMed] [Google Scholar]
- 32.Kim JN, Shadlen MN. 1999. Neural correlates of a decision in the dorsolateral prefrontal cortex of the macaque. Nat. Neurosci. 2, 176–185 (doi:10.1038/5739) [DOI] [PubMed] [Google Scholar]
- 33.Huk AC, Shadlen MN. 2005. Neural activity in macaque parietal cortex reflects temporal integration of visual motion signals during perceptual decision making. J. Neurosci. 25, 10 420–10 436 (doi:10.1523/JNEUROSCI.4684-04.2005) [DOI] [PMC free article] [PubMed] [Google Scholar]
- 34.Maimon G, Assad JA. 2006. A cognitive signal for the proactive timing of action in macaque LIP. Nat. Neurosci. 9, 948–955 (doi:10.1038/nn1716) [DOI] [PubMed] [Google Scholar]
- 35.Ratcliff R, Cherian A, Segraves M. 2003. A comparison of macaque behavior and superior colliculus neuronal activity to predictions from models of two-choice decisions. J. Neurophysiol. 90, 1392–1407 (doi:10.1152/jn.01049.2002) [DOI] [PubMed] [Google Scholar]
- 36.Churchland AK, Kiani R, Shadlen MN. 2008. Decision-making with multiple alternatives. Nat. Neurosci. 11, 693–702 (doi:10.1038/nn.2123) [DOI] [PMC free article] [PubMed] [Google Scholar]
- 37.Purcell BA, Heitz RP, Cohen JY, Schall JD, Logan GD, Palmeri TJ. 2010. Neurally constrained modeling of perceptual decision making. Psychol. Rev. 117, 1113–1143 (doi:10.1037/a0020311) [DOI] [PMC free article] [PubMed] [Google Scholar]
- 38.Everling S, Dorris MC, Klein RM, Munoz DP. 1999. Role of primate superior colliculus in preparation and execution of anti-saccades and pro-saccades. J. Neurosci. 19, 2740–2754 [DOI] [PMC free article] [PubMed] [Google Scholar]
- 39.Everling S, Munoz DP. 2000. Neuronal correlates for preparatory set associated with pro-saccades and anti-saccades in the primate frontal eye field. J. Neurosci. 20, 387–400 [DOI] [PMC free article] [PubMed] [Google Scholar]
- 40.Heekeren HR, Marrett S, Bandettini PA, Ungerleider LG. 2004. A general mechanism for perceptual decision-making in the human brain. Nature 431, 859–862 (doi:10.1038/nature02966) [DOI] [PubMed] [Google Scholar]
- 41.Forstmann BU, Dutilh G, Brown S, Neumann J, von Cramon DY, Richard Ridderinkhof K, Wagenmakers E-J. 2008. Striatum and pre-SMA facilitate decision-making under time pressure. Proc. Natl Acad. Sci. USA 105, 17 538–17 542 (doi:10.1073/pnas.0805903105) [DOI] [PMC free article] [PubMed] [Google Scholar]
- 42.Forstmann BU, Anwander A, Schäfer A, Neumann J, Brown S, Wagenmakers E-J, Bogacz R, Turner R. 2010. Cortico-striatal connections predict control over speed and accuracy in perceptual decision making. Proc. Natl Acad. Sci. USA 107, 15 916–15 920 (doi:10.1073/pnas.1004932107) [DOI] [PMC free article] [PubMed] [Google Scholar]
- 43.Ivanoff J, Branning P, Marois R. 2008. fMRI evidence for a dual process account of the speed–accuracy tradeoff in decision-making. PLoS ONE 3, e2635 (doi:10.1371/journal.pone.0002635) [DOI] [PMC free article] [PubMed] [Google Scholar]
- 44.van Veen V, Krug MK, Carter CS. 2008. The neural and computational basis of controlled speed–accuracy tradeoff during task performance. J. Cogn. Neurosci. 20, 1952–1965 (doi:10.1162/jocn.2008.20146) [DOI] [PubMed] [Google Scholar]
- 45.van Maanen L, Brown S, Eichele T, Wagenmakers E-J, Ho T, Serences J, Forstmann BU. 2011. Neural correlates of trial-to-trial fluctuations in response caution. J. Neurosci. 31, 17 488–17 495 (doi:10.1523/JNEUROSCI.2924-11.2011) [DOI] [PMC free article] [PubMed] [Google Scholar]
- 46.Wenzlaff H, Bauer M, Maess B, Heekeren HR. 2011. Neural characterization of the speed–accuracy tradeoff in a perceptual decision-making task. J. Neurosci. 31, 1254–1266 (doi:10.1523/JNEUROSCI.4000-10.2011) [DOI] [PMC free article] [PubMed] [Google Scholar]
- 47.Ratcliff R, Philiastides MG, Sajda P. 2009. Quality of evidence for perceptual decision making is indexed by trial-to-trial variability of the EEG. Proc. Natl Acad. Sci. USA 106, 6539–6544 (doi:10.1073/pnas.0812589106) [DOI] [PMC free article] [PubMed] [Google Scholar]
- 48.O'Connell RG, Dockree PM, Kelly SP. 2012. A supramodal accumulation-to-bound signal that determines perceptual decisions in humans. Nat. Neurosci. 15, 1729–1735 (doi:10.1038/nn.3248) [DOI] [PubMed] [Google Scholar]
- 49.Hanes DP, Patterson WF, Schall JD. 1998. Role of frontal eye fields in countermanding saccades: visual, movement, and fixation activity. J. Neurophysiol. 79, 817–834 [DOI] [PubMed] [Google Scholar]
- 50.Paré M, Hanes DP. 2003. Controlled movement processing: superior colliculus activity associated with countermanded saccades. J. Neurosci. 23, 6480–6489 [DOI] [PMC free article] [PubMed] [Google Scholar]
- 51.Boucher L, Palmeri TJ, Logan GD, Schall JD. 2007. Inhibitory control in mind and brain: an interactive race model of countermanding saccades. Psychol. Rev. 114, 376–397 (doi:10.1037/0033-295X.114.2.376) [DOI] [PubMed] [Google Scholar]
- 52.Brown JW, Hanes DP, Schall JD, Stuphorn V. 2008. Relation of frontal eye field activity to saccade initiation during a countermanding task. Exp. Brain Res. 190, 135–151 (doi:10.1007/s00221-008-1455-0) [DOI] [PMC free article] [PubMed] [Google Scholar]
- 53.Schall JD, Boucher L. 2007. Executive control of gaze by the frontal lobes. Cogn. Affect. Behav. Neurosci. 7, 396–412 (doi:10.3758/CABN.7.4.396) [DOI] [PubMed] [Google Scholar]
- 54.Schall JD, Godlove DC. 2012. Current advances and pressing problems in studies of stopping. Curr. Opin. Neurobiol. 22, 1012–1021 (doi:10.1016/j.conb.2012.06.002) [DOI] [PMC free article] [PubMed] [Google Scholar]
- 55.Raybourn MS, Keller EL. 1977. Colliculoreticular organization in primate oculomotor system. J. Neurophysiol. 40, 861–878 [DOI] [PubMed] [Google Scholar]
- 56.Huerta MF, Krubitzer LA, Kaas JH. 1986. Frontal eye field as defined by intracortical microstimulation in squirrel monkeys, owl monkeys, and macaque monkeys: I. Subcortical connections. J. Comp. Neurol. 253, 415–439 (doi:10.1002/cne.902530402) [DOI] [PubMed] [Google Scholar]
- 57.Stanton GB, Goldberg ME, Bruce CJ. 1988. Frontal eye field efferents in the macaque monkey. II. Topography of terminal fields in midbrain and pons. J. Comp. Neurol. 271, 493–506 (doi:10.1002/cne.902710403) [DOI] [PubMed] [Google Scholar]
- 58.Segraves MA. 1992. Activity of monkey frontal eye field neurons projecting to oculomotor regions of the pons. J. Neurophysiol. 68, 1967–1985 [DOI] [PubMed] [Google Scholar]
- 59.Pouget P, Stepniewska I, Crowder EA, Leslie MW, Emeric EE, Nelson MJ, Schall JD. 2009. Visual and motor connectivity and the distribution of calcium-binding proteins in macaque frontal eye field: implications for saccade target selection. Front. Neuroanat. 3, 2 (doi:10.3389/neuro.05.002.2009) [DOI] [PMC free article] [PubMed] [Google Scholar]
- 60.Bisley JW, Goldberg ME. 2003. Neuronal activity in the lateral intraparietal area and spatial attention. Science 299, 81–86 (doi:10.1126/science.1077395) [DOI] [PubMed] [Google Scholar]
- 61.Thompson KG, Bichot NP. 2005. A visual salience map in the primate frontal eye field. Prog. Brain Res. 147, 251–262 [DOI] [PubMed] [Google Scholar]
- 62.Fecteau JH, Munoz DP. 2006. Salience, relevance, and firing: a priority map for target selection. Trends Cogn. Sci. 10, 382–390 (doi:10.1016/j.tics.2006.06.011) [DOI] [PubMed] [Google Scholar]
- 63.Shen K, Valero J, Day GS, Paré M. 2011. Investigating the role of the superior colliculus in active vision with the visual search paradigm. Eur. J. Neurosci. 33, 2003–2016 (doi:10.1111/j.1460-9568.2011.07722.x) [DOI] [PubMed] [Google Scholar]
- 64.Gottlieb JP, Kusunoki M, Goldberg ME. 1998. The representation of visual salience in monkey parietal cortex. Nature 391, 481–484 (doi:10.1038/35135) [DOI] [PubMed] [Google Scholar]
- 65.Kim B, Basso MA. 2008. Saccade target selection in the superior colliculus: a signal detection theory approach. J. Neurosci. 28, 2991–3007 (doi:10.1523/JNEUROSCI.5424-07.2008) [DOI] [PMC free article] [PubMed] [Google Scholar]
- 66.Armstrong KM, Chang MH, Moore T. 2009. Selection and maintenance of spatial information by frontal eye field neurons. J. Neurosci. 29, 15 621–15 629 (doi:10.1523/JNEUROSCI.4465-09.2009) [DOI] [PMC free article] [PubMed] [Google Scholar]
- 67.Buschman TJ, Miller EK. 2007. Top-down versus bottom-up control of attention in the prefrontal and posterior parietal cortices. Science 315, 1860–1862 (doi:10.1126/science.1138071) [DOI] [PubMed] [Google Scholar]
- 68.Louie K, Glimcher PW. 2010. Separating value from choice: delay discounting activity in the lateral intraparietal area. J. Neurosci. 30, 5498–5507 (doi:10.1523/JNEUROSCI.5742-09.2010) [DOI] [PMC free article] [PubMed] [Google Scholar]
- 69.Louie K, Grattan LE, Glimcher PW. 2011. Reward value-based gain control: divisive normalization in parietal cortex. J. Neurosci. 31, 10 627–10 639 (doi:10.1523/JNEUROSCI.1237-11.2011) [DOI] [PMC free article] [PubMed] [Google Scholar]
- 70.Leathers ML, Olson CR. 2012. In monkeys making value-based decisions, LIP neurons encode cue salience and not action value. Science 338, 132–135 (doi:10.1126/science.1226405) [DOI] [PMC free article] [PubMed] [Google Scholar]
- 71.Treisman A, Sato S. 1990. Conjunction search revisited. J. Exp. Psychol. Hum. Percept. Perform. 16, 459–478 (doi:10.1037/0096-1523.16.3.459) [DOI] [PubMed] [Google Scholar]
- 72.Wolfe J. 1994. Guided search 2. 0. A revised model of visual search. Psychon. Bull. Rev. 1, 202–238 (doi:10.3758/BF03200774) [DOI] [PubMed] [Google Scholar]
- 73.Desimone R, Duncan J. 1995. Neural mechanisms of selective visual attention. Annu. Rev. Neurosci. 18, 193–222 (doi:10.1146/annurev.ne.18.030195.001205) [DOI] [PubMed] [Google Scholar]
- 74.Bundesen C, Habekost T, Kyllingsbaek S. 2005. A neural theory of visual attention: bridging cognition and neurophysiology. Psychol. Rev. 112, 291–328 (doi:10.1037/0033-295X.112.2.291) [DOI] [PubMed] [Google Scholar]
- 75.Thompson KG, Hanes DP, Bichot NP, Schall JD. 1996. Perceptual and motor processing stages identified in the activity of macaque frontal eye field neurons during visual search. J. Neurophysiol. 76, 4040–4055 [DOI] [PubMed] [Google Scholar]
- 76.Balan PF, Oristaglio J, Schneider DM, Gottlieb J. 2008. Neuronal correlates of the set-size effect in monkey lateral intraparietal area. PLoS Biol. 6, e158 (doi:10.1371/journal.pbio.0060158) [DOI] [PMC free article] [PubMed] [Google Scholar]
- 77.Cohen JY, Heitz RP, Woodman GF, Schall JD. 2009. Neural basis of the set-size effect in frontal eye field: timing of attention during visual search. J. Neurophysiol. 101, 1699–1704 (doi:10.1152/jn.00035.2009) [DOI] [PMC free article] [PubMed] [Google Scholar]
- 78.Thompson KG, Bichot NP, Sato TR. 2005. Frontal eye field activity before visual search errors reveals the integration of bottom-up and top-down salience. J. Neurophysiol. 93, 337–351 (doi:10.1152/jn.00330.2004) [DOI] [PMC free article] [PubMed] [Google Scholar]
- 79.Heitz RP, Cohen JY, Woodman GF, Schall JD. 2010. Neural correlates of correct and errant attentional selection revealed through N2pc and frontal eye field activity. J. Neurophysiol. 104, 2433–2441 (doi:10.1152/jn.00604.2010) [DOI] [PMC free article] [PubMed] [Google Scholar]
- 80.Purcell BA, Schall JD, Logan GD, Palmeri TJ. 2012. From salience to saccades: multiple-alternative gated stochastic accumulator model of visual search. J. Neurosci. 32, 3433–3446 (doi:10.1523/JNEUROSCI.4622-11.2012) [DOI] [PMC free article] [PubMed] [Google Scholar]
- 81.Heitz RP, Schall JD. 2012. Neural mechanisms of speed–accuracy tradeoff. Neuron 76, 616–628 (doi:10.1016/j.neuron.2012.08.030) [DOI] [PMC free article] [PubMed] [Google Scholar]
- 82.Rinkenauer G, Osman A, Ulrich R, Muller-Gethmann H, Mattes S. 2004. On the locus of speed–accuracy trade-off in reaction time: inferences from the lateralized readiness potential. J. Exp. Psychol. Gen. 133, 261–282 (doi:10.1037/0096-3445.133.2.261) [DOI] [PubMed] [Google Scholar]
- 83.Scudder CA, Kaneko CS, Fuchs AF. 2002. The brainstem burst generator for saccadic eye movements: a modern synthesis. Exp. Brain Res. 142, 439–462 (doi:10.1007/s00221-001-0912-9) [DOI] [PubMed] [Google Scholar]
- 84.Yoshida K, Iwamoto Y, Chimoto S, Shimazu H. 1999. Saccade-related inhibitory input to pontine omnipause neurons: an intracellular study in alert cats. J. Neurophysiol. 82, 1198–1208 [DOI] [PubMed] [Google Scholar]
- 85.Zhang J. 2012. The effects of evidence bounds on decision-making: theoretical and empirical developments. Front. Psychol. 3, 263. [DOI] [PMC free article] [PubMed] [Google Scholar]
- 86.Katzner S, Nauhaus I, Benucci A, Bonin V, Ringach DL, Carandini M. 2009. Local origin of field potentials in visual cortex. Neuron 61, 35–41 (doi:10.1016/j.neuron.2008.11.016) [DOI] [PMC free article] [PubMed] [Google Scholar]
- 87.Woodman G, Kang M, Rossi AF, Schall JD. 2007. Nonhuman primate event-related potentials indexing covert shifts of attention. Proc. Natl Acad. Sci. USA 104, 15 111–15 116 (doi:10.1073/pnas.0703477104) [DOI] [PMC free article] [PubMed] [Google Scholar]
- 88.Cohen JY, Heitz RP, Schall JD, Woodman GF. 2009. On the origin of event-related potentials indexing covert attentional selection during visual search. J. Neurophysiol. 102, 2375–2386 (doi:10.1152/jn.00680.2009) [DOI] [PMC free article] [PubMed] [Google Scholar]
- 89.Luck SJ, Hillyard SA. 1994. Electrophysiological correlates of feature analysis during visual search. Psychophysiology 31, 291–308 (doi:10.1111/j.1469-8986.1994.tb02218.x) [DOI] [PubMed] [Google Scholar]
- 90.Eimer M. 1996. The N2pc component as an indicator of attentional selectivity. Electroencephalogr. Clin. Neurophysiol. 99, 225–234 (doi:10.1016/0013-4694(96)95711-9) [DOI] [PubMed] [Google Scholar]
- 91.Woodman GF, Luck SJ. 1999. Electrophysiological measurement of rapid shifts of attention during visual search. Nature 400, 867–869 (doi:10.1038/23698) [DOI] [PubMed] [Google Scholar]
- 92.Töllner T, Zehetleitner M, Gramann K, Müller HJ. 2011. Stimulus saliency modulates pre-attentive processing speed in human visual cortex. PLoS ONE 6, e16276 (doi:10.1371/journal.pone.0016276) [DOI] [PMC free article] [PubMed] [Google Scholar]
- 93.Hopf JM, Luck SJ, Girelli M, Hagner T, Mangun GR, Scheich H, Heinze H-J. 2000. Neural sources of focused attention in visual search. Cereb. Cortex 10, 1233–1241 (doi:10.1093/cercor/10.12.1233) [DOI] [PubMed] [Google Scholar]
- 94.Fuggetta G, Pavone EF, Walsh V, Kiss M, Eimer M. 2006. Cortico-cortical interactions in spatial attention: a combined ERP/TMS study. J. Neurophysiol. 95, 3277–3280 (doi:10.1152/jn.01273.2005) [DOI] [PMC free article] [PubMed] [Google Scholar]
- 95.Monosov IE, Trageser JC, Thompson KG. 2008. Measurements of simultaneously recorded spiking activity and local field potentials suggest that spatial selection emerges in the frontal eye field. Neuron 57, 614–625 (doi:10.1016/j.neuron.2007.12.030) [DOI] [PMC free article] [PubMed] [Google Scholar]
- 96.Logothetis NK, Wandell BA. 2004. Interpreting the BOLD signal. Annu. Rev. Physiol. 66, 735–769 (doi:10.1146/annurev.physiol.66.082602.092845) [DOI] [PubMed] [Google Scholar]
- 97.Gregoriou GG, Gotts SJ, Zhou H, Desimone R. 2009. High-frequency, long-range coupling between prefrontal and visual cortex during attention. Science 324, 1207–1210 (doi:10.1126/science.1171402) [DOI] [PMC free article] [PubMed] [Google Scholar]
- 98.Jasper H. 1958. The ten twenty electrode system of the international federation. Electroencephalogr. Clin. Neurophysiol. 10, 371–375 [PubMed] [Google Scholar]
- 99.Miller J, Patterson T, Ulrich R. 1998. Jackknife-based method for measuring LRP onset latency differences. Psychophysiology 35, 99–115 (doi:10.1111/1469-8986.3510099) [PubMed] [Google Scholar]
- 100.Engel AK, Fries P, Singer W. 2001. Dynamic predictions: oscillations and synchrony in top-down processing. Nat. Rev. Neurosci. 2, 704–716 (doi:10.1038/35094565) [DOI] [PubMed] [Google Scholar]
- 101.Fries P. 2005. A mechanism for cognitive dynamics: neuronal communication through neuronal coherence. Trends Cogn. Sci. 9, 474–480 (doi:10.1016/j.tics.2005.08.011) [DOI] [PubMed] [Google Scholar]
- 102.Fries P, Reynolds JH, Rorie AE, Desimone R. 2001. Modulation of oscillatory neuronal synchronization by selective visual attention. Science 291, 1560–1563 (doi:10.1126/science.1055465) [DOI] [PubMed] [Google Scholar]
- 103.Womelsdorf T, Fries P, Mitra PP, Desimone R. 2006. Gamma-band synchronization in visual cortex predicts speed of change detection. Nature 439, 733–736 (doi:10.1038/nature04258) [DOI] [PubMed] [Google Scholar]
- 104.Bichot NP, Rossi AF, Desimone R. 2005. Parallel and serial neural mechanisms for visual search in macaque area V4. Science 308, 529–534 (doi:10.1126/science.1109676) [DOI] [PubMed] [Google Scholar]
- 105.Jarvis MR, Mitra PP. 2001. Sampling properties of the spectrum and coherency of sequences of action potentials. Neural Comput. 13, 717–749 (doi:10.1162/089976601300014312) [DOI] [PubMed] [Google Scholar]
- 106.Maris E, Schoffelen J-M, Fries P. 2007. Nonparametric statistical testing of coherence differences. J. Neurosci. Methods 163, 161–175 (doi:10.1016/j.jneumeth.2007.02.011) [DOI] [PubMed] [Google Scholar]
- 107.Lakatos P, Karmos G, Mehta AD, Ulbert I, Schroeder CE. 2008. Entrainment of neuronal oscillations as a mechanism of attentional selection. Science 320, 110–113 (doi:10.1126/science.1154735) [DOI] [PubMed] [Google Scholar]
- 108.Schroeder CE, Lakatos P. 2009. Low-frequency neuronal oscillations as instruments of sensory selection. Trends Neurosci. 32, 9–18 (doi:10.1016/j.tins.2008.09.012) [DOI] [PMC free article] [PubMed] [Google Scholar]


