

Abstract
A disulfide-linked imidazoline nitroxide side chain (V1) has a similar and highly constrained internal motion at diverse topological sites in a protein, unlike that for the disulfide-linked pyrroline nitroxide side chain (R1) widely used in site directed spin labeling EPR. Crystal structures of V1 at two positions in a helix of T4 Lysozyme and quantum mechanical calculations suggest the source of the constraints as intra-side chain interactions of the disulfide sulfur atoms with both the protein backbone and the 3-nitrogen in the imidazoline ring. These interactions apparently limit the conformation of the side chain to one of only three possible rotamers, two of which are observed in the crystal structure. An inter-spin distance measurement in frozen solution using double electron-electron resonance (DEER) gives a value essentially identical to that determined from the crystal structure of the protein containing two copies of V1, indicating that lattice forces do not dictate the rotamers observed. Collectively, the results suggest the possibility of predetermining a unique rotamer of V1 in helical structures. In general, the reduced rotameric space of V1 compared to R1 should simplify interpretation of interspin distance information in terms of protein structure, while the highly constrained internal motion is expected to extend the dynamic range for characterizing large amplitude nanosecond backbone fluctuations.
Keywords: Spin labeling
Site-directed spin labeling (SDSL) is a powerful technique to study protein conformational equilibria [1-5] and dynamics [6-9] under physiological conditions. In the most common implementation, a nitroxide side chain is introduced at a selected site in a protein by mutating the residue of interest to a cysteine followed by modification with a sulfhydryl specific nitroxide reagent [10, 11]. Recently, it has been shown that a nitroxide may be introduced without the use of cysteine via a genetically encoded unnatural amino acid [12, 13]. In any case, the EPR spectrum of a nitroxide attached to a protein reflects overall Brownian rotational diffusion of the protein and internal motion of the nitroxide side chain, the latter of which can be augmented by backbone dynamics on the ns time scale [3, 6]. The internal motion may be modulated by tertiary interactions of the side chain within the protein, providing information on local structure [14-18].
To isolate the contributions from internal and ns backbone motions, it is necessary to remove the influence of overall Brownian diffusion. For proteins larger than 50 kDa, the contribution from Brownian diffusion is negligible at X-band microwave frequencies; for small globular proteins, the contribution can be effectively eliminated by recording the spectra in a viscous solution [2, 14], by attaching the protein to a solid support [2], or by using high-frequency EPR [19, 20, 21]
The internal motion depends on the structure of the nitroxide side chain. The nitroxide side chain designated R1 (Figure 1A) has been widely used in EPR studies and numerous crystal structures have been determined for the side chain in T4 Lysozyme [13-16], the β protein GB1 [22] and in the membrane proteins BtuB [23] and the leucine transporter LeuT [24]. The structures for R1 and quantum mechanical calculations reveal a consistent set of preferred rotamers which are apparently stabilized by interaction of the disulfide with backbone atoms [25]. To a first approximation, this interaction restricts the internal motion to torsional oscillations of the X4 and X5 dihedrals (see Figure 1A for definition of the dihedral angles) [6, 11]. Because of the hindered internal motion, the anisotropies in the magnetic Zeeman and hyperfine interaction are not completely averaged, and R1 retains significant order reflected in an EPR spectrum characteristic of an anisotropic motion [11]. On one hand, the internal modes of R1 bias the nitroxide motion to a region of maximum sensitivity for detecting small differences in amplitude and rate on the ns time scale, making R1 ideal for monitoring site dependent backbone motion in well-ordered proteins [9]. On the other hand, the internal modes reduce the dynamic range over which the amplitudes of backbone motions can be measured [7]. In addition, the internal motions and multiple rotamers lead to uncertainty in the spatial location of the nitroxide, complicating the interpretation of inter-spin distance measurements in terms of protein structure. To constrain the internal motion, side chains with a 4-substituent on the nitroxide ring have been investigated [7, 11, 26]. In each case the presence of the substituent increased the order and decreased the effective rate of the internal motion, thus extending the dynamic range for characterizing large amplitude backbone motions. The most constrained nitroxide side chain is TOAC in which the nitroxide ring is fused to the peptide backbone, but so far has only been introduced by peptide synthesis or peptide ligation methods [27-31].
Figure 1.
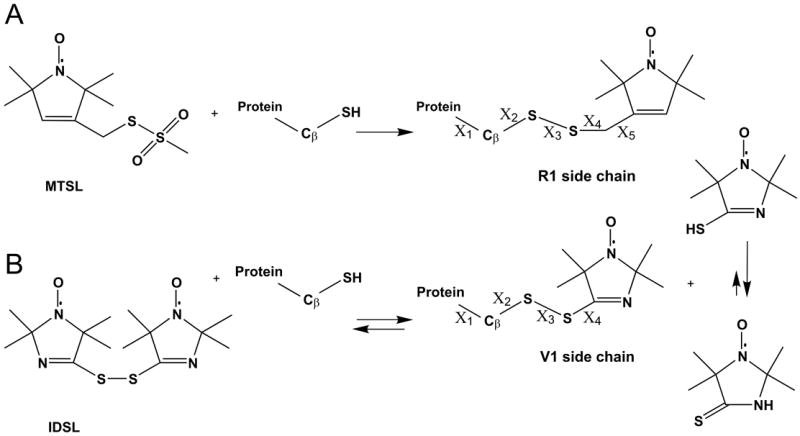
Introduction of nitroxide side chains via cysteine substitution mutagenesis. In each case, a cysteine residue is introduced at the site of interest, followed by reaction with the desired sulfhydryl specific reagent. (A), reaction with 1-Oxyl-2,2,5,5-tetramethypyrroline-3-methyl (MTSL) to generate R1. (B), reaction with bis(2,2,5,5-tetramethyl-3-imidazoline-1-oxyl-4-il)-disulfide (IDSL) to generate V1. Numbering of dihedral angles (X) is shown for each side chain.
In this report an imidazoline nitroxide side chain, designated V1 (Figure 1B), is shown to have a highly ordered internal motion and restricted rotameric space relative to R1 and thus should be useful to extend the dynamic range for detection of backbone motions and to provide a more localized nitroxide for interspin distance measurements either by linewidth methods [32, 33] or pulsed dipolar spectroscopy [34, 35]. Crystallographic and computational studies reveal an intra-residue N-S interaction as the structural origin of the high order.
MATERIALS AND METHODS
Preparation, expression and spin labeling of mutant T4L protein
T4 Lysozyme cysteine substitution mutants employed in the study were prepared as previously reported in a cysteine-less pseudo-wild type background having C54T and C97A substitutions [12, 14-16]. All mutant proteins were at least 95% pure as judged by SDS-PAGE electrophoresis. Dithiothreitol (DTT) was added to the purified protein in 50mM MOPS, 25mM NaCl pH 6.8 to a final concentration of 5mM and the protein was stored at -20°C in 20% glycerol.
The spin labeling reagent bis(2,2,5,5-tetramethyl-3-imidazoline-1-oxyl-4-il)-disulfide (IDSL), was prepared as previously described [36]. The reagent 2,2,5,5-tetramethyl-pyrroline-1-oxyl methanethiosulfonate (MTSL) was a generous gift of Prof. Kalman Hideg (University of Pecs, Hungary). Before spin labeling, the protein was loaded onto a 5ml HiTrap desalting column (GE Healthcare) equilibrated with 50mM MOPS, 25mM NaCl pH 6.8 and eluted with the same to remove DTT. The eluted protein was immediately reacted with 5-10 fold excess of spin labeling reagent overnight at room temperature. The excess spin label was removed on a HiTrap desalting column. The spin labeled protein was concentrated to ~200μM using an Amicon Ultra centrifugal filter Device (10kDa cutoff) (Millipore, Bedford, MA) and stored at -20°C.
EPR spectroscopy and spectral simulations
EPR measurements were performed on a Bruker Elexsys E580 fitted with a high sensitivity resonator. Protein solutions of 5μl were contained in quartz capillaries (0.60mm ID × 0.84mm OD) and spectra were recorded using 20mW incident microwave power at 298K. Unless otherwise noted, spectra were recorded in 30% w/v sucrose to reduce the rotary diffusion rate of the protein [2].
For lineshape fitting studies, mutant T4L72 was immobilized on cyanogen bromide activated Sepharose 4B beads as previously described [3]. The EPR spectrum for T4L 72V1 immobilized on Sepharose was fit to the MOMD model of Freed and coworkers [37]. The principle components for the A (hyperfine interaction) and g tensors used were determined from a least-squares fit to the spectrum of T4L 72V1 in frozen solution at 193K. The values are: Azz = 34.9 Gauss, Axx = 5.9 Gauss, Ayy = 5.18 Gauss; gzz ≡ 2.0023, gxx = 2.0089, gyy = 2.0062.
Four pulse Double Electron Electron Resonance (DEER) was conducted on a Bruker Elexys 580 spectrometer operated at Q-band and fitted with an Bruker EN5107D2 resonator. Samples of 150-200 μM spin labeled T4L containing 20% glycerol (v/v) were loaded into borosilicate capillaries (1.4mm ID × 1.7mm OD), and then flash-frozen in liquid nitrogen; data were collected at 80 K. Observe pulses were 16ns (π/2) and 32ns (π), respectively and the pump pulse was 36ns as optimized for the instrument. The pump pulse was centered on the low-field peak and the observe pulses were placed 50MHz upfield for the R1 labels. To test for the presence of orientation selection, all V1 samples were measured at three frequency offsets, namely at 45, 69, and 90MHz, again while keeping the pump pulse on the low-field peak. Detailed analysis of the data in terms of distance probability profiles was done using the program LongDistances (Download information can be found at http://chemistry.ucla.edu/directory/hubbell-wayne-l).
X-ray Crystallography
T4L65V1/76V1 was crystallized using the hanging drop vapor diffusion method. Reservoir buffers were prepared in three different concentrations of the precipitant (1.8M - 2.2M Na/KPO4) all having 0.15M NaCl and 100mM 1,6 hexanediol at four different pH’s (6.2, 6.6, 6.8, 7.2) with or without the additive 3% 2-propanol. Initial crystallization trials were prepared by mixing 2μl of purified labeled protein (5 - 10mg/ml in 50mM MOPS, 25mM NaCl, pH 6.8) with 2μl of reservoir buffer and by suspending the drop over 1ml of the same buffer. The conditions were further optimized to obtain better diffracting crystals. Final crystallization condition was 2.2M Na/KPO4, pH 7 without 2-propanol. Crystals appeared in two days.
The crystals of T4L65V1/76V1 were cyroprotected using mineral oil and were flash frozen at 100K with a nitrogen gas stream. Data was collected at 100K on a RAXIS-IV++ image plate detector (RIGAKU), processed with DENZO [39] and reduced with SCALEPACK [39]. T4L65/76V1 crystals grew in space group P3221 and were isomorphous with the wild type T4 Lysozyme crystals with similar cell dimensions [40]. The data sets showed only one molecule in the asymmetric unit.
The structure was determined by molecular replacement method using PHASER [41]. PDB accession code 1C6T [42] was used as a starting model. A randomly selected 5% of the data was set aside before the start of the refinement to calculate Rfree. Models were refined using REFMAC [43] or PHENIX [44] and rebuilt using COOT [45]. The refinement quality was monitored using the Rfree. The final structures were validated with COOT, PROCHECK [46], ERRAT [47], and WHAT_CHECK [48]. X-ray data collection and refinement statistics are reported in Tables 1 and 2, respectively.
Table 1.
X-ray Data Collection statistics for T4 Lysozyme K65V1/R76V1
| K65V1/R76V1 | |
|---|---|
| Wavelength (Å) | 1.5418 |
| Temperature (K) | 100 |
| Resolution (Å) | 80-1.50 |
| Space group | P 3221 |
| Highest Resolution Shell (Å) | 1.55-1.50 |
| Unit cell dimensions | |
| a (Å) | 59.547 |
| b (Å) | 59.547 |
| c (Å) | 95.280 |
| Reflections | |
| Total | 176930 |
| Unique | 30957 |
| Rsym(%) | 5.8 (36.8) |
| Completeness (%) | 96.8 (76.2) |
| I/σ | 25.9 (2.2) |
Statistics for the highest-resolution shell are shown in parentheses
Table 2.
Refinement Statistics for T4 Lysozyme K65V1/R76V1 mutant
| K65V1/R76V1 | |
|---|---|
| Resolution (Å) | 1.50 |
| Number of non-H atoms | |
| Protein | 1302 |
| Non-protein | 190 |
| Rwork (%) | 19.8 |
| Rfree (%) | 21.2 |
| Average B-factor (Å2) | |
| Protein | 18.0 |
| Non-Protein | 26.8 |
| Ramachandran analysis (%) | |
| Most favored | 98.1 |
| Additionally allowed | 1.9 |
| Generously allowed | 0 |
| Disallowed | 0 |
| RMS deviation | |
| Bond lengths (Å) | 0.007 |
| Bond angle (°) | 1.160 |
| PDB ID | 3K2R |
Rwork=(Σ|Fo - Fc|/Σ|Fo|) × 100 where Fo is the observed structure factor amplitude and Fc is the calculated structure factor amplitude
Rfree is Rwork calculated using 5% of the data, randomly chosen and omitted from refinement
Quantum Mechanical Calculations
Conformations for V1 in a model helix were optimized and relaxed scans were performed at the B3LYP/6-31G (d) level using the Gaussian 03 package (Gaussian, Inc.) as previously described [25]. For the model helix, the backbone φ, ψ and ω angles were fixed at -60°, -40° and 180° respectively; energies reported are relative gas phase conformational energies.
RESULTS
The V1 side chain
The reagent used to generate V1 via reaction with cysteine (IDSL, Figure 1B) was introduced by Volodarsky and coworkers for in vitro and in vivo measurement of thiols by EPR based techniques [36, 49-51,]. As shown in Figure 1B, a thiol-disulfide exchange process is possible in the reaction mixture [36]; the thioamide tautomeric form of the thiol product is apparently strongly preferred [52] and overall the desired V1 species dominates the mixture [49].
Although molecular models show that the V1 side chain should have essentially free rotation about X4 (see Figure 1B for definition of side chain dihedral angles) the EPR spectra at all sites examined in folded protein structures reflect strongly hindered motion of the nitroxide, but also contain a minor sharp component corresponding to a rapidly tumbling isotropic motion, possibly the monothiol in Figure 1B; an example is shown in Figure 2. The sharp component typically amounts to only 0.1 to 3% of the total signal after removal of excess IDSL reagent and increases slowly in time at the expense of the bound signal (over a period of days). Under any circumstance, this minor component does not complicate lineshape analysis of the dominant immobile component which corresponds to the V1 side chain in the protein; it can be removed if desired by spectral subtraction using the EPR spectrum of IDSL obtained after reduction of the disulfide by an equimolar amount of DTT (Figure 2).
Figure 2.
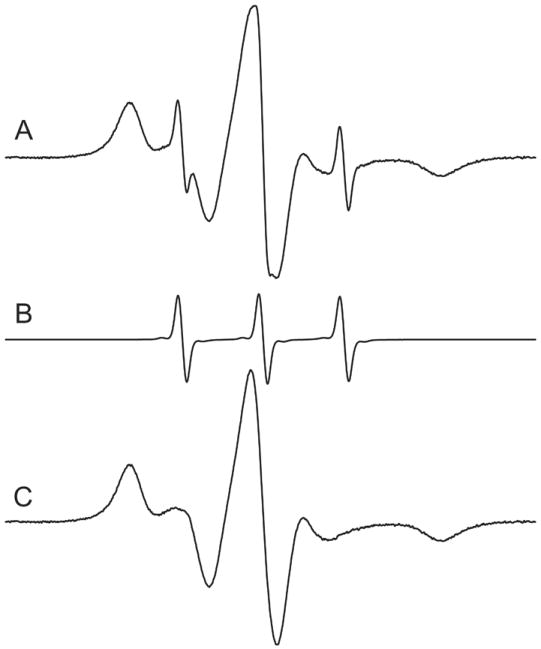
The EPR spectrum of T4L 72V1 in 30% sucrose solution. (A) The EPR spectrum was obtained immediately following reaction with IDSL and separation of excess reagent. (B) The EPR spectrum obtained after cleaving the IDSL disulfide bond with equimolar DTT. (C) The result of subtracting the spectrum in (B) from that in (A); the sharp component in this case amounts to ≈ 2.5% of the total spin concentration.
Figure 3A shows the location of sites in T4L where V1 was introduced in this study for comparison with R1. The sites include each of the topological classes of sites defined earlier [14], namely solvent exposed sites in helices (sites 65, 68, 72, 76, 131), an inter-helical loop site (site 82), a buried site (site 118) and a tertiary contact site (site 81, 134). The EPR spectra of R1 and V1 in T4L at the indicated sites are shown in Figure 3B and 3C, respectively. The spectra for R1 have been previously published [11, 14, 16-18] and are shown here for comparative purposes. The motion of the R1 side chain varies greatly from site to site, reflecting both differences in backbone dynamics [3, 11] as well as tertiary interactions with the protein that modulate the internal modes [16-18]. On the other hand, V1 is universally immobilized as revealed in the well-resolved hyperfine extrema of the EPR spectra, although there are site-dependent differences as revealed by small variations in the apparent hyperfine splitting (Azz’) (Figure 3C).
Figure 3.
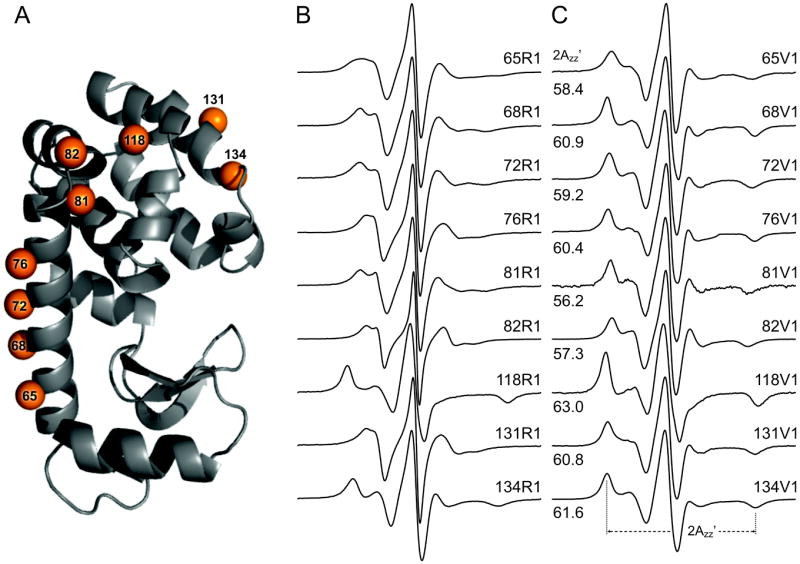
Comparison of EPR spectra of R1 and V1 at sites in T4L. (A) A ribbon Model of T4L, showing the investigated sites. (B) Room temperature spectra of sites labeled with R1. (C) Room temperature spectra of sites labeled with V1; the residual free signal has been subtracted. The definition of 2Azz’ is shown for 134V1 and all values of 2Azz’ are indicated.
The internal motion of V1
To isolate the internal motion of V1 in a protein, the side chain was introduced at site 72 in the long helix of T4L, and the rotational diffusion of the protein was eliminated by covalent coupling of the protein to a solid Sepharose support [2, 9]. Site 72 in T4L has been used extensively as a reference because it lies in a relatively rigid region of the protein and little contribution to side chain motions are expected from backbone fluctuations [11]. Moreover, the site is fully solvent exposed and nearest neighbor side chains have been shown to have little interactions with the R1 side chain [14]. Thus, the EPR spectrum of T4L 72V1 immobilized on the Sepharose support should be dominated by internal modes in the side chain itself.
The spectrum of T4L 72V1 attached to Sepharose (solid line) and a best fit to the microscopic order macroscopic disorder (MOMD) model of motion (dotted line) [35] are shown in Figure 4. This model allows for anisotropic motion of a nitroxide due to a restoring potential determined by the properties of the side chain (microscopic order), but with a random distribution of the protein with respect to the external field (macroscopic disorder). The best fit requires a fast internal motion with a correlation time τR ≈ 0.7 ns, but with a high degree of order that can be described as motion confined within a cone of half-angle ≈ 19°. In principle, this high ordering could be caused by interactions with or constraints imposed by neighboring side chains. This is unlikely considering that the sites selected for V1 substitution throughout T4L (Fig. 3A) have different neighbors but are all motionally constrained. Moreover, mutation of the nearest neighbor residues, one at a time, to alanine has essentially no effect on the motion of 131V1 as reflected in the EPR spectra (Figure 5), demonstrating that the motion is not dependent on the nearest neighbor identity and is apparently determined by internal side chain interactions. Thus, it is clear that the internal motion of V1 is highly constrained, and to identify the structural origins of the constraint the crystal structure was determined for V1 at two sites in T4L.
Figure 4.
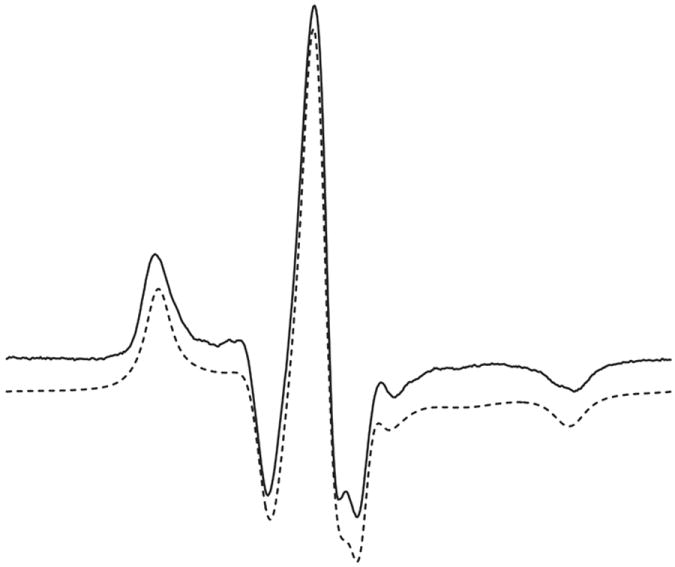
EPR spectrum and simulation of T4L 72V1 attached to CNBr activated Sepharose. The EPR spectrum was recorded at 298K in buffer without sucrose. The best fit (Materials and Methods) was obtained with an isotropic nitroxide diffusion of R =108.39 and with coefficients of the ordering potential being C20 = 2.0, C40=2.7; these values give a strong localization of the Z axis of the director along the 2p orbital of the nitroxide.
Figure 5.
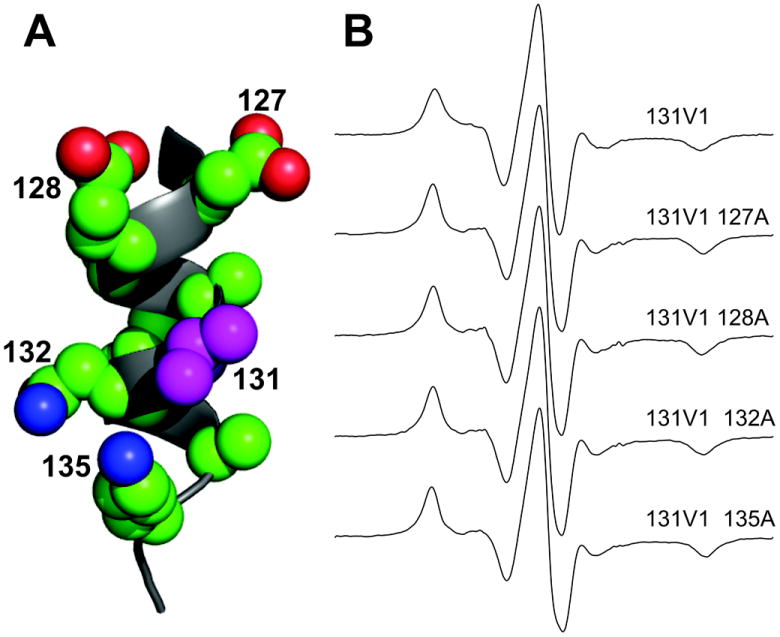
Influence of nearest neighbor side chains on the motion of 131V1. (A) Model of the H helix of T4L showing the nearest neighbors. (B) EPR spectrum of 131V1 and the corresponding spectra for single alanine substitution mutants at the indicated sites.
Crystal Structures of V1 in T4L
Figure 6A shows the electron density map for T4L containing V1 side chains at positions 65 and 76; electron densities of native side chains at other positions are also shown in the helix C to indicate the quality of the structure. Remarkably, electron density is resolved for the entire V1 side chain, consistent with the high ordering reflected in the CW EPR spectra. This in contrast to electron density maps of R1 at solvent exposed sites in helices, where electron density is not resolved for the nitroxide ring due to disorder about the X4 and X5 dihedrals [15-18].
Figure 6.
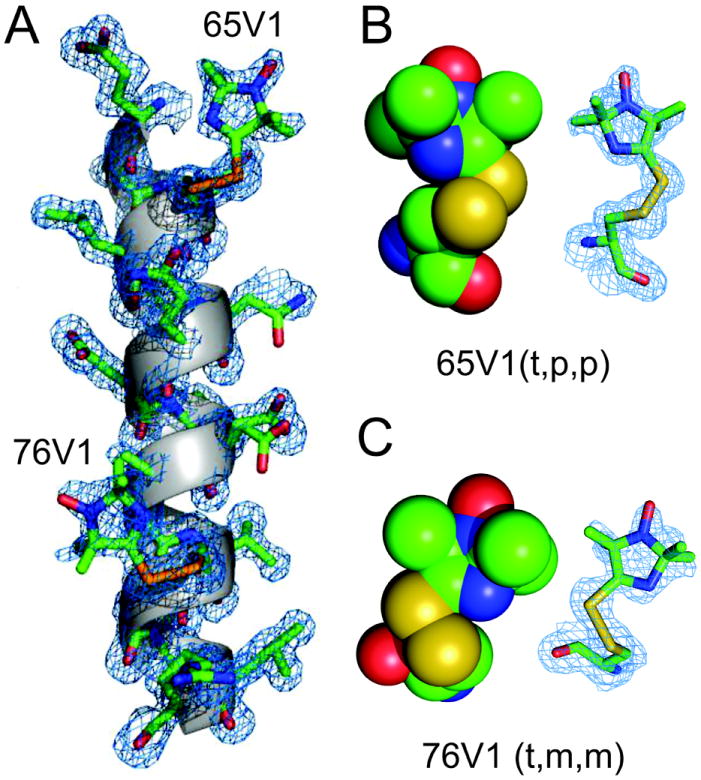
Crystal structure of T4L 65V1/76V1 at 100K. (A) Electron density map for V1 and neighboring side chains are shown for the C helix. The electron density (blue mesh) was calculated as an unweighted 2Fo-Fc map contoured at 1.0σ. (B) and (C) Space filling CPK models and electron density maps of 65V1 and 76V1, respectively, showing intra-side chain van der Waals interactions of the ring 3-N atom with the Sγ sulfur. The structure is deposited to the RCSB Protein Data Bank (PDB ID: 3K2R)
Rotamers of V1 will be discussed with respect to the set of dihedral angles {X1, X2, X3}, and designated using the same convention employed for R1. In this convention, a dihedral is either t (trans), p (plus) or m (minus), the plus and minus referring to the sign of the angle. For native side chains nominal values for t, p, m are 180°, +60° and -60° [53], but variations of ±20° (or more) are common for experimentally determined rotamers [54]. The X4 dihedral in V1 is uniquely determined by an intra-side chain interaction and will be discussed separately below.
The V1 side chain adopts different rotamers at sites 65 and 76, namely {t, p, p} and {t, m, m}, respectively (Table 3). Given the common chemical structure of the R1 and V1 side chains with respect to the Cβ-S-S- fragment (Figure 1), it is expected that the favored rotamers about X1 and X2 would be similar for the two side chains, and that is indeed the case; the {t,p} and {t,m} rotamers found for V1 are those favored for R1 as well. These rotamers are apparently stabilized by non-covalent attractive interactions within the side chain as evidenced by inter-atomic distances approximately equal to the sum of the van der Waals radii of the atoms in question. For the {t, p} rotamer of V1 the Sγ•••HCα and Sδ•••HCα distances meet this criterion, while for {t, m} Sγ•••HCα, Sγ•••O=C and Sδ•••O=C interactions are expected to be stabilizing (see Table 3). These are the same interactions that stabilize the rotamers in R1, as discussed in detail previously [18, 25]. Where it can be determined from the structures, the X3 disulfide dihedral in R1 typically adopts values of ± (90° ±20°) [16], determined by steric interactions of the nitroxide ring with the environment; for V1, X3 is ± (78±1°) (Table 3). Whether or not other rotamers of V1 can be populated remains to be determined in future crystal structures.
Table 3.
Structures of the T4L 65V1 and 76V1 side chains
| Dihedral angle or distance (d) Å | T4L 65V1 {t,p,p}a | T4L 76V1 {t,m,m}a |
|---|---|---|
| X1 | 180 | 180 |
| X2 | 87 | -79 |
| X3 | 77 | -79 |
| X4 | -22 | -7 |
| d(3N---Sγ) | 3.19 (3.35) | 3.23 (3.35) |
| d(Sγ---HCα) | 3.00 (3.00) | 2.99 (3.00) |
| d(Sδ---HCα) | 3.40 (3.00) | 4.22 (3.00) |
| d(Sγ---O=C) | 3.56 (3.35) | 3.36 (3.32) |
| d(Sδ---O=C) | 4.72 (3.35) | 3.35 (3.32) |
the value in parentheses is the sum of the van der Waals radii of the atoms in question. No value indicates a distance much greater than the van der Waals sum.
The interesting new feature of V1 in both rotamers is an additional N•••Sγ interaction involving the imidazoline ring nitrogen (Table 3) that apparently fixes the final dihedral X4, leading to both the high order in the crystal structure and the strong ordering of the motion of the ring in solution. Figures 6B and C show electron density maps and space filling models of the 65V1 and 76V1 structures with a view that reveals the N•••Sγ interactions. To verify the existence of the ring N•••Sγ interaction, gas phase quantum mechanical calculations were performed using density functional theory, as was previously done for R1 [25].
QM calculations of V1 in a model helix
Conformations of V1 attached to a model peptide unit [25] were built initially by setting the {X1, X2} angles to the most probable values ({m, m}, {t, p}, {t, m}) previously determined by X-ray crystallography for R1 [15-18] and by quantum mechanical calculations [25]. The X3 dihedral was set either to +90 ({p}) or -90 ({m}) [53, 55]. The {m, m, p}, {t, p, m} and {t, m, p} conformations could not be built due to steric clashes with the backbone atoms. The X4 angle was changed in 60° increments for {m, m, m}, {t, p, p} and {t, m, m}, and the conformations obtained were optimized at the B3LYP/6-31G(d) level as previously described [25]. Conformational energies for each observed minimum in the energy surface are reported relative to the lowest energy conformer ({m, m, m}) in Table 4. The important point is that for each of the three possible rotamer groups, the rotamer with the ring nitrogen within van der Waals interaction distance of the Sγ atom is ≈ 4kCal lower in energy than the next most favorable. The predicted lowest energy rotamer {m, m, m} is not observed in the crystal structure, and a possible reason for this is discussed below. For the experimentally observed rotamers, the predicted conformations and interatomic distances are close to those observed in the crystal structure (Table 4).
Table 4.
Gas phase conformational energies for V1 minima. Chi angles are shown in degrees and distances are shown in Å. For X4, the rotamers are designated as 1 through 3 for the identified minima. Values in parentheses are experimentally determined values for the {t, p, p} rotamer of 65V1 (in the {t,p,p,1} row) and for the {t,m,m} rotamer of 76V1 (in the {t,m,m,1} row).
| Rotamer | X1 | X2 | X3 | X4 | d(3N⋯Sγ) | ΔErel* (kcal/mol) |
|---|---|---|---|---|---|---|
| {m,m,m,1} | -56 | -60 | -74 | 10 | 3.17 | 0 |
| {m,m,m,2} | -55 | -58 | -87 | 162 | 4.3 | 3.99 |
| {m,m,m,3} | -61 | -50 | -92 | -137 | 4.2 | 5.04 |
| {t,p,p,1} | 183 (180) | 60 (87) | 77 (77) | -14 (-22) | 3.19 (3.19) | 3.99 |
| {t,p,p,2} | -180 | 60 | 91 | -163 | 4.3 | 7.99 |
| {t,m,m,1} | 190 (180) | -86 (-79) | -80 (-79) | 15 (-7) | 3.18 (3.23) | 4.84 |
| {t,m,m,2} | -169 | -86 | -94 | 164 | 4.3 | 8.39 |
ΔErel is the gas phase conformational energies relative to the lowest energy conformation, {m,m,m,1}
Experimental inter spin distances in T4L 65V1/76V1
Figure 7 shows the 65V1/76V1 interspin distance determined from the crystal structure along with the dipolar evolution function and derived interspin distance distribution determined by DEER (also known as PELDOR) in frozen solution at 80K, close to the temperature at which the structure was determined (100K). The most probable distance (MPD) from DEER is in good agreement with the interspin distance measured from the crystal structure, supporting the view that the rotamers observed in the structure are not imposed by the lattice. The full width of the distance distribution at half maximum (FWHM) is ≈ 6.5 Å. For comparison the dipolar evolution function and distance distribution for 65R1/76R1 are included in Figure 7 as red traces. The FWHM for 65R1/76R1 is ≈ 6.6Å and the MPD is ≈ 2Å greater than for the corresponding V1 pair.
Figure 7.
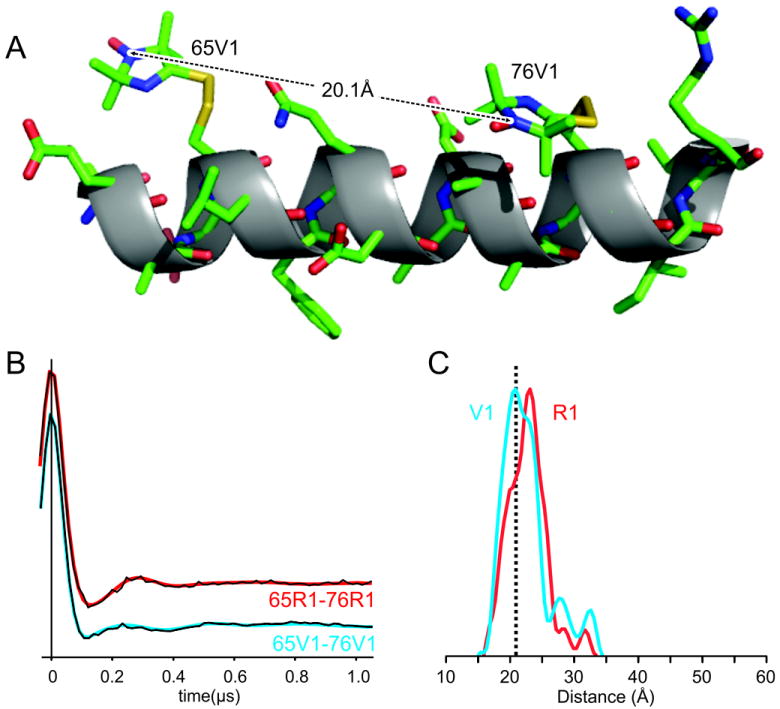
Comparison of the interspin distance in 65V1/76V1 determined from the crystal structure and DEER spectroscopy. (A) A model of the C helix containing 65V1 and 76V1, showing the interspin distance determined from the crystal structure. (B) Dipolar evolution functions and (C) derived distance distributions are shown for 65V1/76V in blue. The interspin distance from the crystal structure is shown as a vertical dotted line. For comparison, the data for 65R1/67R1 is shown in red. The best fit dipolar evolution function is overlaid in (B) using the corresponding colors.
An additional comparison between V1 and R1 is shown in Figure 8 for R1 and V1 pairs at 68/81. The MPD is ≈ 2 Å greater for R1 compared to V1. The distance probability distribution for 68R1/81R1 has multiple peaks spread over 8 Å while 68V1/81V1 forms essentially a single narrow peak with a FWHM of about 2 Å. In summary, the widths for the V1 pairs measured are less than or similar to R1 pairs, and the most probable distances are shorter. Interestingly, the measured interspin distances for 68V1/81V1 are compatible with the distance modeled using {t, p, p, -22°} rotamers of V1 at both sites (Figure 8B); the native residues at these sites have X1 in the t configuration. For each V1 double mutant, The DEER data (dipolar evolution functions) obtained at three different pump-observe separations (see Methods) could each be well fit assuming absence of orientation selection and giving the same result. The rigidity of the V1 side chain is expected to exhibit orientation selection under ideal geometric and experimental conditions and this has been observed for V1 at other sites (to be reported elsewhere), but not for the double mutants in this study.
Figure 8.
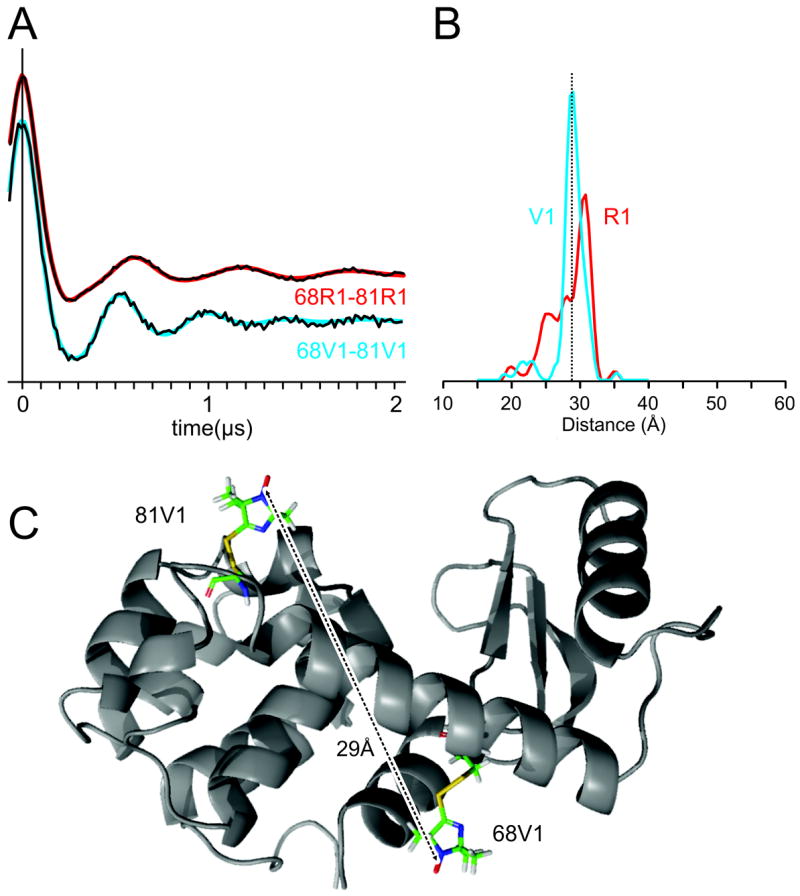
Interspin distance distributions determined from DEER for the indicated V1 labeled double mutant and comparison with R1. (A) Dipolar evolution functions and (B) derived distance distributions are shown for 68V1/81V (blue) and 68R1/81R1 (red). The best fit dipolar evolution function is overlaid in (A) using the corresponding colors. (C) T4L with V1 modeled in the {t, p, p, -22°} configuration at sites 68 and 81. The interspin distance from modeling is indicated and agrees closely with the experimental value.
The widths of the distance distributions arise from structural heterogeneity in both the side chain and the protein, and presumably reflect dynamic disorder in solution at ambient temperatures. Although V1 is more ordered than R1 at the same site, there is residual internal motion in the side chain (Fig. 4) that must contribute to the width of the interspin distance distribution. The extent of this contribution depends on the directionality of the motion relative to the interspin vector and cannot be deduced from single distances, but requires multiple distance measurements from a single site [38] in a rigid protein. T4 Lysozyme is an inherently flexible protein [56], and the interspin distance distributions in Figures 7 and 8 are likely to have contributions from protein structural heterogeneity as well. Indeed, the lack of orientational selection in the DEER data reflects some level of disorder, although it need not be large since observation of orientational effects requires highly ordered nitroxides, even with high frequency EPR where the effect is the greatest [57]. It is beyond the scope of the present study to resolve the different contributions to the distribution widths; the main point to be made that the smaller size of the rotamer library relative to R1 will simplify model-based analysis of interspin distance distributions [58].
DISCUSSION
The results presented here show that the internal motion of the disulfide-linked V1 side chain is strongly ordered, apparently as a result of intra-side chain interactions between the disulfide and main chain atoms, and between the Sγ sulfur and the N atom at the 3 position of the imidazoline ring. The high degree of internal motional order is expected to extend the dynamic range for measuring large amplitude fast backbone fluctuations.
Quantum mechanical calculations and modeling suggest that three rotamers with regard to {X1,X2,X3} should be preferred, namely {m, m, m}, {t, p, p} and {t, m, m}, and the latter two of these are observed in the crystal structure of T4L 65V1/76V1; the configuration about X4 is to optimize the N•••Sγ interaction. The fundamental interactions that determine the preferred X1 dihedral are not entirely understood, even for native side chains [59]. However, so far it has been observed that the X1 of the native residue at a given site is preserved in the R1 side chain [22]. This is also the case for two V1 structures reported here; X1 for both K65 and R76 is in the {t} configuration (Table 3). This may be the reason that the lowest energy {m, m, m} rotamer is not observed in the structures. If the “native X1 = V1 X1” rule turns out to be general it may be possible to a priori select a unique {m, m, m} rotamer for V1 by picking a helical site with a native X1 = {m} configuration, because this is apparently the preferred state (Table 4). Specification of a unique rotamer would be of great value for inter-spin distance determinations, because the existence of multiple rotamers gives unwanted complexity in attempting to relate derived distance distributions to specific structures, or to interpret widths of distributions in terms of molecular flexibility. If the native residue has X1 = {t}, only two allowed rotamers are predicted, {t, p, p} and {t, m, m}, but it is not be possible a prior to determine which is favored. Nevertheless, the highly restricted and known rotameric space of V1 will improve the interpretation of distance measurements in terms of structure. Nitroxide spin labels of the related imidazolidine class have already been employed in proteins to map local electrostatic potentials with high frequency EPR [60, 61]. Thus, spin labeled side chains containing imidazoline or imidazolidine nitroxides are valuable additions to SDSL technology.
A disulfide-linked imidazoline nitroxide side chain has constrained internal motion
The sulfur atoms interact with both the backbone and 3-nitrogen in the ring
The reduced rotameric space should simplify interpretation of inter-spin distances
Acknowledgments
We would like to thank Ned Van Eps for providing some of the early DEER data and Evan Brooks and Margaux Kreitman for preparing mutants of T4L and recording CW spectra. This study was supported by funding from NIH Grants EY005216, JSEI Vision Center Grant EY000331 and the Jules Stein Professor Endowment (WLH). We thank the UCLA-DOE X-ray Crystallography Core Facility, which is supported by DOE Grant DE-FC02-02ER63421.
Footnotes
Publisher's Disclaimer: This is a PDF file of an unedited manuscript that has been accepted for publication. As a service to our customers we are providing this early version of the manuscript. The manuscript will undergo copyediting, typesetting, and review of the resulting proof before it is published in its final citable form. Please note that during the production process errors may be discovered which could affect the content, and all legal disclaimers that apply to the journal pertain.
Reference list
- 1.Hubbell WL, Cafiso DS, Altenbach C. Identifying conformational changes with site-directed spin labeling. Nat Struct Mol Biol. 2000;7:735–739. doi: 10.1038/78956. [DOI] [PubMed] [Google Scholar]
- 2.Lopez CJ, Fleissner MR, Guo Z, Kusnetzow AK, Hubbell WL. Osmolyte perturbation reveals conformational equilibria in spin-labeled proteins. Protein Sci. 2009;18:1637–1652. doi: 10.1002/pro.180. [DOI] [PMC free article] [PubMed] [Google Scholar]
- 3.Lopez CJ, Oga S, Hubbell WL. Mapping Molecular Flexibility of Proteins with Site-Directed Spin Labeling: A Case Study of Myoglobin. Biochemistry. 2012;51:6568–6583. doi: 10.1021/bi3005686. [DOI] [PMC free article] [PubMed] [Google Scholar]
- 4.Mokdad A, Herrick DZ, Kahn AK, Andrews E, Kim M. Ligand-induced structural changes in the E. Coli ferric citrate transporter reveal modes for regulating protein-protein interactions. J Mol Biol. 2012;423:818–830. doi: 10.1016/j.jmb.2012.09.003. [DOI] [PMC free article] [PubMed] [Google Scholar]
- 5.Klare JP, Steinhoff H-J. Spin labeling EPR. Photosynth Res. 2009;102:377–390. doi: 10.1007/s11120-009-9490-7. [DOI] [PubMed] [Google Scholar]
- 6.Columbus L, Hubbell WL. A new spin on protein dynamics. Trends Biochem Sci. 2002;27:288–295. doi: 10.1016/s0968-0004(02)02095-9. [DOI] [PubMed] [Google Scholar]
- 7.Columbus L, Hubbell WL. Mapping Backbone Dynamics in Solution with Site-Directed Spin Labeling: GCN4-58 bZip Free and Bound to DNA. Biochemistry. 2004;43:7273–7287. doi: 10.1021/bi0497906. [DOI] [PubMed] [Google Scholar]
- 8.Bridges MD, Hideg K, Hubbell WL. Resolving Conformational and Rotameric Exchange in Spin-Labeled Proteins Using Saturation Recovery EPR. Appl Magn Reson. 2010;37:363–390. doi: 10.1007/s00723-009-0079-2. [DOI] [PMC free article] [PubMed] [Google Scholar]
- 9.Fleissner MR, Bridges MD, Brooks EK, Cascio D, Kálai T, Hideg K, Hubbell WL. Structure and dynamics of a conformationally constrained nitroxide side chain and applications in EPR spectroscopy. Proc Natl Acad Sci U S A. 2011;108:16241–16246. doi: 10.1073/pnas.1111420108. [DOI] [PMC free article] [PubMed] [Google Scholar]
- 10.Todd A, Crozel V, Levinthal F, Levinthal C, Hubbell WL. Site-directed mutagenesis of colicin E1 provides specific attachment sites for spin labels whose spectra are sensitive to local conformation. Proteins: Struct Funct Genet. 1989;6:294. doi: 10.1002/prot.340060312. [DOI] [PubMed] [Google Scholar]
- 11.Columbus L, Kalai T, Jeko J, Hideg K, Hubbell WL. Molecular Motion of Spin Labeled Side Chains in alpha-Helices: Analysis by Variation of Side Chain Structure. Biochemistry. 2001;40:3828–3846. doi: 10.1021/bi002645h. [DOI] [PubMed] [Google Scholar]
- 12.Fleissner MR, Brustad EM, Kalai T, Altenbach C, Cascio D, Peters FB, Hideg K, Parker S, Schultz PG, Hubbell WL. Site-directed spin labeling of a genetically encoded unnatural amino acid. Proc Natl Acad Sci U S A. 2009;106:21637–21642. doi: 10.1073/pnas.0912009106. [DOI] [PMC free article] [PubMed] [Google Scholar]
- 13.Kalai T, Fleissner MR, Jeko J, Hubbell WL, Hideg K. Synthesis of new spin labels for Cu-free click conjugation. Tetrahedron Lett. 2011;52:2747–2749. [Google Scholar]
- 14.Mchaourab HS, Lietzow MA, Hideg K, Hubbell WL. Motion of Spin-Labeled Side Chains in T4 Lysozyme. Correlation with Protein Structure and Dynamics. Biochemistry. 1996;35:7692–7704. doi: 10.1021/bi960482k. [DOI] [PubMed] [Google Scholar]
- 15.Langen R, Oh KJ, Cascio D, Hubbell WL. Crystal Structures of Spin Labeled T4 Lysozyme Mutants: Implications for the Interpretation of EPR Spectra in Terms of Structure. Biochemistry. 2000;39:8396–8405. doi: 10.1021/bi000604f. [DOI] [PubMed] [Google Scholar]
- 16.Guo Z, Cascio D, Hideg K, Kalai T, Hubbell WL. Structural determinants of nitroxide motion in spin-labeled proteins: Tertiary contact and solvent-inaccessible sites in helix G of T4 lysozyme. Protein Sci. 2007;16:1069–1086. doi: 10.1110/ps.062739107. [DOI] [PMC free article] [PubMed] [Google Scholar]
- 17.Guo Z, Cascio D, Hideg K, Hubbell WL. Structural determinants of nitroxide motion in spin-labeled proteins: Solvent-exposed sites in helix B of T4 lysozyme. Protein Sci. 2008;17:228–239. doi: 10.1110/ps.073174008. [DOI] [PMC free article] [PubMed] [Google Scholar]
- 18.Fleissner MR, Cascio D, Hubbell WL. Structural origin of weakly ordered nitroxide motion in spin-labeled proteins. Protein Sci. 2009;18:893–908. doi: 10.1002/pro.96. [DOI] [PMC free article] [PubMed] [Google Scholar]
- 19.Barnes JP, Liang Z, Mchaourab HS, Freed JH, Hubbell WL. Multifrequency Electron Spin Resonance Study of T4 Lysozyme Dynamics. Biophys J. 1999;76:3298–3306. doi: 10.1016/S0006-3495(99)77482-5. [DOI] [PMC free article] [PubMed] [Google Scholar]
- 20.Zhang Z, Fleissner MR, Tipikin DS, Liang Z, Moscicki JK, Earle KA, Hubbell WL, Freed JH. A Multifrequency ESR Study of the Dynamics of Spin-Labeled T4 Lysozyme. J Phys Chem B. 2010;114:5503–5521. doi: 10.1021/jp910606h. [DOI] [PMC free article] [PubMed] [Google Scholar]
- 21.Nesmelov YE, Thomas DD. Protein structure and dynamics revealed by site directed spin labeling and multifrequency EPR. Biophys Rev. 2010;2:91–99. doi: 10.1007/s12551-010-0032-5. [DOI] [PMC free article] [PubMed] [Google Scholar]
- 22.Cunningham TM, McGoff MS, Sengupta I, Jaroniec CP, Horne SW, Saxena S. High-Resolution Structure of a Protein Spin-Label in a Solvent-Exposed β-Sheet and Comparison with DEER Spectroscopy. Biochemistry. 2012;51:6350–6359. doi: 10.1021/bi300328w. [DOI] [PubMed] [Google Scholar]
- 23.Freed DM, Khan AK, Horanyi PS, Cafiso DS. Molecular Origin of Electron Paramagnetic Resonance Line Shapes on β-Barrel Membrane Proteins: The Local Solvation Environment Modulates Spin-Label Configuration. Biochemistry. 2011;50:8792–8803. doi: 10.1021/bi200971x. [DOI] [PMC free article] [PubMed] [Google Scholar]
- 24.Kroncke BM, Horanyi PS, Columbus L. Structural origins of nitroxide side chain dynamics on membrane protein α-helical sites. Biochemistry. 2010;49:10045–10060. doi: 10.1021/bi101148w. [DOI] [PMC free article] [PubMed] [Google Scholar]
- 25.Toledo Warshaviak D, Serbulea L, Houk KN, Hubbell WL. Conformational Analysis of a Nitroxide Side Chain in an α-Helix with Density Functional Theory. J Phys Chem B. 2011;115:397–405. doi: 10.1021/jp108871m. [DOI] [PMC free article] [PubMed] [Google Scholar]
- 26.Fawzi NL, Fleissner MR, Anthis NJ, Kalai T, Hideg K, Hubbell WL, Clore GM. A rigid disulfide-linked nitroxide side chain simplifies the quantitative analysis of PRE data. J Biomol NMR. 2011;51:105–114. doi: 10.1007/s10858-011-9545-x. [DOI] [PMC free article] [PubMed] [Google Scholar]
- 27.Toniolo C, Valente E, Formaggio F, Crisma M, Pilloni G, Corvaja C, Toffoletti A, Martinez GV, Hanson MP, Millhauser GL, George C, Fillipen-Anderson JL. Synthesis and conformational studies of peptides containing TOAC, a spin-labelled C alpha, alpha-disubstituted glycine. J Pept Sci. 1995;1:45–57. doi: 10.1002/psc.310010107. [DOI] [PubMed] [Google Scholar]
- 28.Anderson LL, Marshall GR, Baranski TJ. Expressed protein ligation to study protein interactions: semi-synthesis of the G-protein alpha subunit. Protein Pept Lett. 2005;12:783–787. doi: 10.2174/0929866054864175. [DOI] [PubMed] [Google Scholar]
- 29.Marsh DJ. Orientation of TOAC amino-acid spin labels in alpha-helices and beta-strands. J Magn Reson. 2006;180:305–310. doi: 10.1016/j.jmr.2006.02.007. [DOI] [PubMed] [Google Scholar]
- 30.Nesmelov YE, Karim CB, Song L, Fajer PG, Thomas DD. Rotational dynamics of phospholamban determined by multifrequencyelectron paramagnetic resonance. Biophys J. 2007;93:2805–2812. doi: 10.1529/biophysj.107.108910. [DOI] [PMC free article] [PubMed] [Google Scholar]
- 31.Van Eps N, Anderson LL, Kisselev OG, Baranski TJ, Hubbell WL, Marshall GR. Electron Paramagnetic Resonance Studies of Functionally Active, Nitroxide Spin-Labeled Peptide Analogues of the C-Terminus of a G-Protein α Subunit. Biochemistry. 2010;49:6877–6886. doi: 10.1021/bi100846c. [DOI] [PMC free article] [PubMed] [Google Scholar]
- 32.Rabenstein MD, Shin YK. Determination of the distance between two spin labels attached to a macromolecule. Proc Natl Acad Sci U S A. 1995;92:8239–8243. doi: 10.1073/pnas.92.18.8239. [DOI] [PMC free article] [PubMed] [Google Scholar]
- 33.Altenbach C, Oh KJ, Trabanino RJ, Hideg K, Hubbell WL. Estimation of inter-residue distances in spin labeled proteins at physiological temperatures: experimental strategies and practical limitations. Biochemistry. 2001;40:15471–15482. doi: 10.1021/bi011544w. [DOI] [PubMed] [Google Scholar]
- 34.Jeschke G. Distance measurements in the nanometer range by pulse EPR. Chemphyschem. 2002;3:927–932. doi: 10.1002/1439-7641(20021115)3:11<927::AID-CPHC927>3.0.CO;2-Q. [DOI] [PubMed] [Google Scholar]
- 35.Schiemann O, Prisner TF. Long-range distance determinations in biomolecules by EPR spectroscopy. Quart Rev Biophys. 2007;40:1–53. doi: 10.1017/S003358350700460X. [DOI] [PubMed] [Google Scholar]
- 36.Khramtsov VV, Yelinova VI, Weiner LM, Berezina TA, Martin VV, Volodarsky LB. Quantitative determination of SH groups in low- and high-molecular-weight compounds by an electron spin resonance method. Anal Biochem. 1989;182:58–63. doi: 10.1016/0003-2697(89)90718-5. [DOI] [PubMed] [Google Scholar]
- 37.Budil DE, Lee S, Saxena S, Freed JH. Nonlinear least-squares analysis of slow motional EPR spectra in one and two dimensions using a modified Levenberg-Marquardt Algorithm. J Magn Reson A. 1996;120:155–189. [Google Scholar]
- 38.Altenbach C, Kusnetzow AK, Ernst OP, Hofmann KP, Hubbell WL. High-resolution distance mapping in rhodopsin reveals the pattern of helix movement due to activation. Proc Natl Acad Sci U S A. 105:7439–7444. doi: 10.1073/pnas.0802515105. [DOI] [PMC free article] [PubMed] [Google Scholar]
- 39.Otwinowski Z, Minor W. Processing of X-ray diffraction data collected in oscillation mode. Methods Enzymol. 1996;276:307–326. doi: 10.1016/S0076-6879(97)76066-X. [DOI] [PubMed] [Google Scholar]
- 40.Weaver LH, Matthews BW. Structure of bacteriophage T4 lysozyme refined at 1.7 Å resolution. J Mol Biol. 1987;193:189–199. doi: 10.1016/0022-2836(87)90636-x. [DOI] [PubMed] [Google Scholar]
- 41.McCoy AJ, Grosse-Kunstleve RW, Adams PD, Winn MD, Storoni LC, Read RJ. Phaser crystallographic software. J Appl Crystallogr. 2007;40:658–674. doi: 10.1107/S0021889807021206. [DOI] [PMC free article] [PubMed] [Google Scholar]
- 42.Quillin ML, Breyer WA, Griswold IJ, Matthews BW. Size versus polarizability in protein-ligand interactions: binding of noble gases within engineered cavities in phage T4 lysozyme. J Mol Biol. 2000;302:955–977. doi: 10.1006/jmbi.2000.4063. [DOI] [PubMed] [Google Scholar]
- 43.Murshudov GN, Vagin AA, Dodson EJ. Refinement of Macromolecular Structures by the Maximum-Likelihood Method. Acta Crystallogr D Biol Crystallogr. 1997;53:240–255. doi: 10.1107/S0907444996012255. [DOI] [PubMed] [Google Scholar]
- 44.Adams PD, Grosse-Kunstleve RW, Hung L, Ioerger TR, McCoy AJ, Moriarty NW, Read RJ, Sacchettini JC, Sauter NK, Terwilliger TC. PHENIX: building new software for automated crystallographic structure determination. Acta Crystallogr D Biol Crystallogr. 2002;58:1948–1954. doi: 10.1107/s0907444902016657. [DOI] [PubMed] [Google Scholar]
- 45.Emsley P, Cowtan K. Coot: model-building tools for molecular graphics. Acta Crystallogr D Biol Crystallogr. 2004;60:2126–2132. doi: 10.1107/S0907444904019158. [DOI] [PubMed] [Google Scholar]
- 46.Laskowski RA, MacArthur MW, Moss DS, Thornton JM. PROCHECK: a program to check the stereochemical quality of protein structures. J Appl Crystallogr. 1993;26:283–291. [Google Scholar]
- 47.Colovos C, Yeates TO. Verification of protein structures: Patterns of nonbonded atomic interactions. Protein Sci. 1993;2:1511–1519. doi: 10.1002/pro.5560020916. [DOI] [PMC free article] [PubMed] [Google Scholar]
- 48.Hooft RW, Vriend G, Sander C, Abola EE. Errors in protein structures. Nature. 1996;381:272. doi: 10.1038/381272a0. [DOI] [PubMed] [Google Scholar]
- 49.Weiner LM. Quantitative determination of thiol groups in low and high molecular weight compounds by electron paramagnetic resonance. Methods Enzymol. 1995;251:87–105. doi: 10.1016/0076-6879(95)51113-x. [DOI] [PubMed] [Google Scholar]
- 50.Khramtsov VV, Yelinova VI, Glazachev YI, Reznikov VA, Zimmer G. Quantitative determination and reversible modification of thiols using imidazolidine biradical disulfide label. J Biochem Biophys Methods. 1997;35:115–128. doi: 10.1016/s0165-022x(97)00035-3. [DOI] [PubMed] [Google Scholar]
- 51.Khramtsov VV, Grigor’ev IA, Foster MA, Lurie DJ. In Vitro and In Vivo Measurement of pH and Thiols by EPR-Based Techniques. Antioxid Redox Signaling. 2004;6:667–676. doi: 10.1089/152308604773934431. [DOI] [PubMed] [Google Scholar]
- 52.Elguero J, Marzlin C, Katritzky AR, Linda P. Tautomerism of Heterocycles. Academic Press; New York: 1976. [Google Scholar]
- 53.Lovell SC, Word JM, Richardson JS, Richardson DC. The penultimate rotamer library. Proteins: Struct Func and Bioinf. 2000;40:389–408. [PubMed] [Google Scholar]
- 54.Gainza P, Roberts KE, Donald BR. Protein design using continuous rotamers. PloS Comput Biol. 2012 doi: 10.1371/journal.pcbi.1002335. [DOI] [PMC free article] [PubMed] [Google Scholar]
- 55.Fraser RR, Boussard G, Saunders JK, Lambert JB, Mixan CE. Barriers to rotation about the sulfur-sulfur bond in acyclic disulfides. J Am Chem Soc. 1971;93:3822–3823. [Google Scholar]
- 56.Faber HR, Matthews BW. A mutant T4 lysozyme displays five different crystal conformations. Nature. 1990;348:263–266. doi: 10.1038/348263a0. [DOI] [PubMed] [Google Scholar]
- 57.Song L, Larion M, Chamoun J, Bonora M, Fajer PG. Distance and dynamics determination by W-band DEER and W-band ST-EPR. Eur Biophys J. 2010;39:711–719. doi: 10.1007/s00249-009-0565-3. [DOI] [PubMed] [Google Scholar]
- 58.Polyhach Y, Bordignon E, Jeschke G. Rotamer libraries of spin-labelled cysteins for protein studies. PCCP. 2011;13:2356–2366. doi: 10.1039/c0cp01865a. [DOI] [PubMed] [Google Scholar]
- 59.Renfrew PD, Butterfoss G, Kuhlman B. Using Quantum Mechanics to improve estimates of amino acid side chain rotamer energies. Proteins. 2008;71:1637–1646. doi: 10.1002/prot.21845. [DOI] [PMC free article] [PubMed] [Google Scholar]
- 60.Smirnov PI, Ruuge A, Reznikov VA, Voinov MA, Grigor’ev IA. Site-directed electrostatic measurements with a thiol-specific pH-sensitive nitroxide: Differentiating local pK and polarity effects by high-field EPR. J Am Chem Soc. 2004;126:8872–8873. doi: 10.1021/ja048801f. [DOI] [PubMed] [Google Scholar]
- 61.Möbius K, Savitsky A, Wegener C, Plato M, Fuchs M, Schnegg A, Dubinskii AA, Grishin YA, Grigor’ev IA, Kühn M, Duché D, Zimmermann H, Steinhoff H-J. Combining high-field EPR with site-directed spin labeling reveals unique information on proteins in action. Magn Reson Chem. 2005;43:S4–S19. doi: 10.1002/mrc.1690. [DOI] [PubMed] [Google Scholar]