

Abstract
Objective
To assess whether changes in total and regional adiposity affect the odds for becoming hypercholesterolemic.
Methods and Procedures
Changes in BMI and waist circumference were compared to self-reported physician-diagnosed hypercholesterolemia in 24,397 men and 10,023 women followed prospectively in the National Runners’ Health Study.
Results
Incident hypercholesterolemias were reported by 3,054 men and 519 women during (mean ± s.d.) 7.8 ± 1.8 and 7.5 ± 2.0 years of follow-up, respectively. Despite being active, men’s BMI increased by 1.15 ± 1.71 kg/m2 and women’s BMI increased by 0.96 ± 1.89 kg/m2. The odds for developing hypercholesterolemia increased significantly in association with gains in BMI and waist circumferences in both sexes. A gain in BMI ≥2.4 kg/m2 significantly (P < 0.0001) increased the odds for hypercholesterolemia by 94% in men and 129% in women compared to those whose BMI declined (40 and 76%, respectively, adjusted for average of the baseline and follow-up BMI, P < 0.0001). A gain of ≥6 cm in waist circumference increased men’s odds for hypercholesterolemia by 74% (P < 0.0001) and women’s odds by 70% (P < 0.0001) relative to those whose circumference declined (odds increased 40% at P < 0.0001 and 49% at P < 0.01, respectively adjusted for average circumference). BMI and waist circumference at the end of follow-up were significantly associated (P < 0.0001) with the log odds for hypercholesterolemia in both men (e.g., coefficient ± s.e.: 0.115 ± 0.011 per kg/m2) and women (e.g., 0.119 ± 0.019 per kg/m2) when adjusted for baseline values, whereas baseline BMI and circumferences were unrelated to the log odds when adjusted for follow-up values.
Discussion
These observations are consistent with the hypothesis that weight gain acutely increases the risk for hypercholesterolemia.
Introduction
The Third National Cholesterol Education Program specifically recommends weight management for preventing hypercholesterolemia (1). Whereas randomized controlled clinical trials show that weight loss causes cholesterol lowering (2), evidence linking weight gain to increased cholesterol is derived primarily from cross-sectional associations, longitudinal studies of concurrent weight and cholesterol increases (3–15), and prospective epidemiological studies (16). Several longitudinal studies report that changes in weight have greater effect on cholesterol levels in men than in women (7,10,11), while others report a greater effect in women (13), or no difference (9). The effects of changing body weight on plasma cholesterol concentrations may also vary with level of adiposity, as some studies suggest greater increases with weight gain among nonobese than obese men and women (7,10).
The purpose of this study was to assess the relationship of long-term changes in adiposity as measured by BMI and waist circumference to the odds of becoming hypercholesterolemic among a vigorously active and generally lean population of men and women in whom the risk of developing high cholesterol may appear remote. Several simple combinations of the baseline and follow-up BMI are used to characterize their relationship to incident high cholesterol. The results are consistent with the hypothesis that weight gain acutely increases the risk of hypercholesterolemia.
Methods and procedures
The survey instruments and baseline characteristics of the National Runners’ Health Survey are described elsewhere (14,17–21). In brief, a two-page questionnaire, distributed nationally at races and to subscribers of a popular running magazine (Runners’ World, Emmaus, PA), solicited information on demographics, running history, weight history, smoking habits, prior history of heart attacks and cancer, and medications for blood pressure, thyroid conditions, high cholesterol, and diabetes. Recruitment took place between 1991 and 1994 (primarily 1993) and follow-up between 1999 and 2002. All applicable institutional and governmental regulations regarding the ethical use of human volunteers were followed. The study protocol was approved by the University of California Committee for the Protection of Human Subjects, and all participants signed committee-approved informed consents.
BMI was calculated as weight in kilograms divided by the square of height in meters. Self-reported waist circumferences were elicited by the question, “Please provide, to the best of your ability, your body circumference in inches.” without further instruction. Elsewhere, we have reported the strong correlations between self-reported and clinically measured heights (r = 0.96) and weights (r = 0.96), and self-reported BMIs in relation to other variables (14,17–21). Self-reported waist circumferences are somewhat less precise, as indicated by their correlations with reported circumferences on a second questionnaire (r = 0.84) and with their clinical measurements (r = 0.68) (ref. 21). Imprecision in these self-reported values will attenuate the significance of their association with hypercholesterolemia, and the resulting estimates will underestimate the magnitude of the true relationships (22). Physical activity was reported as distance run per week. Eighty percent of the 54,956 participants of the National Runners’ Health Study provided follow-up information or were known deceased.
Participants reported whether a physician had told them they had high cholesterol since their baseline questionnaire, and whether they took medications for high cholesterol at baseline or follow-up. Incident hypercholesterolemia is defined as physician diagnosis or starting medications for this condition subsequent to their baseline questionnaire. Others have shown that self-reported high cholesterol is confirmed by medical records in 85.7% of self-reports (23).
Statistics
We used logistic regression analysis to test whether changes in BMIs and waist circumferences were related to incident high cholesterol. The results are presented with and without adjustment for the average of the baseline and follow-up values, and with and without adjustment for physical activity. All results (except the descriptive results of Table 1) include adjustment for the average age during follow-up (age and age2), follow-up duration, exercise level (baseline and follow-up), and the average weekly intakes of alcohol, meat, fish, and fruit at baseline and follow-up. If “P” represents the proportion of diagnosed hypercholesterolemias, then the odds are computed as P/(1 − P). Logistic regression fits the coefficients for the linear equation “ln(P/(1−P)) = α + β1x1 + β2x2 + …, where x1, x2, … are the independent variables and α, β1, β2, ,.. coefficients of the tables, the figures provide the odds ratios to describe the relationship between hypercholesterolemia and categories of BMI and waist circumference. Logistic regression analysis was used to estimate the log odds for hypercholesterolemia for five BMI intervals: <20, 20–22.5, 22.5–25, 25–27.5, and ≥27.5 kg/m2 by postulating a linear change in BMI between baseline and end of follow-up. These analyses assume that an individual’s log odds of being diagnosed for high cholesterol is proportional to their exposure to the starting, ending, and intermediate BMI categories, where the proportions are the contribution of each category to a person’s total ΔBMI. For example, the log odds for a person whose BMI changed from 22 to 27 kg/m2 is 10% of the log odds for the 20–22.5 kg/m2 interval, 50% of the log odds for the 22.5–25 kg/m2 interval, and 40% of the log odds for the 25–27.5 kg/m2 interval. (Computationally, the contribution of the jth BMI interval, j = 1.5, to the total log odds of individual i, i = 1…N was “0” if the BMI interval does not occur between the individual’s baseline and end of follow-up BMI, “1” if the participant’s baseline and end of follow up BMIs both fell within the interval, and was calculated by the formula (minimum(bj − minimum (ci, di),|di−ci|) − maximum(aj − minimum (ci, di), 0)/(|di−ci|) if either the baseline or end of follow-up did, where aj is the lower and bj was the upper limits of the jth BMI interval, and ci is the baseline and di is the end of follow-up BMI of participanti.)
Table 1.
Sample characteristics by change in BMI
| ΔBMI (kg/m2) | ||||||
|---|---|---|---|---|---|---|
| <0 | 0.0–0.79 | 0.80–1.59 | 1.60–2.39 | ≥2.40 | Significance | |
| Men | ||||||
| Sample (n) | 6,303 | 5,740 | 5,085 | 3,113 | 4,156 | |
| Incidence | 673 (10.68%) | 597 (10.40%) | 604 (11.88%) | 472 (15.16%) | 708 (17.04%) | <0.0001 |
| Follow-up duration (years) | 7.41 ±1.86 | 7.52 ±1.81 | 7.82 ±1.71 | 8.13 ±1.65 | 8.60 ±1.63 | <0.0001 |
| Average age (years) | 50.26 ±10.73 | 49.11 ±10.24 | 47.77 ±9.68 | 46.97 ±9.28 | 44.34 ±9.48 | <0.0001 |
| Average BMI (kg/m2) | 23.75 ±2.63 | 23.60 ±2.28 | 24.20 ±2.37 | 24.91 ±2.45 | 26.45 ±3.06 | <0.0001 |
| Average physical activity (km/week) | 33.90 ±21.14 | 34.39 ±20.93 | 32.60 ±19.66 | 29.98 ±18.33 | 26.17 ±16.6 | <0.0001 |
| ΔPhysical activity (km/week) | −5.09 ±20.43 | −9.22 ±19.41 | −12.20 ±19.62 | −16.38 ±20.12 | −23.36 ±22.15 | <0.0001 |
| Average meat (servings/week) | 2.81 ±3.22 | 2.85 ±3.07 | 3.02 ±3.29 | 3.09 ±3.45 | 3.23 ±3.60 | <0.0001 |
| Average fish (servings/week) | 1.61 ±1.32 | 1.58 ±1.24 | 1.56 ±1.37 | 1.51 ±1.32 | 1.48 ±1.23 | <0.0001 |
| Average fruit (pieces/week) | 11.60 ±8.23 | 11.30 ±7.88 | 10.48 ±7.26 | 9.84 ±7.07 | 9.09 ±6.53 | <0.0001 |
| Average alcohol (ml/week) | 87.65 ±109.85 | 84.53 ±104.77 | 86.81 ±104.81 | 85.05 ±103.37 | 80.75 ±108.47 | 0.0007 |
| Women | ||||||
| Sample (n) | 3,333 | 2,166 | 1,971 | 1,098 | 1,455 | |
| Incidence | 135 (4.05) | 70 (3.23) | 107 (5.43) | 71 (6.47) | 136 (9.35) | <0.0001 |
| Follow-up duration (years) | 7.30 ±2.04 | 7.28 ±2.11 | 7.64 ±1.95 | 7.80 ±1.99 | 8.20 ±1.85 | <0.0001 |
| Average age (years) | 42.15 ±10.22 | 42.70 ±9.74 | 41.52 ±9.39 | 41.72 ±9.39 | 41.66 ±9.17 | 0.007 |
| Average BMI (kg/m2) | 21.16 ±2.31 | 20.82 ±1.93 | 21.34 ±2.01 | 22.16 ±2.23 | 24.40 ±3.20 | <0.0001 |
| Average physical activity (km/week) | 33.11 ±20.13 | 33.60 ±19.2 | 31.02 ±18.64 | 28.19 ±17. | 27 22.85 ±16.21 | <0.0001 |
| ΔPhysical activity (km/week) | −6.97 ±21.2 | −8.44 ±19.47 | −11.04 ±19.96 | −13.34 ±19.28 | −18.95 ±20.48 | <0.0001 |
| Average meat (servings/week) | 1.28 ±1.64 | 1.33 ±1.67 | 1.40 ±1.79 | 1.46 ±2.06 | 1.52 ±1.76 | <0.0001 |
| Average fish (servings/week) | 1.36 ±1.26 | 1.34 ±1.14 | 1.34 ±1.28 | 1.25 ±1.02 | 1.37 ±1.17 | 0.32 |
| Average fruit (pieces/week) | 11.69 ±7.53 | 11.50 ±6.76 | 11.12 ±6.58 | 10.55 ±6.33 | 10.19 ±6.42 | <0.0001 |
| Average alcohol (ml/week) | 54.19 ±70. 34 | 54.43 ±68.15 | 54.37 ±69.09 | 50.53 ±69.32 | 50.15 ±72.58 | 0.03 |
Means ± s.d. except for incidence, which is the count (percent). Significance refers to the relationship of the variable to ΔBMI as a continuous value.
Results
There were 24,397 nonsmoking men and 10,023 nonsmoking women with complete data on height and body weight at baseline and the end of follow-up who were not strict vegetarians and who did not report using cholesterol lowering or diabetic medications at baseline. Table 1 displays their characteristics by their change in BMI between the baseline and the end of follow- up surveys (ΔBMI). Compared to those who lost weight, the unadjusted data show that those who gained ≥2.4 kg/m2 were 60% more likely to become hypercholesterolemic if male and twice as likely to become hypercholesterolemic if female. In addition, those who gained more weight during follow-up were younger and less active, ate more meat and less fruit, consumed less alcohol and had greater decreases in running distance. Men who reported consuming less fish also tended to gain weight. Longer follow-up was, as expected, associated with greater weight gain. At the end of the follow-up, most of the sample was still relatively lean, 85% of the women and 90% of the men had waist circumferences below guideline levels (women <88 cm, men <102 cm), and 86% of the women and 55% of the men fell within the definition of healthy weight (BMI ≤ 25 kg/m2).
Figure 1 displays the associations of BMI and waist circumference to the odds for developing hypercholesterolemia during follow-up. The solid black bars assume that the log odds are determined by the person’s proportional exposure to each BMI category during follow-up (see Methods and Procedures). For both sexes, the graphs show that the odds increased linearly with increasing BMI. Compared to the leanest men (BMI < 20 kg/m2), the odds were significantly greater for all heavier categories. The men’s odds also increased linearly with their waist circumferences, although not as much as with their BMIs. Significantly higher odds were observed for circumferences ≥78 vis-a`-vis <78 cm. In women, the odds were significantly greater for ≥70 vis-a`-vis <62 cm (i.e., compared to <62 cm, not significant for 62 ≤ waist < 66, and 66 ≤ waist < 70 cm, but significant for 70 ≤ waist < 74, and 74 ≤ waist cm). Comparing the odds for proportional exposure to the odds based on baseline BMI or waist circumference alone illustrates the effect of the follow-up weight change on the calculated odds. Although baseline BMI and baseline waist circumferences predicted greater odds for becoming hypercholesterolemic, the odds ratios were less than those calculated from proportional exposure. In this and all subsequent tables and figures, the results were only modestly affected by statistical adjustment for physical activity (km/week run).
Figure 1.
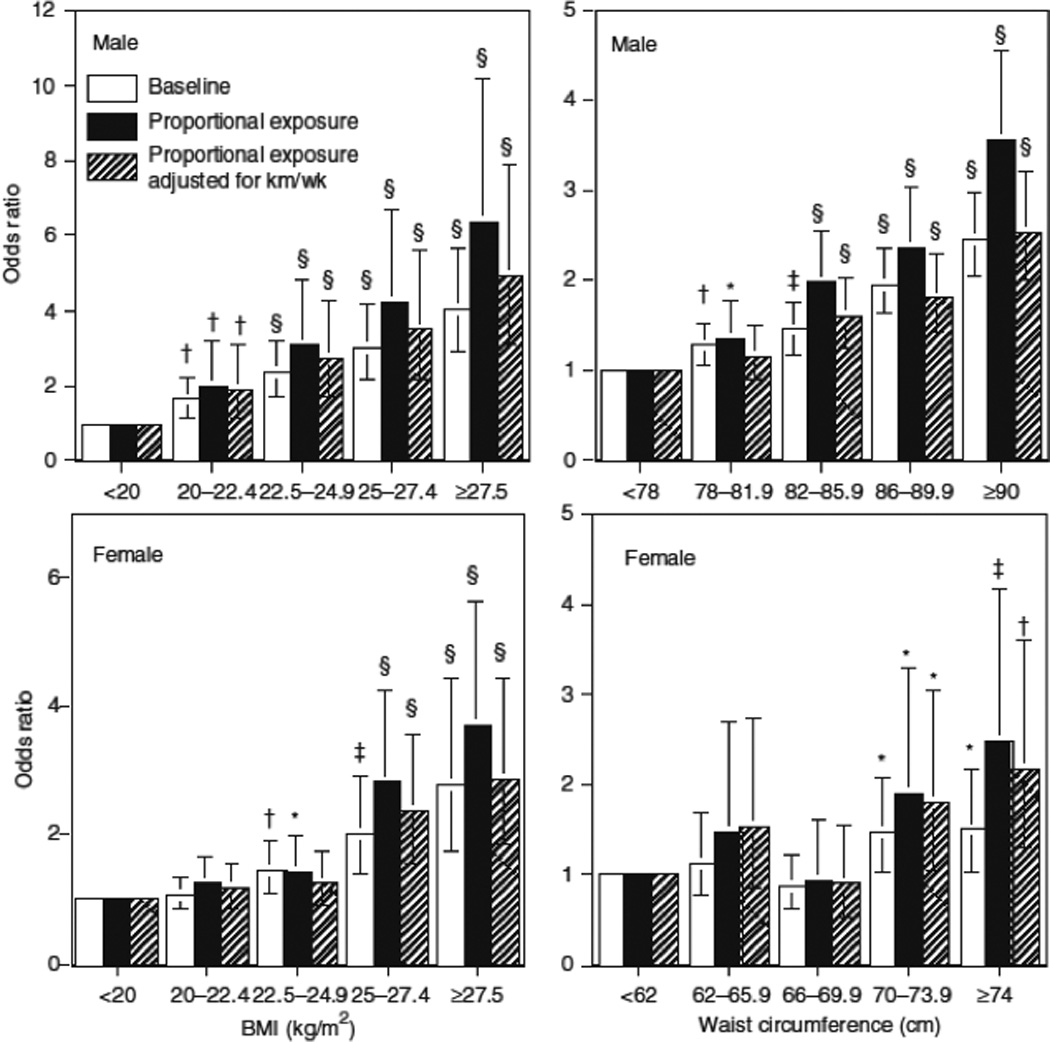
Relationships of the odds of incident hypercholesterolemia by BMI and waist circumference at baseline and in relation to the individual’s proportional exposure to the BMI and waist circumference during follow-up (see Methods and Procedures) in 24,397 men and 10,023 women. Results adjusted to the mean age, follow-up duration, and reported intakes of meat, fish, fruit, and alcohol. Additional adjustment for physical activity (km/week of running) at baseline and follow-up where indicated. Brackets define 95% confidence intervals. Significance levels are coded *P < 0.05; †P < 0.01; ‡P < 0.001; §P < 0.0001
Table 2 presents the logistic regression coefficients for ΔBMI and Δwaist circumference. Greater increases in BMI during follow-up predicted greater odds for becoming hypercholesterolemic. When adjusted for the BMIaverage (i.e., (BMIbaseline + BMIfollow-up)/2) the men’s coefficient for ΔBMI was reduced by about one-half and the women’s by >40%, but both remained statistically significant. Greater Δwaist circumferences in both sexes were associated with greater odds for incident hypercholesterolemia.
Table 2.
Logistic regression analyses of incident hypercholesterolemia vs. changes in BMI and body dimensions.
| Unadjusted for average | Adjusted for average | |||
|---|---|---|---|---|
| Physical activity adjustment |
None | Adjusted | None | Adjusted |
| Men | ||||
| Intercept | −2.076 | −2.076 | −4.730 | −4.202 |
| ΔBMI (kg/m2) | 0.130±0.011† | 0.108±0.012† | 0.060±0.012† | 0.055±0.013† |
| Average BMI (kg/m2) | 0.110±0.007† | 0.088±0.008† | ||
| Intercept | −2.019 | −2.029 | −5.970 | −5.041 |
| ΔWaist (cm) | 0.036±0.004† | 0.029±0.004† | 0.015±0.004*** | 0.014±0.004*** |
| Average waist (cm) | 0.046±0.003† | 0.035±0.004† | ||
| Women | ||||
| Intercept | −3.322 | −3.337 | −5.009 | −4.620 |
| ΔBMI (kg/m2) | 0.136±0.019† | 0.117±0.019† | 0.079±0.022*** | 0.077±0.022*** |
| Average BMI (kg/m2) | 0.079±0.017† | 0.060±0.018*** | ||
| Intercept | 3.280 | 3.303 | 5.662 | 5.116 |
| ΔWaist (cm) | 0.034±0.007† | 0.029±0.007† | 0.020±0.007** | 0.019±0.007** |
| Average waist (cm) | 0.034±0.007† | 0.026±0.007*** | ||
“Adjusted for average” means adjusted for the average of the baseline and follow-up BMI or waist circumference. The intercept term includes the adjustment to the mean age, follow-up duration, and reported intakes of meat, fish, fruit, and alcohol. Additional adjustment for physical activity (km/week) where indicated. Significance levels for logistic regression coefficients are coded
P <0.05,
P <0.01,
P <0.001,
P < 0.0001.
Figure 2 displays the odds for becoming hypercholesterolemic in relation to ΔBMI and Δwaist circumference. As in Table 2, the odds ratios were reduced when adjusted for BMIaverage or average waist circumference. Nevertheless, an increase in BMI of >1.6 kg/m2 significantly increased the odds for becoming hypercholesterolemic relative to those who lost weight. Adding ≥4 cm to men’s waist or ≥6 cm to women’s waist also significantly increased the odds ratio relative to no increase.
Figure 2.
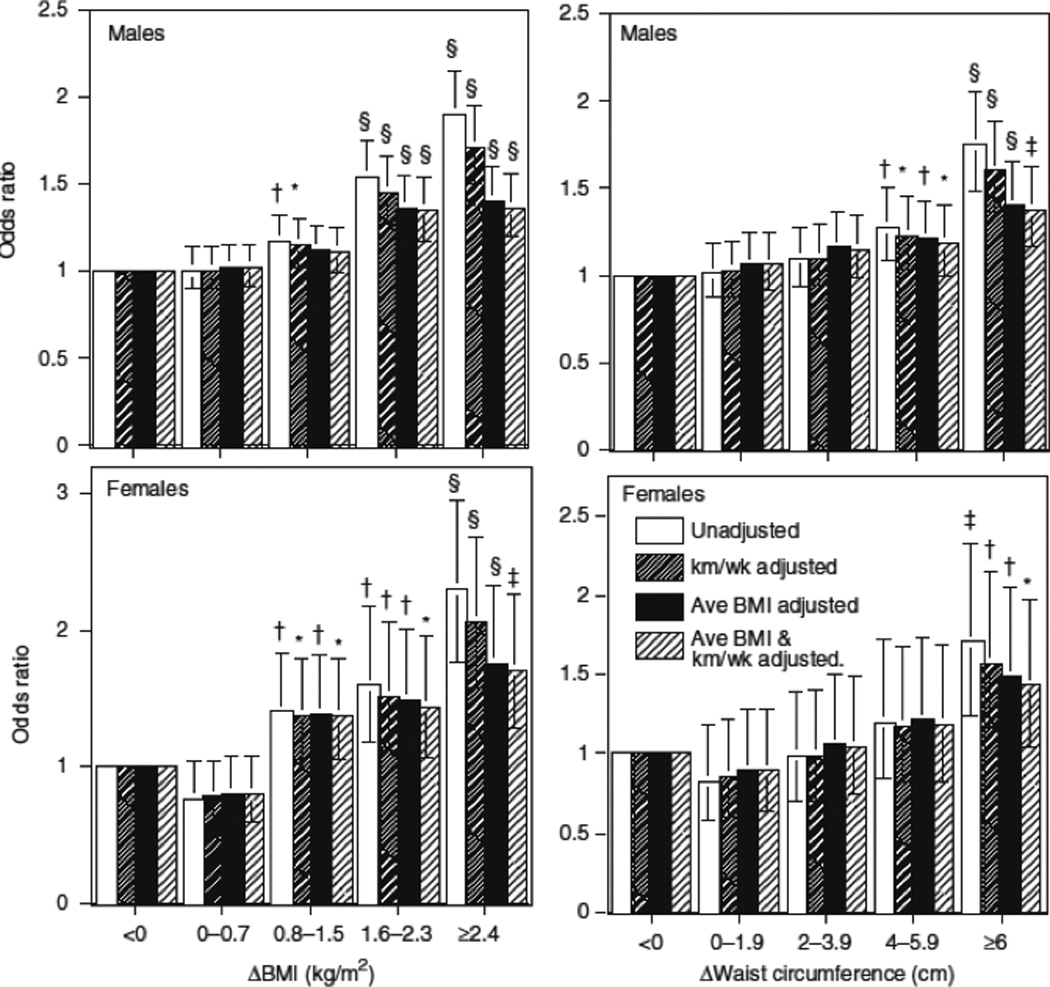
Relationships of the odds of incident hypercholesterolemia by ΔBMI and Δwaist during follow-up (see Methods and Procedures) in 24,397 men and 10,023 women. Results adjusted to the mean age, follow-up duration, and reported intakes of meat, fish, fruit, and alcohol. Additional adjustment for physical activity (km/week of running) and average BMI or waist circumference at baseline and follow-up are indicated (i.e., (BMIbaseline+BMIfollow-up)/2). Brackets define 95% confidence intervals. Significance levels are coded *P < 0.05; †P < 0.01; ‡P < 0.001; §P < 0.0001.
Table 3 estimates the separate effects of the baseline and the end of follow-up BMI and body dimensions on the log odds for developing hypercholesterolemia. These analyses show that the log odds were significantly related to BMI and body size at the end of follow-up when adjusted for baseline, but not to baseline values when adjusted for follow-up.
Table 3.
Logistic regression analyses of incident hypercholesterolemia vs. baseline and follow-up BMI and body dimensions.
| Unadjusted for average | Adjusted for average | |||
|---|---|---|---|---|
| Physical activity adjustment |
Physical activity |
Intercept | Logistic regression coefficients ± s.e. |
|
| Baseline | Follow-up | |||
| Males | ||||
| BMI (kg/m2) | Unadjusted | −4.730 | −0.005 ± 0.014 | 0.115±0.011† |
| Adjusted | −4.202 | −0.011 ±0.014 | 0.099±0.012† | |
| Waist circumference (cm) | Unadjusted | −5.970 | 0.008±0.005 | 0.038±0.004† |
| Adjusted | −5.041 | 0.003±0.005 | 0.032±0.004† | |
| Females | ||||
| BMI (kg/m2) | Unadjusted | −5.009 | −0.040±0.027 | 0.119±0.019† |
| Adjusted | −4.620 | −0.047±0.028 | 0.107±0.019† | |
| Waist circumference (cm) | Unadjusted | −5.662 | −0.003±0.009 | 0.038±0.006† |
| Adjusted | −5.116 | −0.006±0.009 | 0.032±0.007† | |
The intercept term includes the adjustment to the mean age, follow-up duration, and reported intakes of meat, fish, fruit, and alcohol. Additional adjustment for physical activity (average km/week and Δkm/week) where indicated. Significance levels for logistic regression coefficients are coded
P < 0.05,
P < 0.01,
P < 0.001,
P < 0.0001.
Discussion
An earlier paper assessed the relationship of baseline BMI and baseline waist circumference to the odds for hypercholesterolemia in this sample, following a traditional prospective design (14). Those analyses showed that the odds for being diagnosed with high cholesterol during follow-up increased with these baseline measures even among men and women who were ostensibly healthy weight. This traditional analytical approach has the advantage that weight is determined before the follow-up period in accordance with the premise that cause should precede effect (24).This traditional approach requires that the incident event rate remains approximately constant during follow-up, which may apply if the risk factor remains largely unchanged. During follow- up, however, the men and women experienced significant weight gain (Table 1), as is expected for cohorts in Western societies. In addition, Table 2 suggests that the follow-up adiposity, rather than the baseline, determines the odds for hypercholesterolemia. This suggests that BMI acutely influences the development of high cholesterol. The end of follow-up measurement presumably reflects the BMI level that triggers this condition.
Because weight was not maintained during follow-up, and because the odds for hypercholesterolemia depended more upon follow-up than baseline BMI, we presented analyses that assume that the change in BMI between baseline and follow-up occurred at a constant rate, such that the log odds for hypercholesterolemia was based on an individual’s proportional exposure to their starting, ending, and intervening BMI categories (see Methods and Procedures). Figure 1 shows greater incremental increases in the odds for developing high cholesterol when based on the proportional exposure to the BMI categories than when based on the baseline category alone.
Our analyses also show that ΔBMI and Δbody dimensions were significantly associated with the log odds for acquiring high cholesterol in both men and women. The association remained significant when adjusted for the average of the baseline and follow-up BMI. This was done because BMIaverage increased progressively with the amount of weight gain (Table 1). In the absence of any adjustment for BMI level, a significant association between ΔBMI and high cholesterol could simply reflect the well-established relationship between absolute BMI and total cholesterol levels. Most other studies adjust for BMI level by using baseline BMI as a covariate (24–28). Unfortunately, most use the same baseline BMI value for adjustment and to calculate ΔBMI (24–28). This can produce a significant relationship between ΔBMI and the outcome variable when none actually exists (P.T. Williams, unpublished data). This is because BMI is measured with error, and the baseline BMI used for adjustment shares the same measurement error term as the ΔBMI. This statistical artifact can be avoided by adjusting for a separate independently determined baseline BMI value. It also can be avoided by adjusting for BMIaverage because the measurement errors associated with ΔBMI are statistically independent of those associated with BMIaverage.
When the baseline and end of follow-up BMI were included separately in the logistic regression analyses, the follow-up values were strongly related to the log odds for hypercholesterolemia, whereas the baseline levels were not (Table 3). One interpretation of Table 3 is that the effect of BMI on blood cholesterol levels is acute and that the follow-up measure most strongly reflects the BMI level triggering hypercholesterolemia. Table 1 shows that 74% of men and 73% of women were heavier at the end of follow-up than at baseline. Thus, for most individuals, baseline and the end of follow-up BMI are not simply two independent estimates of a consistent follow-up BMI but rather represent the beginning and ending values of a progressive BMI increase with aging. Prior leanness had little affect on the odds of acquiring high cholesterol.
The principal limitations of these analyses are the select nature of the sample and the reliance on self-reported body weight, body circumferences, and self-reported physician-diagnosed hypercholesterolemia. Self-reported body weights and hypercholesterolemia are reported for other major cohort studies (16). The replication of our findings in men and women further supports the validity of the self-reported measurements. In addition, results for self-reported waist circumference were consistent with the finding for BMI. Self-reported body dimensions may be subject to greater error than are height and weight used in the calculation of BMI (see Methods and Procedures), yet the consistency of their relationships with hypercholesterolemia support their use. Waist circumference, and possibly other body size measurements, may also be, in part, independently related to the risk for high cholesterol (12,29,30), even among nonobese subjects. Although our sample was restricted to physically active men and women, adjustment for their principal physical activity has little effect on the findings.
In conclusion, we have demonstrated the importance of preventing weight gain even among vigorously active men and women, the majority of whom had healthy weights and waist circumferences.
Acknowledgments
We appreciate Kathryn Hoffman and Isabelle La for their assistance in collecting the data. This work was supported in part by grants HL-45652, HL-072110, and DK-066738 from the National Heart Lung and Blood Institute, and was conducted at the Ernest Orlando Lawrence Berkeley Laboratory (Department of Energy DE-AC03-76SF00098 to the University of California).
Footnotes
DISCLOSURE
The author declared no conflict of interest.
References
- 1.National Heart, Lung, and Blood Institute (National Institutes of Health) Third Report of the National Cholesterol Education Program Expert Panel on Detection, Evaluation, and Treatment of High Blood Cholesterol in Adults (Adult Treatment Panel III) Bethesda, MD: National Cholesterol Education Program National Heart, Lung, and Blood Institute; 2002. National Institutes of Health Publication No. 02.5215. [Google Scholar]
- 2.Hutton B, Fergusson D. Changes in body weight and serum lipid profile in obese patients treated with orlistat in addition to a hypocaloric diet: a systematic review of randomized clinical trials. Am J Clin Nutr. 2004;80:1461–1468. doi: 10.1093/ajcn/80.6.1461. [DOI] [PubMed] [Google Scholar]
- 3.Noppa H. Body weight change in relation to incidence of ischemic heart disease and change in risk factors for ischemic heart disease. Am J Epidemiol. 1980;111:693–704. doi: 10.1093/oxfordjournals.aje.a112947. [DOI] [PubMed] [Google Scholar]
- 4.Grinker JA, Tucker KL, Vokonas PS, Rush D. Changes in patterns of fatness in adult men in relation to serum indices of cardiovascular risk: the Normative Aging Study. Int J Obes Relat Metab Disord. 2000;24:1369–1378. doi: 10.1038/sj.ijo.0801397. [DOI] [PubMed] [Google Scholar]
- 5.Siervogel RM, Wisemandle W, Maynard LM, et al. Serial changes in body composition throughout adulthood and their relationships to changes in lipid and lipoprotein levels. The Fels Longitudinal Study. Arterioscler Thromb Vasc Biol. 1998;18:1759–1764. doi: 10.1161/01.atv.18.11.1759. [DOI] [PubMed] [Google Scholar]
- 6.Stamler J, Briefel RR, Milas C, Grandits GA, Caggiula AW. Relation of changes in dietary lipids and weight, trial years 1–6, to changes in blood lipids in the special intervention and usual care groups in the Multiple Risk Factor Intervention Trial. Am J Clin Nutr. 1997;65(1 Suppl):272S–288S. doi: 10.1093/ajcn/65.1.272S. [DOI] [PubMed] [Google Scholar]
- 7.Rainwater DL, Mitchell BD, Comuzzie AG, et al. Association among 5-year changes in weight, physical activity, and cardiovascular disease risk factors in Mexican Americans. Am J Epidemiol. 2000;152:974–982. doi: 10.1093/aje/152.10.974. [DOI] [PubMed] [Google Scholar]
- 8.Borkan GA, Sparrow D, Wisniewski C, Vokonas PS. Body weight and coronary disease risk: patterns of risk factor change associated with long-term weight change. The Normative Aging Study. Am J Epidemiol. 1986;124:410–419. doi: 10.1093/oxfordjournals.aje.a114411. [DOI] [PubMed] [Google Scholar]
- 9.Czernichow S, Mennen L, Bertrais S, et al. Relationships between changes in weight and changes in cardiovascular risk factors in middleaged French subjects: effect of dieting. Int J Obes Relat Metab Disord. 2002;26:1138–1143. doi: 10.1038/sj.ijo.0802059. [DOI] [PubMed] [Google Scholar]
- 10.Norman JE, Bild D, Lewis CE, Liu K, West DS. The impact of weight change on cardiovascular disease risk factors in young black and white adults: the CARDIA study. Int J Obes Relat Metab Disord. 2003;27:369–376. doi: 10.1038/sj.ijo.0802243. [DOI] [PubMed] [Google Scholar]
- 11.Ashley FW, Jr, Kannel WB. Relation of weight change to changes in atherogenic traits: the Framingham Study. J Chronic Dis. 1974;27:103–114. doi: 10.1016/0021-9681(74)90079-4. [DOI] [PubMed] [Google Scholar]
- 12.Galanis DJ, Sobal J, McGarvey ST, Pelletier DL, Bausserman L. Tenyear changes in the obesity, abdominal adiposity, and serum lipoprotein cholesterol measures of Western Samoan men. J Clin Epidemiol. 1995;48:1485–1493. doi: 10.1016/0895-4356(95)00060-7. [DOI] [PubMed] [Google Scholar]
- 13.Couillard C, Lemieux S, Moorjani S, et al. Associations between 12 year changes in body fatness and lipoprotein-lipid levels in men and women of the Quebec Family Study. Int J Obes Relat Metab Disord. 1996;20:1081–1088. [PubMed] [Google Scholar]
- 14.Williams PT, Hoffman K, La I. Weight-related increases in hypertension, hypercholesterolemia, and diabetes risk in normal weight male and female runners. Arterioscleros Thromb Vasc Biol. 2007;27:1811–1819. doi: 10.1161/ATVBAHA.107.141853. [DOI] [PubMed] [Google Scholar]
- 15.Andersen RE, Wadden TA, Bartlett SJ, Vogt RA, Weinstock RS. Relation of weight loss to changes in serum lipids and lipoproteins in obese women. Am J Clin Nutr. 1995;62:350–357. doi: 10.1093/ajcn/62.2.350. [DOI] [PubMed] [Google Scholar]
- 16.Ishikawa-Takata K, Ohta T, Moritaki K, Gotou T, Inoue S. Obesity, weight change and risks for hypertension, diabetes and hypercholesterolemia in Japanese men. Eur J Clin Nutr. 2002;56:601–607. doi: 10.1038/sj.ejcn.1601364. [DOI] [PubMed] [Google Scholar]
- 17.Williams PT. Dose-dependent effects of training and detraining on weight in 6406 runners during 7.4 years. Obesity (Silver Spring) 2006;14:1975–1984. doi: 10.1038/oby.2006.231. [DOI] [PubMed] [Google Scholar]
- 18.Williams PT. Maintaining vigorous activity attenuates 7-year weight gain in 8,340 runners. Med Sci Sports Exerc. 2007;39:801–809. doi: 10.1249/mss.0b013e31803349b1. [DOI] [PMC free article] [PubMed] [Google Scholar]
- 19.Williams PT. Relationship of distance run per week to coronary heart disease risk factors in 8283 male runners. The National Runners’ Health Study. Arch Intern Med. 1997;157:191–198. [PMC free article] [PubMed] [Google Scholar]
- 20.Williams PT. High-density lipoprotein cholesterol and other risk factors for coronary heart disease in female runners. N Engl J Med. 1996;334:1298–1303. doi: 10.1056/NEJM199605163342004. [DOI] [PubMed] [Google Scholar]
- 21.Williams PT. Vigorous exercise and the population distribution of body weight. Int J Obes Relat Metab Disord. 2004;28:120–128. doi: 10.1038/sj.ijo.0802480. [DOI] [PubMed] [Google Scholar]
- 22.Knuiman MW, Divitini ML, Buzas JS, Fitzgerald PE. Adjustment for regression dilution in epidemiological regression analyses. Ann Epidemiol. 1998;8:56–63. doi: 10.1016/s1047-2797(97)00107-5. [DOI] [PubMed] [Google Scholar]
- 23.Colditz G, Martin AP, Stampfer MJ, et al. Validation of questionnaire information on risk factors and disease outcomes in a prospective cohort study of women. Am J Epidemiol. 1986;123:894–900. doi: 10.1093/oxfordjournals.aje.a114319. [DOI] [PubMed] [Google Scholar]
- 24.Petersen L, Schnohr P, Sorensen TI. Longitudinal study of the long-term relation between physical activity and obesity in adults. Int J Obes Relat Metab Disord. 2004;28:105–112. doi: 10.1038/sj.ijo.0802548. [DOI] [PubMed] [Google Scholar]
- 25.Willett WC, Manson JE, Stampfer MJ, et al. Weight, weight change, and coronary heart disease in women. Risk with the“normal” weight range. JAMA. 1995;273:461–465. doi: 10.1001/jama.1995.03520300035033. [DOI] [PubMed] [Google Scholar]
- 26.Juhaeri, Stevens J, Chambless LE, et al. Associations between weight gain and incident hypertension in a bi-ethnic cohort: the Atherosclerosis Risk in Communities Study. Int J Obes Relat Metab Disord. 2002;26:58–64. doi: 10.1038/sj.ijo.0801846. [DOI] [PubMed] [Google Scholar]
- 27.Juhaeri, Stevens J, Chambless LE, et al. Associations of weight loss and changes in fat distribution with the remission of hypertension in a bi-ethnic cohort: the Atherosclerosis Risk in Communities Study. Prev Med. 2003;36:330–339. doi: 10.1016/s0091-7435(02)00063-4. [DOI] [PubMed] [Google Scholar]
- 28.Huang Z, Willett W, Manson J, et al. Body weight, weight change, and risk of hypertension in women. Ann Intern Med. 1998;128:81–88. doi: 10.7326/0003-4819-128-2-199801150-00001. [DOI] [PubMed] [Google Scholar]
- 29.Wing RR, Jeffery RW, Burton LR, et al. Change in waist-hip ratio with weight loss and its association with change in cardiovascular risk factors. Am J Clin Nutr. 1992;55:1086–1092. doi: 10.1093/ajcn/55.6.1086. [DOI] [PubMed] [Google Scholar]
- 30.Seidell JC, PeÅLrusse L, DespreÅLs JP, Bouchard C. Waist and hip circumferences have independent and opposite effects on cardiovascular disease risk factors: the Quebec Family Study. Am J Clin Nutr. 2001;74:315–321. doi: 10.1093/ajcn/74.3.315. [DOI] [PubMed] [Google Scholar]