

Abstract
The dorsolateral striatum and cannabinoid type 1 receptor (CB1) signaling mediate habitual action learning, which is thought to require a balance of activity in the direct and indirect striatal output pathways. However, very little is known about how the high CB1-expressing striatal inhibitory microcircuitry might contribute to long-term plasticity capable of sculpting direct/indirect pathway output. Using optogenetic and molecular interrogation of striatal GABAergic microcircuits, we describe novel mechanisms of voltage-dependent long-term depression of inhibitory synapses (iLTD) onto mouse and rat medium spiny projection neurons (MSNs). This iLTD involves recruitment of different endocannabinoid types and shows both presynaptic and postsynaptic selectivity for MSN subtypes, ultimately resulting in a powerful disinhibition of direct pathway MSNs. These results indicate a new role for voltage states in gating circuit-specific forms of synaptic plasticity and illuminate possible circuit dynamics underlying action control.
Introduction
Action learning involves the acquisition and improvement, or in extreme cases habitization, of particular motor repertoires. Habitual action learning requires the dorsolateral striatum (DLS) and is dependent upon the cannabinoid type 1 receptor (CB1)1, 2. Cortical input to the striatum synapses upon GABAergic medium spiny neurons (MSNs) that, in turn, project to downstream basal ganglia sites via the distinct direct (striatonigral) and indirect (striatopallidal) pathways. Current models of basal ganglia function propose that action reinforcement is encoded by the striatum as a bias toward direct pathway relative to indirect pathway output, a concept referred to as a “go” signal3, 4, or, alternatively, by coordinated activity in ensembles of neurons in both pathways that alter the “signal-to-noise” ratio of desired versus undesired actions5,6. Regardless of the precise mechanism, the balance between direct and indirect pathway activity is crucial for proper action production and sequencing6.
Since CB1 is implicated in habit learning and is strongly expressed at striatal inhibitory presynaptic terminals7, we hypothesized that endocannabinoid (eCB)-mediated LTD of inhibitory synapses (iLTD) generates output pathway bias. However, CB1-expressing inhibitory inputs onto MSNs arise from two sources: MSN dendritic arbor-synapsing MSN recurrent collaterals and somatic and proximal dendrite-synapsing fast-spiking interneurons (FSIs)8, 9, 10. We used slice electrophysiology combined with optogenetics to examine the differential contribution of these presynaptic inputs to iLTD induced at the “up” (≈− 60 mV) and “down” (≈− 80 mV) state membrane potentials achieved by MSNs in vivo11, 12 and in vitro13. We find that MSNs exhibit two distinct, voltage-specific forms of iLTD operating through differential eCB production and/or release mechanisms that are presynaptic input-selective. These findings offer a novel eCB-mediated mechanism allowing for the differential control of inhibitory inputs to specific striatal output pathways, which could ultimately influence actions.
Results
Membrane voltage-dependent iLTD
Delivery of a low frequency electrical stimulus (LFS) protocol while voltage-clamping MSNs at −60 mV (near “up state” potentials) elicits iLTD that is CB1-dependent and recapitulated with application of an L-type voltage-gated calcium channel (VGCC) activator14. Using an LFS protocol of 1 Hz for 80 s delivered locally (Supplemental Fig. 1a), we reproduced this iLTD in MSNs held at −60 mV (IPSC amplitude, 65.9 ± 4.2% of baseline, n = 6, p < 0.01, t = 8, df = 10) (Fig. 1a). Hypothesizing that this iLTD depends on L-type VGCC activation, we reasoned that if we shifted the holding potential to −80 mV, closer to the “down state” and sufficiently hyperpolarized to prevent channel activation, we would not observe the L-type VGCC-dependent iLTD15. Delivery of LFS while voltage clamping the MSN at −80 mV notably resulted in iLTD (IPSC amplitude, 77.9 ± 8.3% of baseline, n = 6, p = 0.02, t = 2.7, df = 10) (Fig. 1a). Neither form of iLTD resulted from a change in series resistance (Fig. 1b).
Figure 1. State-dependent endocannabinoid (eCB)-mediated forms of inhibitory long-term depression (iLTD) at striatal inhibitory synapses.

a, A low frequency stimulus train (LFS, 1 Hz for 80 s) delivered while holding rat MSN membrane potential at the up state, −60 mV holding potential (VHold) (black circles) or the down state, −80 mV VHold (red circles) induced lasting depression of inhibitory postsynaptic current (IPSC) amplitude. b, Examples of LFS-induced decreases in IPSC amplitude at the up and down states (iLTD) from individual MSNs (top), and measurement of series resistance (Rs) from these neurons showing no change associated with iLTD (bottom). c, The DAG lipase inhibitor tetrahydrolipstatin (THL, 10 μM) prevented IPSC amplitude depression when MSNs were held at −60 mV (black circles) but not at −80 mV (red circles) during LFS. d, The L-type voltage-gated calcium channel (VGCC) antagonist nifedipine (30 μM) failed to prevent depression of IPSC amplitude following LFS delivery while holding MSNs at −60 mV (black circles), but rendered this form of plasticity THL-insensitive (red circles). Despite this switch to THL insensitivity in the presence of nifedipine, iLTD was still blocked by the CB1 antagonist AM251 (5 μM) (blue circles). e, Down state iLTD (control, black circles) was unaffected by nifedipine application (blue circles), but was blocked in the presence of AM251 (red circles). f, Photolysing MNI-L-glutamate (400 μM) at 1 Hz for 40 s using 5 ms flashes of 380 nm light while holding MSNs at −60 mV induced a depression of (electrically evoked) IPSC amplitude (black circles) that was blocked in the presence of THL (red circles). Scale bars: 300 pA (vertical), 100 ms (horizontal). Inset current traces show IPSCs before (dark) and 20 min after (light) the iLTD induction protocol. All error bars represent standard error of the mean (SEM).
The iLTD induced at the −60 mV holding potential (up state iLTD) is metabotropic glutamate receptor (mGluR)- and putatively calcium-dependent14, 16, and we hypothesized that iLTD induced at − 80 mV (down state iLTD) is a distinct form. Activation of mGluRs combined with calcium signaling can stimulate production of the eCB 2-AG17 and, thus, we reasoned that application of an inhibitor of the 2-AG synthetic enzyme DAG lipase might discriminate between the two iLTD forms. Indeed, preincubation with THL (1 μM) for at least 2 hours followed by superfusion of THL (10 μM) blocked up state iLTD (IPSC amplitude, 99.6 ± 8.3% of baseline, n = 6, p = 0.8, t = 0.2, df = 10), but not down state iLTD (IPSC amplitude, 66.8 ± 7.1% of baseline, n = 7, p = 0.001, t = 4.5, df = 12) (Fig. 1c). Delivery of high frequency stimulation (HFS) (100 Hz for 10 s) also induced up state iLTD (Supplemental Fig. 1b)
Next, we examined the L-type VGCC role in up state iLTD by applying the channel blocker nifedipine (30 μM), which failed to block up state iLTD (IPSC amplitude, 75 ± 6.8% of baseline, n = 11, p = 0.002, t = 3.7, df = 20) (Fig. 1d). Notably, the proportion of cells exhibiting iLTD following LFS delivery while holding MSNs at −60 mV without nifedipine (11/11 cells) versus −60 mV in the presence of nifedipine (6/11 cells) was significantly different (Fisher’s exact test, p = 0.04). Also, we found that iLTD induced while holding MSNs at −60 mV in the presence of nifedipine was now insensitive to THL (IPSC amplitude, 70.3 ± 5.5% of baseline, n = 6, p = 0.0003, t = 5.4, df = 10), and that this nifedipine-enabled, THL-insensitive iLTD was still blocked by the CB1 antagonist AM251 (5 μM) (IPSC amplitude, 104.5 ± 9.8% of baseline, n = 6, p = 0.7, t = 0.5, df = 10) (Fig. 1d). Thus, delivery of LFS while holding MSNs at −60 mV in the presence of nifedipine “unmasks” the THL-insensitive, down state form of iLTD. Indeed, we found that down state iLTD was not blocked by nifedipine, (IPSC amplitude, 70.3 ± 5.5% of baseline, n = 6, p = 0.0003, t = 5.4, df = 10), but was prevented by AM251 (IPSC amplitude, 98 ± 6.8% of baseline, n = 10, p = 0.6, t = 0.5, df = 18) (Fig. 1e), and similar results were found using HFS induction of iLTD (Supplemental Fig. 1c). Postsynaptic loading with the calcium chelator BAPTA (20 mM) failed to block either LFS-induced up state or down state iLTD (Supplemental Fig. 1d).
Consistent with the findings showing up state iLTD dependence on mGluR activation, we recapitulated up state iLTD by photolysing MNI-L-glutamate (400 μM) (NBQX and AP5 present, IPSCs evoked electrically) (IPSC amplitude, 69.4 ± 3.6% of baseline, n = 6, p < 0.0001, t = 7.8, df = 10) (Fig. 1f). This iLTD was sensitive to THL (IPSC amplitude, 91.1 ± 6.4% of baseline, n = 6, p = 0.2, t = 1.4, df = 10) (Fig. 1f). This glutamate uncaging-induced up state iLTD was nifedipine insensitive, but like up state iLTD induced by LFS, nifedipine application rendered this iLTD insensitive to THL (Supplemental Fig. 2a). Glutamate uncaging in NBQX and AP5 did not evoke detectable ion current, indicating that up state iLTD does not depend on GABAA-mediated depolarization activating L-type VGCCs during induction, which could occur with the LFS protocol in chloride-loaded MSNs. In recordings performed with a physiological internal chloride concentration18,19, LFS delivery with the −60 mV holding potential also resulted in a THL-sensitive iLTD (Supplemental Fig. 2b).
If 2-AG mediates up state iLTD, then inhibition of 2-AG metabolism should enhance up, but not down, state iLTD. Delivery of LFS at 0.5 Hz for 80s did not induce LTD in untreated slices at −60 mV, and we designate this as a subthreshold induction protocol (SIP, Fig. 2a). However, SIP induced iLTD at −60 mV during bath application of JZL184 (2 μM), an inhibitor of the 2-AG-degrading enzyme MAG lipase (IPSC amplitude, 61.6 ± 5.4% of baseline, n = 7, p < 0.0001, t = 6.7, df = 12) (Fig. 2a). The iLTD induced by SIP + JZL184 was significantly greater when holding MSNs at −60 mV than at −80 mV during SIP (−80 mV, 85.8 ± 4.5% of baseline, n = 8, p = 0.004, t =3.5, df = 14, comparing iLTD at −60 and −80 mV). Importantly, in control (no JZL 184) cells held at −60 mV during SIP, the change in IPSC amplitude was not significantly different from that observed in cells held at −80 mV during SIP with JZL184 (−60 mV control, 91.1 ± 4.1% of baseline, n = 7 p = 0.4, t = 0.9, df = 12, compared to −80 mV JZL184) (Fig. 2a). Likewise, the change in IPSC amplitude following SIP at −80 mV in JZL184 did not differ from that observed at −80 mV in the absence of drug (−80 mV control, 91.4 ± 4.8% of baseline, n = 8 vs. −80 mV JZL184, p = 0.4, t =0.8, df = 14, by t-test, p = 0.4, F = 0.7, df = 1 by two-way ANOVA compared to SIP alone −80 mV), which itself was not significantly different from baseline (p = 0.1, t =1.7, df = 14) (Fig. 2a, b). JZL184 application alone did not alter IPSC amplitude in response to baseline-frequency stimulation (−60 mV, 97.3 ± 11.8% of baseline, n = 5, p = 0.8, t = 2.3, df = 8). Thus, down state iLTD may be mediated by a different eCB, possibly anandamide (AEA).
Figure 2. Differential eCB signaling mediates up and down state forms of iLTD.

a, Delivery of a subthreshold induction protocol (SIP) consisting of 0.5 Hz for 80 s while holding rat MSNs at −60 mV did not induce a significant iLTD (blue circles). However, in the presence of the MAG lipase inhibitor JZL184 (2 μM), delivery of the SIP while holding MSNs at −60 mV induced iLTD (black circles), but not while holding MSNs at −80 mV (red circles). b, Delivery of the SIP while holding rat MSNs at −80 mV did not induce depression of IPSC amplitude (blue circles), but did induce depression when MSNs were loaded with the FAAH inhibitor URB597 (50 nM) and held at −80 mV (red circles). Loading MSNs with URB597 and delivering the SIP while voltage clamping at −60 mV induced significantly less depression of IPSC (black circles) compared to the −80 mV condition (red circles). c, Delivery of a SIP of 0.2 Hz for 90 s to wild type mouse MSNs (black circles) or FAAH−/− MSNs (red circles) held at −60 mV did not result in IPSC amplitude depression. d, Holding MSNs at −80 mV and delivering the same 0.2 Hz for 90 s protocol had no effect on IPSC amplitude in wild type mouse MSNs (black circles), but did depress IPSC amplitude in MSNs recorded from FAAH−/− slices (red circles). Scale bars: 300 pA (vertical), 100 ms (horizontal). Inset current traces show IPSCs before (dark) and 20 min after (light) the iLTD induction protocol. All error bars represent SEM.
Because multiple biosynthetic pathways exist for AEA, we targeted AEA degradation by postsynaptically loading URB597 or JNJ1661010, inhibitors of the AEA-degrading enzyme fatty acid amide hydrolase (FAAH). In cells held at −80 mV during SIP, postsynaptic loading with URB597 (50 nM) or JNJ1661010 (100 nM) resulted in a significant depression of IPSC amplitude when compared to FAAH inhibitor-loaded MSNs held at −60 mV during SIP (−60 mV URB597, 84.6 ± 5.9% of baseline, n = 6 vs. −80 mV URB597, 54.9 ± 10.3% of baseline, n = 6, p = 0.03, t = 2.5, df = 10; −60 mV JNJ1661010, 96.9 ± 8.2% of baseline, n = 5 vs. −80 mV JNJ1661010, 73.1 ± 5.8% of baseline, n = 5, p = 0.046, t = 2.4, df = 8) (Fig. 2b, Supplemental Fig. 2c). Importantly, the SIP-induced down-state iLTD enabled by postsynaptic URB597 loading was blocked by AM251 (5 μM) (Supplemental Fig. 2d). Postsynaptic loading with URB597 or JNJ1661010 alone had no significant effect on IPSC amplitude with stimulation at the baseline rate (−60 mV URB597, 86.8 ± 6.0% of baseline, n = 5, p = 0.06, t = 2.2, df = 8; −60 mV JNJ1661010, 90.4 ± 6.4% of baseline, n = 5, p = 0.2, t = 1.5, df = 8). Finally, immunoreactivity for N-acyl phosphatidylethanolamine phospholipase D (NAPE-PLD), an enzyme involved in one known AEA biosynthetic pathway, was robust and pervasive in striatal neuropil (Supplemental Fig. 3). Thus, several lines of evidence support a role for AEA in down state iLTD.
We next established that these same forms of iLTD occur in mouse (Supplemental Fig. 4a). We found that delivery of a SIP of 0.2 Hz for 90 s while holding MSNs at −60 mV resulted in no change in IPSC amplitude in either wild type (IPSC amplitude, 96.6 ± 4.5% of baseline, n = 5, p = 0.3, t = 1.1, df = 8) or FAAH knockout mouse slices (IPSC amplitude, 96 ± 15.6% of baseline, n = 5, p = 0.8, t =0.3, df = 8) (Fig. 2c). However, upon delivery of the same SIP (0.2 Hz for 90 s) in MSNs held at −80 mV, iLTD was observed in FAAH knockout (IPSC amplitude, 73 ± 6.6, n = 10, p = 0.003, t = 3.4, df = 18), but not in wild type mouse slices (IPSC amplitude, 103.3 ± 14.9% of baseline, n = 7, p = 0.8, t = 0.2, df = 12) (Fig. 2d). These data further implicate AEA signaling in down state iLTD. Notably, manipulating many receptors and channels failed to block down state iLTD induced by LFS (Supplementary Table 1), including blockade of D1-like (SCH 23390, 10 μM) or D2-like (sulpiride 10 μM) dopamine receptor subtypes and knockout of the transient receptor potential cation channel subfamily V member 1 (TRPV1) (Supplemental Fig. 4b). D1- and D2-receptor blockade also failed to inhibit up state iLTD (IPSC amplitude, SCH 23390, 54.9 ± 9% of baseline, n = 5, p = 0.001, t = 5, df = 8; sulpiride, 70.1 ± 7.2% of baseline, n = 5, p = 0.003, t = 4, df = 8).
Voltage-driven cellular specificity of iLTD
We observed that up state iLTD occurred in every rat MSN (50/50 cells) (Supplemental Fig. 5a), while down state iLTD occurred in roughly half of all recorded MSNs (28/50 cells) (Supplemental Fig. 5b). The proportion of cells exhibiting IPSC amplitude depression following LFS delivery while holding cells at −60 mV versus −80 mV was statistically significant (Fisher’s exact test, p = 0.0001). We therefore suspected that down state iLTD might be output pathway-specific, and thus we recorded from striatal slices from D1 GFP BAC transgenic mice. LFS delivery while holding MSNs at −60 mV induced IPSC amplitude depression in GFP-positive cells (D1-expressing, direct pathway MSNs) (73.5 ± 4.0% of baseline, n = 6 cells from 4 animals, p = 0.0002, t = 4.9, df = 10) and GFP-negative cells (putative D2-expressing, indirect pathway MSNs) (66.4 ± 7.3% of baseline, n = 6 from 3 animals, p = 0.001, t = 6.8, df = 10) (Fig. 3a). In contrast, delivering LFS at −80 mV led to iLTD in in GFP-positive MSNs (58.6 ± 7.0% of baseline, n = 6 from 4 animals, p = 0.0002, t = 5.9, df = 10), but not GFP-negative MSNs (90.6 ± 8.2% of baseline, n = 6 from 3 animals, p = 0.3, t =1.1, df = 10) (Fig. 3b).
Figure 3. Up state iLTD is output pathway-nonspecific, while down state iLTD is specific to direct pathway MSNs.
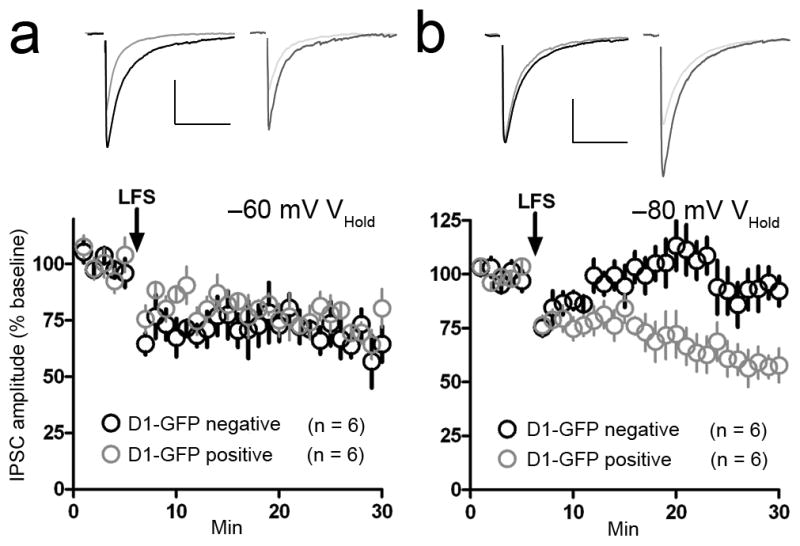
a, LFS delivery while holding D1 dopamine receptor–GFP (D1-GFP) positive (gray circles) and D1-GFP negative MSNs (putative D2 receptor-positive MSNs, black circles) at −60 mV induced a lasting depression of IPSC amplitude in both cell populations. b, LFS delivery during postsynaptic voltage clamping at −80 mV induced a depression of IPSC amplitude in D1-GFP MSNs (gray circles), but not D1-GFP negative MSNs (black circles). Scale bars: 300 pA (vertical), 100 ms (horizontal). Inset current traces show IPSCs before (dark) and 20 min after (light) the iLTD induction protocol. All error bars represent SEM.
Thus far, up and down state forms of iLTD appear to be mechanistically distinct, functioning through the differential release of 2-AG (up state) or, putatively, AEA (down state). Notably, subcellular localization of DAG lipase is largely restricted to dendritic arbors of MSNs, with somata relatively devoid of enzyme7. Thus, we hypothesized that up state iLTD involves 2-AG release only from dendrites that acts retrogradely at CB1 on those presynaptic inputs that synapse onto MSN dendrites, inputs that predominately arise from neighboring MSN axon collaterals8, 20, 23. Because FSIs also express CB1 and abundantly synapse onto MSN somata and proximal dendrites8, 20, 21, 22, 23, 24, we hypothesized that the 2-AG generated during up state iLTD induction does not reach these receptors, but that they are activated during the putatively AEA-mediated down state iLTD. These hypotheses predict that down state iLTD should not be occluded by up state iLTD as they would each involve the depression of separate presynaptic inputs. Testing this in rat slices, this is indeed what was found (Supplemental Fig. 6).
To assess the contribution of MSN-MSN or FSI-MSN synapses to up and down state iLTD, we selectively interrogated MSN or FSI inputs to postsynaptic MSNs by expressing channelrhodopsin 2 (ChR2) and mCherry using a cre-sensitive viral vector (AAV2-DIO-ChR2-mCherry) in either MSNs, using the RGS9-cre transgenic mouse, or FSIs, using the parvalbumin (PV)-cre transgenic mouse. Crossing RGS9-cre mice with a reporter line that expresses green fluorescent protein (GFP) in the presence of Cre (the CAG-mRFP-GFP mouse) revealed a GFP expression pattern consistent with MSNs (Fig. 4a): highly abundant throughout the striatum only. Crossing the PV-cre mouse with the CAG-mRFP-GFP mouse revealed a GFP expression pattern consistent with FSI distribution: sparser than MSNs and more populous in the dorsolateral than dorsomedial striatum (Fig. 4b). Immunostaining tissue from RGS9-cre/CAG-mRFP-GFP mice for GFP and PV revealed no double-labeled cells (replicated across 3 animals) (Fig. 4a, inset). However, co-immunostaining for GFP and PV in PV-cre/CAG-mRFP-GFP mice revealed a high incidence of double labeling (replicated across 4 animals) (Fig. 4b).
Figure 4. Optogenetic targeting of RGS9-expressing MSNs or striatal parvalbumin (PV)-expressing fast-spiking interneurons (FSIs).

a, Striatal slice of an RGS9-cre/CAG-mRFP-GFP mouse showing immunohistochemical (IHC) enhancement of cre-mediated GFP expression in MSNs (green) and IHC detection of parvalbumin (PV) (red) in cells of striatum and overlying cortex. In striatum, red PV-immunoreactive cells did not co-label with GFP-positive MSNs (inset, top right). b, IHC enhancement of cre recombinase (cre)-mediated GFP expression in FSIs (left) and immunohistochemical detection of PV (red, middle), revealed a high incidence of co-labeling (merge, right) in a PV-cre/CAG-mRFP-GFP striatal section. c, Cre-mediated expression of GFP in MSNs of an RGS9-cre/CAG-mRFP-GFP striatal section (left). mCherry expression at the site of injection of AAV2-DIO-ChR2-mCherry (right). d, Current injection into an mCherry-positive cell in an RGS9-cre mouse striatal slice infected with AAV2-DIO-ChR2-mCherry revealed a maximum firing rate of ~100 Hz (top right). Millisecond-scale blue light exposure (blue bar) induced a single action potential upon recording from mCherry-positive MSNs in current clamp (lower right). Upon recording from mCherry-positive MSNs in voltage clamp mode in the presence of the sodium channel blocker TTX (1 μM), NMDA receptor antagonist AP5 (50 μM), AMPA receptor antagonist NBQX (50 μM), and GABAA receptor antagonist GABAzine (10 μM), blue light exposure induced an inward, ChR2-mediated current (lower left). e, Blue light exposure induced an IPSC that was blocked by TTX (top) and the GABAA receptor antagonist bicuculline (bottom) in recordings from mCherry-negative MSNs adjacent to the AAV2-DIO-ChR2-mCherry infection zone in an RGS9-cre striatal slice. f, Cre mediated expression of mCherry in FSIs of a PV-cre mouse injected with AAV2-DIO-ChR2-mCherry into the striatum under brightfield (left) and red fluorescence (right). g, Current injection into an mCherry-positive cell in a PV-cre mouse striatal slice infected with AAV2-DIO-ChR2-mCherry revealed a maximum firing rate of ~250 Hz (top right). Millisecond-scale blue light exposure induced a single action potential upon recording from mCherry-positive cells in current clamp mode (lower right) in an infected Pv-cre mouse striatal slice. In voltage clamp mode, blue light exposure induced an inward current upon recording from an mCherry positive neuron in PV-cre striatal slices bathed in TTX, AP5, NBQX, and GABAzine (lower left). h, Upon recording from MSNs just outside the zone of AAV2-DIO-ChR2-mCherry infection in a PV-cre striatal slice, blue light exposure induced an IPSC that is blocked by TTX (top) and bicuculline (bottom). Scale bars: voltage clamp recordings, 300 pA (vertical), 100 ms (horizontal); current clamp recordings 25 mV (vertical), 25 ms (horizontal); a, 250 μm, inset, 20 μm; b, 50 μm; c, f, 0.5 mm.
We injected AAV2-DIO-ChR2-mCherry into the striatum of adult RGS9-cre (Fig. 4c) or PV-cre (Fig. 4f) mice. Performing current injection steps in mCherry-positive cells in RGS9-cre striatal slices revealed an average peak firing rate of ~100 Hz (Fig. 4d, g), and a peak firing rate of 250 Hz in mCherry-positive cells in PV-cre striatal slices (Fig. 4e), consistent with previous findings of FSI firing capabilities25. A brief single blue light flash induced a single action potential, recorded in current clamp, in mCherry positive neurons in RGS9-cre (n = 5) or PV-cre (n = 5) mouse slices (Fig. 4d, g). In voltage clamp mode recordings from mCherry positive cells, while blocking NMDA receptors (AP5, 50 μM), AMPA receptors (NBQX, 5 μM), sodium channels (TTX, 1 μM) and GABAA receptors (GABAzine, 10 μM), a blue light flash induced a ChR2-mediated, inward current in both neuronal subtypes (n = 4) (Fig. 4d, g). Recording from uninfected MSNs, we observed a single IPSC induced by blue light flashes (oIPSC) (Fig. 4e, h). oIPSCs recorded from MSNs in slices taken from RGS9-cre and PV-cre mice were sensitive to blockade of sodium channels (TTX, 1 μM) and GABAA receptors (bicuculline, 10 μM) (n = 5) (Fig. 4e, h).
Examining the contribution of the MSN-MSN synapse in slices from RGS9-cre mice, we held uninfected postsynaptic MSNs at −60 mV during LFS, which was delivered via the electrical stimulating electrode as in the previous experiments (NBQX and AP5 still present in the bath) (Fig. 5a). LFS depressed electrically-evoked IPSC (eIPSC) amplitude (72.2 ± 4.0% of baseline, n = 6, p = 0.0001, t = 9.2, df = 10), used as a positive control, and light-induced IPSC (oIPSC) amplitude (56.2 ± 9.0% of baseline, n = 6, p = 0.001, t = 5.1, df = 10) (Fig. 5b). Similarly, LFS delivered while holding MSNs at −80 mV depressed eIPSC (67.0 ± 5.1% of baseline, n = 7, p < 0.0001, t = 6.7, df = 12) and oIPSC (58.2 ± 8.1% of baseline, n = 7, p = 0.002, t = 4, df = 12) amplitude (Fig. 5c). It is possible that the observed depression of MSN-MSN IPSC amplitude during down state LTD partially, or fully, results from induction of the 2-AG-dependent, up state iLTD that may be occurring in cells that are insufficiently clamped at −80 mV in their distal dendrites. Thus, we applied THL to isolate the contribution of down state iLTD, which we originally hypothesized to exclusively involve FSI-MSN synapses. In the presence of THL, delivery of LFS while holding MSNs at −80 mV still depressed both eIPSC (75.0 ± 2.8% of baseline, n = 6, p < 0.0001, t = 9, df = 10) and oIPSC (78.1 ± 4.4% of baseline, n = 6, p = 0.0006, t = 3.7, df = 10) amplitude.
Figure 5. The MSN-MSN synapse contributes to both up and down state iLTD, while the FSI-MSN synapse solely contributes to down state iLTD.

a, Experimental setup for the optogenetic interrogation of striatal microcircuits. A bipolar concentric stimulating electrode was situated within the AAV2-DIO-ChR2-mCherry infection zone, while the recording electrode was placed just outside of this area, in an uninfected zone. Blue light was delivered to the slice to elicit ChR2-mediated activation of elements presynaptic to the recorded MSN (top). RGS9-cre mediated expression of mCherry and ChR2 in MSNs allowing for MSN-MSN synapse interrogation (b, c). b, LFS delivery via the stimulating electrode while holding MSNs at −60 mV depressed light-induced, MSN-MSN IPSC (oIPSC) amplitude and stimulating electrode-induced IPSC (eIPSC) amplitude. c, Delivering LFS via the stimulating electrode while holding MSNs at −80 mV depressed both oIPSC (blue circles) and eIPSC (black circles) amplitude. PV-cre mediated expression of mCherry and ChR2 in FSIs allowing for FSI-MSN synapse interrogation (d, e). d, Delivery of LFS via the stimulating electrode while holding MSNs at −60 mV depressed eIPSC amplitude (black circles), but not FSI-MSN mediated oIPSC amplitude (blue circles). e, LFS delivery via the stimulating electrode while holding MSNs at −80 mV induced depression of both oIPSC (blue circles) and eIPSC (black circles) amplitude. Scale bars: 300 pA (vertical), 100 ms (horizontal). Inset current traces show IPSCs before (dark) and 20 min after (light) the iLTD induction protocol. All error bars represent SEM.
In PV-cre mouse slices, MSNs held at −60 mV during LFS (again delivered with the electrical stimulating electrode) depressed eIPSC amplitude (71.4 ± 4.3% of baseline, n = 8, p < 0.0001, t = 6, df = 14) but not oIPSC amplitude (101.5 ± 14.5% of baseline, n = 8, p = 0.9, t = 0.1, df = 14) (Fig. 5d), indicating that depression of FSI-MSN synapses does not contribute to up state iLTD. However, holding MSNs at −80 mV during LFS revealed depression of both eIPSC (70.7 ± 4.2% of baseline, n = 8, p < 0.0001, t =6.3, df = 14) and oIPSC (71.2 ± 5.4% of baseline, n = 8, p = 0.0002, t = 5, df = 14) amplitude (Fig. 5e), indicating that FSI-MSN synapses contribute to down state iLTD.
Applying LFS selectively to either MSNs or FSIs using a 1 Hz 80 s light pulse protocol failed to induce CB1-mediated iLTD in uninfected neurons held at either -60 mV or -80 mV. This further supports the heterosynaptic nature of these forms of plasticity (Supplemental Fig. 7).
To confirm the findings that depression of MSN-MSN synapses contributes to both up and down state iLTD, but depression of FSI-MSN synapses contributes to down state iLTD only, we genetically ablated CB1 from MSNs or FSIs by crossing a floxed CB1 transgenic mouse with RGS9-cre (CB1−/− /RGS9-cre) or PV-cre mice (CB1−/−/PV-cre). Using the same AAV2-DIO-ChR2-mCherry infection and slice recording configuration, we found that oIPSCs were readily induced with light exposure parameters similar to those used in previous experiments, and these oIPSCs exhibited properties that did not differ between RGS9-cre and CB1−/−/RGS9-cre mice, or between PV-cre and CB1−/−/PV-cre mice (Supplementary Table 2). Examining plasticity, we recorded from uninfected MSNs at −60 mV during LFS in CB−/−/RGS9-cre striatal slices, allowing for the assessment of CB1 null MSN-MSN synapses, and failed to observe iLTD of eIPSCs (103.4 ± 3.9% of baseline, n = 6, p = 0.4, t = 0.5, df = 10) or oIPSCs (96.4 ± 6.8% of baseline, n = 6, p = 0.6, t = 0.5, df = 10) (Fig. 6a). However, LFS delivery while holding MSNs at −80 mV resulted in depression of eIPSC (70.7 ± 4.3% of baseline, n = 8, p < 0.0001, t = 6.6, df = 14), but not oIPSC (95.3 ± 2.9% of baseline, n = 8, p = 0.3, t = 1.5, df = 14) amplitude (Fig. 6b). These data are consistent with the idea that MSN-MSN synapses contribute to both up and down state forms of iLTD and that CB1 receptors on another non-MSN presynaptic population also contribute to down state iLTD.
Figure 6. Cre-mediated CB1 deletion effects on state dependent iLTD.

Breeding RGS9-cre mice with floxed CB1 mice produced selective deletion of CB1 from MSNs and, subsequent to AAV2-DIO-ChR2-mCherry injection, also expressed mCherry and ChR2 in MSNs (a, b). a, LFS delivery via the stimulating electrode while holding MSNs at −60 mV failed to depress MSN-MSN oIPSC (blue circles) and eIPSC (black circles) amplitude. b, LFS delivery while holding MSNs at −80 mV did not depress MSN-MSN oIPSC amplitude (blue circles), but did depress eIPSC amplitude (black circles). Breeding PV-cre mice with CB1 floxed mice produced selective deletion of CB1 from FSIs and, subsequent to AAV2-DIO-ChR2-mCherry injection, also expressed mCherry and ChR2 in FSIs (c, d). c, LFS delivery while holding MSNs at −60 mV failed to depress FSI-MSN oIPSC amplitude (blue circles), but did depress eIPSC amplitude (black circles). d, LFS delivery while holding MSNs at −80 mV failed to depress FSI-MSN oIPSC amplitude (blue circles), but did depress eIPSC amplitude (black circles). Scale bars: 300 pA (vertical), 100 ms (horizontal). Inset current traces show IPSCs before (dark) and 20 min after (light) the iLTD induction protocol. All error bars represent SEM.
We next recorded from slices taken from CB1−/−/PV-cre mice infected with AAV2-DIO-ChR2-mCherry to assess FSI-MSN synapses that lack CB1 on FSIs. LFS delivery while holding MSNs at −60 mV resulted in depression of eIPSC amplitude (65.1 ± 10.7% of baseline, n = 6, p = 0.006, t = 3.4, df = 10), but not oIPSC amplitude (92.2 ± 9.3% of baseline, n = 6, p = 0.4, t = 0.8, df = 10) (Fig. 6c), further suggesting that FSI-MSN synapses do not contribute to this form of plasticity. Finally, we delivered LFS while holding MSNs at −80 mV and again observed a modest decrease in eIPSC amplitude (80.9 ± 2.8% of baseline, n = 9, p < 0.0001, t = 6.4, df = 16), but no change in oIPSC amplitude (98.5 ± 6.5% of baseline, n = 9, p = 0.8, t = 0.2, df = 16) (Fig. 6d), suggesting that depression of FSI-MSN synapses contributes to down state iLTD.
MSN membrane potentials oscillate between up and down states in vivo11, 12. Thus, we examined whether state dependent iLTD is inducible by timing electrical stimulation with transitions to and achievement of up or down state plateaus reached during postsynaptic membrane potential oscillations induced by postsynaptic current injection. Since in vivo up states are thought to be induced by excitatory synaptic barrage onto MSNs11, NBQX and AP5 were excluded from the bath. We evoked oIPSC test pulses in slices from RGS9-cre mice, again infected with AAV2-DIO-ChR2-mCherry to assess the MSN-MSN synapses shown to be depressed in both up and down state iLTD. Timing 30 pulses of electrical stimulation at 30 Hz with the transition to and during up state potential plateaus (−60 mV), repeated 120 times, induced iLTD (oIPSC amplitude, 65.4 ± 9% of baseline, n = 6, p = 0.003, t = 3.8, df = 10) that was blocked by THL (oIPSC amplitude, 95.5 ± 8.7% of baseline, n = 5, p = 0.6, t = 0.5, df = 8) (Fig. 7a). Timing 30 pulses of electrical stimulation at 30 Hz with transition to and during down state potential plateaus (−80 mV) resulted in iLTD (oIPSC amplitude, 78.1 ± 8.6% of baseline, n = 8, p = 0.02, t = 2.6, df = 14) that was insensitive to THL (oIPSC amplitude, 75.4 ± 7.9% of baseline, n = 5, p = 0.01, t = 3.1, df = 8) but blocked by AM251 (oIPSC amplitude, 97.4 ± 5.8% of baseline, n = 7, p = 0.7, t = 0.4, df = 12) (Fig. 7b). Thus up and down state iLTD induction can occur with two-state membrane potential oscillations in MSNs, such as those observed in vivo.
Figure 7. Stimulation and voltage oscillation timing-dependent iLTD.

a, Timing 30 electrical pulses delivered at 30 Hz with the transition to and during up state membrane potential plateaus, repeated 120 times, (up state electrical stimulation induction protocol, top) in the absence of NBQX or AP5 resulted in a lasting depression of MSN-MSN synapse oIPSC amplitude (black circles). This up state electrical stimulation induction protocol failed to depress MSN-MSN oIPSC amplitude in the presence of THL (red circles). b, Timing 30 electrical pulses delivered at 30 Hz during down state membrane potential plateaus and transitions to up state peaks, repeated 120 times, (down state electrical stimulation induction protocol, top) in the absence of NBQX or AP5 depressed MSN-MSN synapse oIPSC amplitude (black circles). This iLTD was not blocked by THL application (red circles), but was inhibited in the presence of AM251 (blue circles). Abbreviation: Vm, membrane voltage. Scale bars: 300 pA (vertical), 100 ms (horizontal). Inset current traces show IPSCs before (dark) and 20 min after (light) the iLTD induction protocol. All error bars represent SEM.
Discussion
These findings show the existence of two distinct forms of iLTD induced at up and down states, implicating voltage state transitions in neural circuit sculpting (see Supplemental Fig. 8). We conclude that up state iLTD is 2-AG-mediated and L-type VGCC-dependent, though our data clearly show that in the presence of nifedipine iLTD is induced when MSNs are voltage clamped at −60 mV. We reason that nifedipine application “unmasks” the (putatively) AEA-mediated iLTD form normally seen only in the down state, as it is THL insensitive, CB1-dependent, and occurs in approximately half of all MSNs. Nifedipine “unmasking” of the down state form of iLTD was observed across various induction protocols, including LFS, HFS, and glutamate uncaging, and supports the finding that postsynaptic calcium chelation fails to completely block up state iLTD. Our findings with nifedipine indicate that down state iLTD is not state-specific per se, as it can occur at any membrane voltage (−60 mV or −80 mV) if the L-type VGCC is not active, which would most often be a hyperpolarized, down state potential under physiological conditions. In contrast, up state iLTD conforms to the definition of “state-specific” as induction requires activation of a VGCC. Importantly, neither iLTD form can be induced by activation of MSN-MSN nor FSI-MSN synapses alone.
Given the direct pathway specificity of 2-AG-independent iLTD, it is perhaps surprising that the magnitude of depression revealed in the presence of nifedipine at −60 mV is similar to that of the 2-AG-mediated up state iLTD (Fig. 1d). However, supplemental figure 5 and figure 3 clearly show that the magnitude of depression can be quite strong in subsets of rat MSNs and in mouse direct pathway MSNs. It is unlikely that this magnitude variability results from insufficient voltage clamp at distal dendrites since down state iLTD was only observed in GFP-positive MSNs from D1-GFP slices. This indicates that distal dendrites were clamped at least at potentials more hyperpolarized than that necessary for up state iLTD induction. Moreover, both forms of iLTD have similar properties when evoked with LFS in high or low intracellular chloride conditions or when induced by glutamate uncaging under conditions that produced no detectable postsynaptic current. Thus, the balance of direct and indirect pathway MSNs sampled during experiments on rat tissue affect the magnitude of IPSC amplitude depression observed following down state iLTD induction.
Combined with the finding that L-type VGCCs in MSNs are activated at voltages near the up state26, our data provide evidence that voltage states allow direct pathway MSNs to control which presynaptic inhibitory microcircuit populations are selected for iLTD. The conclusion that differential eCB release from MSNs may contribute to input and output-selective control of MSNs is supported by the loss of depolarization-induced suppression of inhibition (DSI) in striatal MSNs in DAG lipase alpha knockout mice27, the NAPE-PLD expression in striatum as evidenced here and elsewhere28, the expression of FAAH in striatum29, 30, 31, 32, 33, 34 and the evidence for 2-AG and AEA co-release from single neurons, including MSNs35, 36. Based on our experiments using postsynaptic loading of cell impermeant BAPTA, it is reasonable to conclude that 2-AG is liberated from postsynaptic MSNs during up state iLTD, while the URB597 and JNJ1661010 internal solution experiments suggest that the down state iLTD signaling molecule (putatively AEA) is also liberated from the recorded MSN. It is possible that FAAH inhibitors diffuse to other possible sources of AEA release, such as glia or presynaptic terminals. However, since up and down state iLTD is governed by postsynaptic membrane voltage alone, any recruitment of extra-postsynaptic sources of AEA are likely to be achieved through a mechanism secondary to a postsynaptic voltage transition.
The MSN-MSN synapse specificity of up state iLTD is likely explained by the subcellular expression pattern of DAG lipase, which is restricted to MSN dendritic arbors7, 37. The restriction of FSI terminals onto MSN somata and nearby dendrites8, 20, 21, 22, 23, 24 appears to explain why the 2-AG-dependent, up state form of iLTD does not affect FSI-MSN synapses. However, it is known that FSI-MSN inputs can be depressed by eCB action following a DSI protocol38, and that striatal DSI (single neuron recordings) is lost in DAG lipase alpha knockout mice, suggesting that FSI-MSN DSI is 2-AG mediated27. This would seem contradictory to our finding that the 2-AG-mediated up state iLTD does not occur at FSI-MSN synapses. However, the strong depolarization in the DSI protocol likely contributes to a much greater activation of calcium channels than does LFS, which involves membrane voltage maintenance at the L-type VGCC activation potential range. Thus, DSI induction could promote excessive spread of 2-AG, possibly beyond the DAG lipase-localized MSN dendritic compartment.
The selection of MSN-MSN or FSI-MSN circuits for iLTD likely interacts with the different roles for these synaptic populations in modulating striatal output. A single MSN provides only 1–3 synapses to another MSN dendrite, but an estimated 475 MSNs synapse onto one MSN8. This suggests that a MSN-MSN synapse, or pattern of synapses, may provide a highly spatially resolved modulatory partner(s) of neighboring cortico/thalamostriatal synapses. Thus, when glutamatergic drive and local dendritic depolarization/activation of L-type VGCCs induces up state iLTD of a MSN-MSN synapse, a lasting enhancement of local excitatory postsynaptic potentials may ensue. Such dendritic heterogeneity within and across MSNs may contribute to the observed desynchronized firing of MSNs that are locked in the same voltage oscillatory phase, a mechanism that is proposed to increase information storage capacity39.
Though much fewer in number than MSNs, an estimated 1–4 FSIs synapse onto a given MSN, and each FSI is calculated to form roughly 50–175 synapses onto one MSN soma and proximal dendrites providing a powerful inhibition of MSN output8, 40, 41. This could allow for down state iLTD, which depresses MSN and FSI inputs onto direct pathway MSNs, to potently generate the “go signal” thought to encode action reinforcement and habit learning, a CB1-dependent complex motor learning behavior2. Of course, this form of plasticity may also be involved in motor learning not associated with habits, per se. Given that both types of iLTD are dopamine independent, these forms of plasticity might be involved in late stage motor learning or action refinement, when phasic dopamine firing diminishes42.
The particular conditions under which down state iLTD may be induced in vivo likely depend on vigilance state. During waking conditions, down state iLTD induction could occur in inactive direct pathway MSNs dwelling at down state resting potentials. This could, in turn, increase the downstream signaling probability of these neurons. Regular and distinct MSN membrane voltage oscillations are observed during slow-wave sleep in vivo12. Thus, in light of our findings showing that up and down state iLTDs are inducible by a voltage oscillation and stimulation timing-dependent protocol, iLTD induction during such conditions may be a mechanism underlying slow-wave sleep augmentation of action consolidation43.
Methods
Animals
Male and female Sprague Dawley rats (Charles River) were used for characterization of up and down state iLTD and group housed in groups of at least four. Two to four month-old male and female RGS9-cre (C57B6j)44 and PV-cre (C57B6j)45 mice were used for viral-mediated expression of ChR2 in MSNs and FSIs, respectively. All mice were group housed in groups of two to four on a 12 hour light/dark cycle (lights off at 6 PM) with food and water available ad libitum. To selectively ablate CB1 from MSNs or FSIs, we crossed homozygous floxed CB1 mice (C57B6j)46 with RGS9-cre and PV-cre mice, respectively. For anatomical characterization of cre expression, RGS9-cre and PV-cre mice were crossed with mice expressing mRFP flanked by a floxed/stop sequence upstream to a GFP sequence all driven under the chicken β-actin promoter (CAG), referred to as CAG/mRFP/GFP mice (C57B6j)45. All mouse strains, including FAAH knockout (generously provided by Dr. Pal Pacher)47 and TRPV1 knockout mice48 (Jackson Laboratories) were on a C57B6J background, with the exception of the D1-GFP strain on a Swiss Webster background. All mice were bred homozygously for the allele of interest. All procedures were performed under the guidelines of the US National Institutes of Health Guide to the Care and Use of Laboratory Animals and approved by the NIAAA animal care and use committee.
Brain Slice Preparation
Following isoflurane anesthetization of p13–20 rats, or p14–50 wild-type or transgenic mice, brains were removed and 250–300 μm-thick coronal sections through the striatum were prepared in carbogen-bubbled, ice-cold modified artificial cerebral spinal fluid (aCSF) containing (in mM): 194 sucrose, 30 NaCl, 4.5 KCl, 1 MgCl2, 26 NaHCO3, 1.2 NaH2PO4, and 10 glucose. Sections were equilibrated for 30–60 min at 33° C in carbogen-bubbled aCSF containing (in mM): 124 NaCl, 4.5 KCl, 2 CaCl2, 1 MgCl2, 26 NaHCO3, 1.2 NaH2PO4, and 10 glucose. Sections were subsequently incubated in the same solution at room temperature until hemisections were transferred to the recording chamber. Hemisections were perfused with aCSF containing 5 μM NBQX and 50 μM AP5 in all experiments with the exception of the voltage oscillation and stimulation-timing experiments.
Whole-Cell Voltage and Current Clamp Recordings
All whole-cell recordings were performed between 29° and 31° C. To record IPSCs in voltage clamp mode, recording pipettes of 2–4 mΩ resistance were filled with a CsCl-based internal solution of 300–310 mOsm, pH 7.3, and containing (in mM); 150 CsCl, 10 HEPES, 2 MgCl2, 0.3 Na-GTP, 5 QX-314, 3 Mg-ATP, and 0.2 BAPTA. When indicated we also used a “low chloride” CsMeSO3-based internal solution of 300–310 mOsm, pH 7.3, and containing (in mM): 114 CsMeSo3, 5 NaCl, 1 TEA-Cl, 10 HEPES, 5 QX-314, 1.1 EGTA, 0.3 Na-GTP, 4 Mg-ATP. To record light-induced action potentials in current clamp mode, recording pipettes were filled with a potassium-based solution of 300 mOsm, pH 7.3, and containing (in mM); 126 K-gluconate, 4 KCl, 10 HEPES, 4 ATP-Mg, 0.3 GTP-Na, 10 phosphocreatine. Recordings were filtered at 2 kHz and digitized at 10 kHz. Clampex 10.3 software controlling an isolation unit connected to a concentric bipolar stimulating electrode placed in the dorsolateral striatum was used to deliver pulses of 10 to 100 μA amplitude and 40 to 60 μs in duration. Experiments were discarded if series resistance varied by more than 15% or increased over 25 MΩ as previously described49.
iLTD induction
Striatal MSNs were held at −60 mV following achievement of the whole-cell configuration using a Multiclamp 700a amplifier. Baseline and post induction test pulse frequency was 0.05 Hz. To induce up state iLTD, a holding potential of −60 mV was maintained and a low frequency stimulus (LFS) train consisting of 1 Hz for 80 s, or a high frequency stimulus (HFS) train of 100 Hz for 10 s was delivered. For down state iLTD, two methods were used for induction: 1) The first method involved recording baseline IPSCs at a holding potential of −60 mV, followed by a ramping down of holding potential to −80 mV in −4 mV increments over 20 s. Once a −80 mV holding potential was achieved, the LFS/HFS stimulation train of 1 Hz for 80 s was delivered. Following the 80 s epoch, the holding potential was ramped up to −60 mV in +4 mV increments over 1 min. IPSCs were recorded for the remainder of the session at a holding potential of −60 mV. 2) Alternatively, the cell was held at a −80 mV holding potential for the duration of the recording session, including baseline, LFS/HFS delivery, and post LFS/HFS delivery IPSC recording. The results using both approaches were indistinguishable.
Up state iLTD was also induced by photolysis of MNI-L-glutamate (400 μM) using 5 ms pulses of 380 nm light at a frequency of 1 Hz for 40 s while holding MSNs at a −60 mV holding potential throughout the entire experiment. 380 nm light was delivered through the epifluorescence light path using a mercury bulb lamp, a Chroma Technologies filter cube (380 ± 10 nm), a 40x/0.80 NA immersion objective and a Uniblitz shutter system (Vincent Associates). In other experiments, a 1 Hz 80 s light pulse (5 ms) induction protocol was delivered instead of using the electrical stimulating electrode. In these experiments, baseline and post induction test pulses were optogenetically-induced at a frequency of 0.05 Hz.
A stimulation and voltage-timing dependent protocol was also used to induce up or down state iLTD. Up state iLTD induction involved postsynaptic current injection of a modified cosine wave function to induce the membrane voltage to oscillate between −60 mV and −80 mV. The modification of the cosine function was a sustained plateau lasting 0.5 s at −60 mV. The period of this modified cosine wave was 1.5 s. Epochs of 30 electrical stimulation pulses at 30 Hz were delivered (for 1 s) starting at the transition to −60 mV and terminating at the end of the −60 mV plateaus. This process was repeated 120 times. For down state iLTD, the postsynaptic current injection protocol was inverted (wave period of 1.5 s), resulting in a 0.5 s plateau at −80 mV. Epochs of 30 pulses at 30 Hz electrical stimulation were delivered starting at the beginning of the −80 mV plateaus and ending at the termination of the transition to the −60 mV peaks, repeated 120 times. Clampex 10.3 software was used to program all protocols.
Optogenetics
RGS9-cre or PV-cre mice were anesthetized with isoflurane and stereotaxically injected with 300 nL/striatal side of an AAV vector containing a double floxed, inverted open reading frame for ChR2 and mCherry driven by an EF-1a promoter (Upenn Vector Core). Striatal coordinates relative to bregma were (in mm): AP: +0.6; ML: ± 2.3; DV: −3.2. A survival period of at least 14 days was allowed before brains were dissected for electrophysiological recordings. A CrystaLaser CL series 473 nm blue laser (< 500 mW) was coupled to a fiber optic cable mounted on a micromanipulator with the tip placed within 1 mm of the slice or blue light was again delivered through the epifluorescence light path using a mercury bulb lamp, a Chroma Technologies filter cube (470 ± 20 nm), a 40x/0.80 NA immersion objective and a Uniblitz shutter system to activate ChR2. Regardless of light application method, the slice was always field illuminated. The exposure time of blue light used to generate IPSCs ranged from 500 μs to 5 ms. The order of test pulse eIPSCs and oIPSCs was alternated with each recorded neuron and iLTD was always induced electrically using the stimulating electrode. The eIPSC amplitude was always set higher than the oIPSC amplitude to better insure that electrical stimulation was recruiting the same presynaptic terminals that were activated by blue light. Test pulses were delivered at a frequency of 0.05 Hz with a 500 ms inter-pulse interval.
To insure that recordings were not performed in MSNs expressing ChR2 (particularly for RGS9-cre mice) we placed the stimulating electrode within the mCherry-positive expression zone in the striatum and situated the recording electrode outside of this area (see Fig. 5a). To further reduce the possibility of recording from ChR2-expressing MSNs, bicuculline was superfused onto the slice after the experiment was finished. If the observed current was not completely blocked (indicating presence of ChR2-mediated current), the data were discarded.
Immunohistochemistry
Mice were perfused with room temperature phosphate buffered saline (pH 7.3) followed by ice-cold 4% paraformaldehyde in phosphate buffered saline. Brains were removed and placed in ice-cold paraformaldehyde overnight. Coronal sections through the striatum were cut at a thickness of 45 μm on a vibratome. CAG/mRFP/GFP mice were used as reporter mice to demonstrate the distribution of cre expression in either the RGS9-cre or PV-cre lines. For double labeling using these reporter mice, heat denaturation (90°C) in phosphate buffered saline (pH 6.2) for 15 minutes was used to fully dampen the constitutive mRFP signal. Rabbit anti-PV (1:3000, SWANT, catalog number PV 25), rabbit anti-NAPE-PLD (1:100, Sigma, catalog number SAB2103842), and chicken anti-GFP (1:3000, Abcam, catalog number ab13970) primary antibodies were used followed by Cyanine (Cy3)-conjugated donkey anti-rabbit IgG (1:1000, Jackson ImmunoResearch, catalog number 711-165-152) or AlexaFluor 488-conjugated donkey anti-chicken IgG (1:1000, Jackson ImmunoResearch, catalog number 703-545-155) secondary antibodies according to protocols previously used50. A Zeiss Axiovert 200 fluorescent microscope equipped with 5x/0.12 NA, 10x/0.3 NA, and 20x/0.8 nA objectives was used to image immunostained tissue. An Olympus MVX10 fluorescent dissection microscope equipped with a 0.63x/.15 NA lens was used for assessing viral infection in adjacent slices.
Statistics
Mean amplitude of eIPSCs and oIPSCs were measured using cursors in Clampfit 10.3 and the data were analyzed in GraphPad Prism (GraphPad Software). eIPSC and oIPSC amplitudes were averaged per minute and expressed as a percentage of average baseline amplitude. All data sets met normal distribution criteria and statistical tests were used accordingly. No statistical methods were used to pre-determine sample sizes but our sample sizes are similar to those reported in previous publications14. With the exception of genotype, animals were selected at random for all experiments. In all experiments, with the exception of the D1-GFP MSN vs. D1-GFP-negative MSN experiments, MSNs were randomly sampled. For electrophysiology experiments, n = cells, the ratio of cells/slice = 1, and the ratio of cells/animal ≤2. For all experiments, IPSC amplitudes at t = 25–30 min were used for comparison against baseline (t = 0–5 min), unless otherwise indicated, and variances between groups were not statistically different. The experimenter was not blinded to outcome. All replicates were biological. For all IPSC amplitude data set comparisons, a two-tailed unpaired student’s t-test was performed to analyze data sets. When indicated, a two-way ANOVA was used for multiple IPSC data set comparisons or a two-tailed Fisher’s exact test was used for assessing the likelihood of observing LTD (>15% of baseline IPSC amplitude depression) or no LTD (<15% of baseline IPSC amplitude depression).
Drugs
QX-314 was purchased from Sigma-Aldrich and URB597 was purchased from Enzo Life Sciences. Cell-impermeant BAPTA tetracesium salt (m.w. 1004.03) was purchased from Invitrogen. All other pharmacological agents were purchased from Tocris Bioscience.
Supplementary Material
Acknowledgments
We would like to thank Drs. Beat Lutz and Giovanni Marsicano for generously providing the floxed CB1 mouse, and Dr. Pal Pacher for providing FAAH knockout mice.
Footnotes
Author contributions
B.N.M and D.M.L designed experiments. B.N.M performed experiments and analyzed data. C.T. and N.T. generated PV-Cre and CAG/mRFP/GFP mouse lines. B.N.M. and D.M.L wrote the manuscript.
References
- 1.Yin HH, Knowlton BJ. Contributions of striatal subregions to place and response learning. Learn Mem. 2004;11:459–463. doi: 10.1101/lm.81004. [DOI] [PMC free article] [PubMed] [Google Scholar]
- 2.Hilário MR, Clouse E, Yin HH, Costa RM. Endocannabinoid signaling is critical for habit formation. Front Integr Neurosci. 2007;1 doi: 10.3389/neuro.07.006.2007. [DOI] [PMC free article] [PubMed] [Google Scholar]
- 3.Albin RL, Young AB, Penney JB. The functional anatomy of basal ganglia disorders. Trends Neurosci. 1989;12:366–375. doi: 10.1016/0166-2236(89)90074-x. [DOI] [PubMed] [Google Scholar]
- 4.Gerfen CR, Surmeier DJ. Modulation of striatal projection systems by dopamine. Annu Rev Neurosci. 2011;34:441–466. doi: 10.1146/annurev-neuro-061010-113641. [DOI] [PMC free article] [PubMed] [Google Scholar]
- 5.Mink JW. The Basal Ganglia and involuntary movements: impaired inhibition of competing motor patterns. Arch Neurol. 2003;60:1365–1368. doi: 10.1001/archneur.60.10.1365. [DOI] [PubMed] [Google Scholar]
- 6.Cui G, et al. Concurrent activation of striatal direct and indirect pathways during action initiation. Nature. 2013;49:238–42. doi: 10.1038/nature11846. [DOI] [PMC free article] [PubMed] [Google Scholar]
- 7.Uchigashima M, et al. Subcellular arrangement of molecules for 2-arachidonoyl-glycerol-mediated retrograde signaling and its physiological contribution to synaptic modulation in the striatum. J Neurosci. 2007;4:3663–3676. doi: 10.1523/JNEUROSCI.0448-07.2007. [DOI] [PMC free article] [PubMed] [Google Scholar]
- 8.Tepper JM, Koós T, Wilson CJ. GABAergic microcircuits in the neostriatum. Trends Neurosci. 2004;27:662–669. doi: 10.1016/j.tins.2004.08.007. [DOI] [PubMed] [Google Scholar]
- 9.Freiman I, et al. Analysis of the effects of cannabinoids on identified synaptic connections in the caudate-putamen by paired recordings in transgenic mice. J Physiol. 2006;75:789–806. doi: 10.1113/jphysiol.2006.114272. [DOI] [PMC free article] [PubMed] [Google Scholar]
- 10.Winters BD, et al. Cannabinoid receptor 1-expressing neurons in the nucleus accumbens. Proc Natl Acad Sci U S A. 2012;109:E2717–E2725. doi: 10.1073/pnas.1206303109. [DOI] [PMC free article] [PubMed] [Google Scholar]
- 11.Wilson CJ, Kawaguchi Y. The origins of two-state spontaneous membrane potential fluctuations of neostriatal spiny neurons. J Neurosci. 1996;16:2397–2410. doi: 10.1523/JNEUROSCI.16-07-02397.1996. [DOI] [PMC free article] [PubMed] [Google Scholar]
- 12.Mahon S, et al. Distinct patterns of striatal medium spiny neuron activity during the natural sleep-wake cycle. J Neurosci. 2006;29:12587–12595. doi: 10.1523/JNEUROSCI.3987-06.2006. [DOI] [PMC free article] [PubMed] [Google Scholar]
- 13.Plenz D, Kitai ST. Up and down states in striatal medium spiny neurons simultaneously recorded with spontaneous activity in fast-spiking interneurons studied in cortex-striatum-substantia nigra organotypic cultures. J Neurosci. 1998;18:266–283. doi: 10.1523/JNEUROSCI.18-01-00266.1998. [DOI] [PMC free article] [PubMed] [Google Scholar]
- 14.Adermark L, Lovinger DM. Combined activation of L-type Ca2+ channels and synaptic transmission is sufficient to induce striatal long-term depression. J Neurosci. 2007;27:6781–6787. doi: 10.1523/JNEUROSCI.0280-07.2007. [DOI] [PMC free article] [PubMed] [Google Scholar]
- 15.Xu W, Lipscombe D. Neuronal Ca(V)1.3alpha(1) L-type channels activate at relatively hyperpolarized membrane potentials and are incompletely inhibited by dihydropyridines. J Neurosci. 2001;21:5944–5591. doi: 10.1523/JNEUROSCI.21-16-05944.2001. [DOI] [PMC free article] [PubMed] [Google Scholar]
- 16.Adermark L, Lovinger DM. Frequency-dependent inversion of net striatal output by endocannabinoid-dependent plasticity at different synaptic inputs. J Neurosci. 2009;29:1375–1380. doi: 10.1523/JNEUROSCI.3842-08.2009. [DOI] [PMC free article] [PubMed] [Google Scholar]
- 17.Maejima T, et al. Synaptically driven endocannabinoid release requires Ca2+-assisted metabotropic glutamate receptor subtype 1 to phospholipase Cbeta4 signaling cascade in the cerebellum. J Neurosci. 2005;25:6826–6835. doi: 10.1523/JNEUROSCI.0945-05.2005. [DOI] [PMC free article] [PubMed] [Google Scholar]
- 18.Plenz D. When inhibition goes incognito: feedback interaction between spiny projection neurons in striatal function. Trends Neurosci. 2003;26:436–443. doi: 10.1016/S0166-2236(03)00196-6. [DOI] [PubMed] [Google Scholar]
- 19.Bracci E, Panzeri S. Excitatory GABAergic effects in striatal projection neurons. J Neurophysiol. 2006;95:1285–1290. doi: 10.1152/jn.00598.2005. [DOI] [PubMed] [Google Scholar]
- 20.Wilson CJ, Groves PM. Fine structure and synaptic connections of the common spiny neuron of the rat neostriatum: a study employing intracellular inject of horseradish peroxidase. J Comp Neurol. 1980;194:599–615. doi: 10.1002/cne.901940308. [DOI] [PubMed] [Google Scholar]
- 21.Kita H, Kosaka T, Heizmann CW. Parvalbumin-immunoreactive neurons in the rat neostriatum: a light and electron microscopic study. Brain Res. 1990;536:1–15. doi: 10.1016/0006-8993(90)90002-s. [DOI] [PubMed] [Google Scholar]
- 22.Bennett BD, Bolam JP. Synaptic input and output of parvalbumin-immunoreactive neurons in the neostriatum of the rat. Neuroscience. 1994;62:707–719. doi: 10.1016/0306-4522(94)90471-5. [DOI] [PubMed] [Google Scholar]
- 23.Bolam JP, Hanley JJ, Booth PA, Bevan MD. Synaptic organisation of the basal ganglia. J Anat. 2000;196:527–542. doi: 10.1046/j.1469-7580.2000.19640527.x. [DOI] [PMC free article] [PubMed] [Google Scholar]
- 24.Kubota Y, Kawaguchi Y. Dependence of GABAergic synaptic areas on the interneuron type and target size. J Neurosci. 2000;20:375–386. doi: 10.1523/JNEUROSCI.20-01-00375.2000. [DOI] [PMC free article] [PubMed] [Google Scholar]
- 25.Koós T, Tepper JM. Inhibitory control of neostriatal projection neurons by GABAergic interneurons. Nat Neurosci. 1999;2:467–472. doi: 10.1038/8138. [DOI] [PubMed] [Google Scholar]
- 26.Carter AG, Sabatini BL. State-dependent calcium signaling in dendritic spines of striatal medium spiny neurons. Neuron. 2004;44:483–493. doi: 10.1016/j.neuron.2004.10.013. [DOI] [PubMed] [Google Scholar]
- 27.Tanimura A, et al. The endocannabinoid 2-arachidonoylglycerol produced by diacylglycerol lipase alpha mediates retrograde suppression of synaptic transmission. Neuron. 2010;65:320–327. doi: 10.1016/j.neuron.2010.01.021. [DOI] [PubMed] [Google Scholar]
- 28.Egertová M, Simon GM, Cravatt BF, Elphick MR. Localization of N-acyl phosphatidylethanolamine phospholipase D (NAPE-PLD) expression in mouse brain: A new perspective on N-acylethanolamines as neural signaling molecules. J Comp Neurol. 2008;506:604–615. doi: 10.1002/cne.21568. [DOI] [PubMed] [Google Scholar]
- 29.Tsou K, et al. Fatty acid amide hydrolase is located preferentially in large neurons in the rat central nervous system as revealed by immunohistochemistry. Neurosci Lett. 1998;254:137–140. doi: 10.1016/s0304-3940(98)00700-9. [DOI] [PubMed] [Google Scholar]
- 30.Malone DT, Kearn CS, Chongue L, Mackie K, Taylor DA. Effect of social isolation on CB1 and D2 receptor and fatty acid amide hydrolase expression in rats. Neuroscience. 2008;152:265–272. doi: 10.1016/j.neuroscience.2007.10.043. [DOI] [PMC free article] [PubMed] [Google Scholar]
- 31.Egertová M, Cravatt BF, Elphick MR. Comparative analysis of fatty acid amide hydrolase and cb(1) cannabinoid receptor expression in the mouse brain: evidence of a widespread role for fatty acid amide hydrolase in regulation of endocannabinoid signaling. Neuroscience. 2003;119:481–496. doi: 10.1016/s0306-4522(03)00145-3. [DOI] [PubMed] [Google Scholar]
- 32.Egertová M, Giang DK, Cravatt BF, Elphick MR. A new perspective on cannabinoid signalling: complementary localization of fatty acid amide hydrolase and the CB1 receptor in rat brain. Proc Biol Sci. 1998;265:2081–2085. doi: 10.1098/rspb.1998.0543. [DOI] [PMC free article] [PubMed] [Google Scholar]
- 33.Maccarrone M, et al. Levodopa treatment reverses endocannabinoid system abnormalities in experimental parkinsonism. J Neurochem. 2003;85:1018–1025. doi: 10.1046/j.1471-4159.2003.01759.x. [DOI] [PubMed] [Google Scholar]
- 34.Maccarrone M, et al. Anandamide inhibits metabolism and physiological actions of 2-arachidonoylglycerol in the striatum. Nat Neurosci. 2008;11:152–159. doi: 10.1038/nn2042. [DOI] [PubMed] [Google Scholar]
- 35.Puente N, et al. Polymodal activation of the endocannabinoid system in the extended amygdala. Nat Neurosci. 2011;14:1542–1547. doi: 10.1038/nn.2974. [DOI] [PubMed] [Google Scholar]
- 36.Lerner TN, Kreitzer AC. RGS4 Is Required for Dopaminergic Control of Striatal LTD and Susceptibility to Parkinsonian Motor Deficits. Neuron. 2012;73:347–359. doi: 10.1016/j.neuron.2011.11.015. [DOI] [PMC free article] [PubMed] [Google Scholar]
- 37.Yoshida T, et al. Localization of diacylglycerol lipase-alpha around postsynaptic spine suggests close proximity between production site of an endocannabinoid, 2-arachidonoyl-glycerol, and presynaptic cannabinoid CB1 receptor. J Neurosci. 2006;26:4740–4751. doi: 10.1523/JNEUROSCI.0054-06.2006. [DOI] [PMC free article] [PubMed] [Google Scholar]
- 38.Narushima M. Depolarization-induced suppression of inhibition mediated by endocannabinoids at synapses from fast-spiking interneurons to medium spiny neurons in the striatum. Eur J Neurosci. 2006;24:2246–2252. doi: 10.1111/j.1460-9568.2006.05119.x. [DOI] [PubMed] [Google Scholar]
- 39.Stern EA, Jaeger D, Wilson CJ. Membrane potential synchrony of simultaneously recorded striatal spiny neurons in vivo. Nature. 1998;394:475–478. doi: 10.1038/28848. [DOI] [PubMed] [Google Scholar]
- 40.Wilson CJ. GABAergic inhibition in the neostriatum. Prog Brain Res. 2007;160:91–110. doi: 10.1016/S0079-6123(06)60006-X. [DOI] [PubMed] [Google Scholar]
- 41.Koós T, Tepper JM, Wilson CJ. Comparison of IPSCs evoked by spiny and fast-spiking neurons in the neostriatum. J Neurosci. 2004;24:7916–7922. doi: 10.1523/JNEUROSCI.2163-04.2004. [DOI] [PMC free article] [PubMed] [Google Scholar]
- 42.Schultz W, Apicella P, Ljungberg T. Responses of monkey dopamine neurons to reward and conditioned stimuli during successive steps of learning a delayed response task. J Neurosci. 1993;3:900–913. doi: 10.1523/JNEUROSCI.13-03-00900.1993. [DOI] [PMC free article] [PubMed] [Google Scholar]
- 43.Watts A, Gritton HJ, Sweigart J, Poe GR. Antidepressant Suppression of Non-REM Sleep Spindles and REM Sleep Impairs Hippocampus-Dependent Learning While Augmenting Striatum-Dependent Learning. J Neurosci. 2012;32:13411–13420. doi: 10.1523/JNEUROSCI.0170-12.2012. [DOI] [PMC free article] [PubMed] [Google Scholar]
- 44.Dang MT, et al. Disrupted motor learning and long-term synaptic plasticity in mice lacking NMDAR1 in the striatum. Proc Natl Acad Sci U S A. 2006;103:15254–15259. doi: 10.1073/pnas.0601758103. [DOI] [PMC free article] [PubMed] [Google Scholar]
- 45.Tanahira C, et al. Parvalbumin neurons in the forebrain as revealed by parvalbumin-Cre transgenic mice. Neurosci Res. 2009;63:213–223. doi: 10.1016/j.neures.2008.12.007. [DOI] [PubMed] [Google Scholar]
- 46.Marsicano G, et al. CB1 cannabinoid receptors and on-demand defense against excitotoxicity. Science. 2003;302:84–88. doi: 10.1126/science.1088208. [DOI] [PubMed] [Google Scholar]
- 47.Cravatt BF, et al. Supersensitivity to anandamide and enhanced endogenous cannabinoid signaling in mice lacking fatty acid amide hydrolase. Proc Natl Acad Sci U S A. 2001;98:9371–9376. doi: 10.1073/pnas.161191698. [DOI] [PMC free article] [PubMed] [Google Scholar]
- 48.Caterina MJ, et al. Impaired nociception and pain sensation in mice lacking the capsaicin receptor. Science. 2000;288:306–313. doi: 10.1126/science.288.5464.306. [DOI] [PubMed] [Google Scholar]
- 49.Mathur BN, Capik NA, Alvarez VA, Lovinger DM. Serotonin induces long-term depression at corticostriatal synapses. J Neurosci. 2011;31:7402–7411. doi: 10.1523/JNEUROSCI.6250-10.2011. [DOI] [PMC free article] [PubMed] [Google Scholar]
- 50.Mathur BN, Deutch AY. Rat meningeal and brain microvasculature pericytes co-express the vesicular glutamate transporters 2 and 3. Neurosci Lett. 2008;435:90–94. doi: 10.1016/j.neulet.2008.01.082. [DOI] [PMC free article] [PubMed] [Google Scholar]
Associated Data
This section collects any data citations, data availability statements, or supplementary materials included in this article.