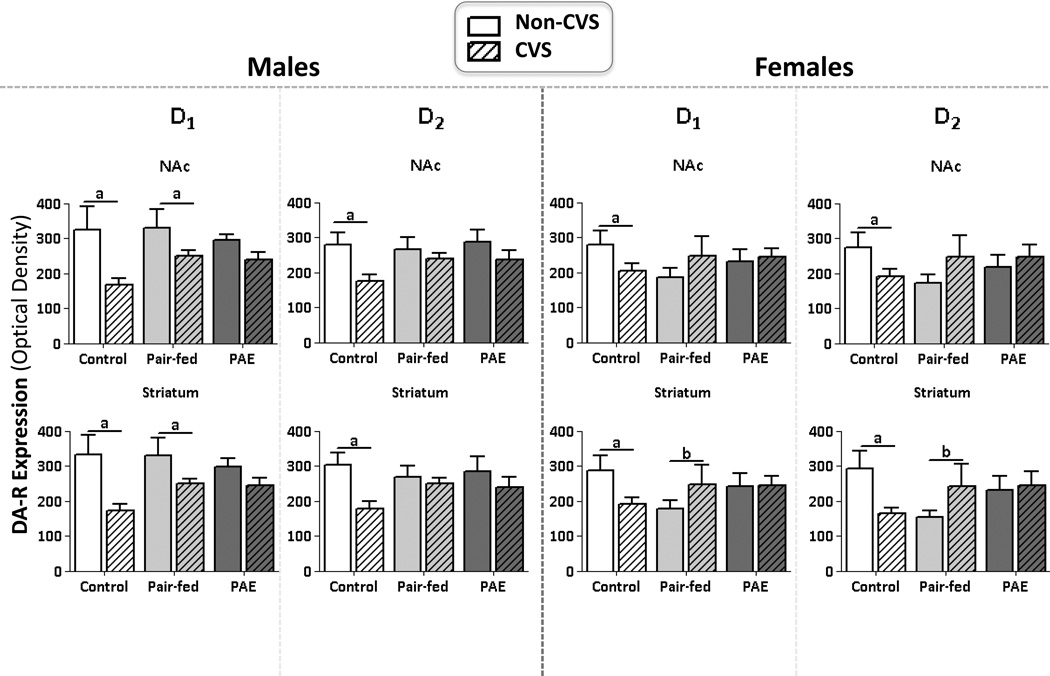
Figure 3. DA-R expression.
Mean ±SEM. Optical densities of D1 & D2 expression was measured 24 hrs following last day of CVS in males and females. The core subregion of the nucleus accumbens core (parallel effects in the shell subregion not shown): anon-CVS>CVS in C and PF, but not PAE males and females. The striatum: anon-CVS>CVS in C but not PAE males and females; bCVS>non-CVS in PF females.

