

Abstract
Objective
To investigate the effects of localized cooling and cooling rate on pressure-induced ischemia for people with and without neurological deficits.
Design
A 2 × 3 mixed factorial design with two groups: (1) people with spinal cord injury (SCI) and (2) people without neurological deficits (control), and three test conditions: (1) pressure only, (2) pressure with fast cooling (−4°C/min), and (3) pressure with slow cooling (−0.33°C/min).
Setting
University laboratory.
Participants
Fourteen controls and 14 individuals with SCI.
Interventions
Pressure on the sacrum was 0.4 kPa for 5 minutes, then 8 kPa for 20 minutes, and finally 0.4 kPa for 15 minutes. Fast and slow cooling to 25°C applied during 8 kPa of pressure.
Outcome measures
Reactive hyperemia and its spectral densities in the metabolic, neurogenic, and myogenic frequency ranges.
Results
In controls, reactive hyperemia was greater in pressure only as compared with both cooling conditions. No change was noted in all spectral densities in both cooling conditions, and only neurogenic spectral density increased without cooling. In subjects with SCI, no difference was noted in reactive hyperemia among conditions. However, metabolic and myogenic spectral densities increased without cooling and all spectral densities increased with slow cooling. No change was noted in all spectral densities with fast cooling.
Conclusion
Local cooling reduced the severity of ischemia in controls. This protective effect may be masked in subjects with SCI due to chronic microvascular changes; however, spectral analysis suggested local cooling may reduce metabolic vasodilation. These findings provide evidence towards the development of support surfaces with temperature control for weight-bearing soft tissues.
Keywords: Pressure ulcer, Spinal cord injuries, Induced hypothermia, Laser-Doppler flowmetry, Skin temperature, Ischemia, Reactive hyperemia
Introduction
Background
Prolonged pressure-induced tissue ischemia is a major pathway to pressure ulcer development.1 Pressure redistribution using specially designed support surfaces is the primary approach to lowering a person's risk of developing a pressure ulcer. However, in many situations, the pressure redistribution needed to maintain adequate blood blow and nutrient supply could not be achieved. Controlling temperature to reduce the demand for nutrients when they are limited is a potential adjunct prevention strategy. The effect of increased skin temperature on ulcer formation was first introduced through animal studies.2–4 Studies on swine found that higher skin temperature not only caused more severe tissue damage under the same amount and duration of localized pressure,2 it also required a shorter amount of time to cause the same severity of tissue damage under the equivalent amount of localized pressure.3 Since the tissue metabolic rate increases 6–13% per °C in human,5 it is suspected that increased skin temperature might shorten the time from the beginning of tissue ischemia to actual tissue breakdown.2
Cooling of the skin has a metabolic-arresting effect that reduces tissue metabolic demand,6 and causes vasoconstriction7 that decreases the rate of free diffusion based on the Strokes-Einstein theory.8 Although vasoconstriction reduces blood flow by decreasing the diameter of the vessels and may offset the benefit of reduced metabolic demand, we believe that local cooling is more beneficial than harmful during weight-bearing conditions for two reasons. First, the blood vessels may be completely occluded during weight bearing, thus eliminating the effect of vasoconstriction. Second, for partially occluded blood vessels, the percent reduction in metabolism consumption is greater than the reduction in free diffusion rates for the same temperature decrease. For example, without externally applied pressure on the skin, a 1°C reduction in skin temperature may cause about a 10% reduction in metabolic rate in a human,5 while it would cause less than a 1% reduction in free diffusion due to the small changes in absolute temperature and viscosity at temperatures above 25°C.8,9 Since local tissue ischemia is unavoidable during most weight-bearing situations, local cooling may be a beneficial feature to help protect the tissue.
Local cooling interventions are well-known for protecting ischemic tissue in surgery procedures10–12 by reducing metabolic demand6 and minimizing ischemia-reperfusion injury.13 However, its application on pressure ulcer prevention is not fully explored in humans. The authors of the current paper previously investigated the effect of cooling on 10 young healthy adults by measuring reactive hyperemia (a normal physiological response of sudden increased blood flow upon release of tissue ischemia) using noninvasive laser Doppler flowmetry (LDF).4 Reactive hyperemia was induced with 60 mmHg of pressure for 30 minutes, and skin local cooling (25°C) was applied during this period of time. Our findings of decreased reactive hyperemia when skin local cooling occurred during ischemia suggested that the severity of ischemia was reduced with the application of local cooling.
Pressure ulcers are one of the most common secondary complications in people with spinal cord injury (SCI).14,15 A majority of people with SCI at T6 and above have decreased thermoregulatory control below the injury level due to impairments in autonomic function16 and/or sensation.7 Although there has been no direct linkage between thermoregulation and pressure ulcer formation in people with SCI, the decreased thermoregulatory control after injury may contribute to increased skin temperature while the skin is in close contact with support surfaces. Since our previous study demonstrated that the effect of cooling could be successfully examined noninvasively in humans,4 and another previous study found that a fast cooling rate (−4°C/min) may cause less vasoconstriction compared to a slower cooling rate (−0.33°C/min),17 the objective of this study was to investigate the effect of skin local cooling at two controlled cooling rates on tissue tolerance during prolonged pressure in people with and without SCI.
Specific aims and hypotheses
There were two specific aims of the study. The first was to investigate the skin blood flow response in weight-bearing sacral tissues of people with and without SCI, with and without cooling, and with cooling at two different rates. Reactive hyperemia was selected as the outcome measure. We hypothesized that (1) the reactive hyperemia is greater without cooling as compared to both fast and slow cooling in people with and without SCI; and (2) the reactive hyperemia is greater with slow cooling as compared to fast cooling in people with and without SCI.
The second specific aim was to investigate the underlying vascular control mechanism that responds to local cooling and pressure stimuli for people with and without SCI. The vascular response is mediated through different mechanisms (e.g. metabolic, neurogenic, and myogenic) with each affecting blood flow oscillations in near mutually exclusive frequency bands.18–20 By applying time-frequency analysis via the short-time Fourier transform (STFT) of the skin blood flow (SBF) signal, we were able to quantify the contribution of each control mechanism. We hypothesized that (3) the metabolic and myogenic spectral densities (magnitude square of STFT) increase significantly during reactive hyperemia in both groups without local cooling application, but do not increase with the two cooling applications; and (4) the neurogenic spectral density only increases significantly during reactive hyperemia for those without SCI when they do not receive cooling.
Methods
Design
This study used a 2 × 3 mixed factorial design. Two groups of subjects were recruited: (1) 14 people with SCI, and (2) 14 people without SCI (CTRL). Each subject was tested under three conditions: (1) pressure with fast cooling (−4°C/min) (PF), (2) pressure with slow cooling (−0.33°C/min) (PS), and (3) pressure with no cooling (PO).
Sample population
All subjects were recruited from the greater Pittsburgh area. The University of Pittsburgh Institutional Review Board approved the protocol. The inclusion criteria for people with SCI were injury level T6 or above, American Spinal Injury Association (ASIA) Impairment Scale grade A or B,21 non-ambulatory, with no sensation of temperature below the injury level and presence of at least one symptom of autonomic function impairment (autonomic dysreflexia, lack of awareness of need to empty bladder, and/or sensation of bowel movement). The exclusion criteria were cardiovascular or pulmonary diseases, diabetes, hypertension, or smokers who could not refrain from smoking for 4 hours prior to the experiment.
Instruments
An integrated test system developed in our previous pilot study4 was modified for use in this study (Fig. 1). The test system includes three major components: (1) computer-controlled indenter, (2) thermoelectric cooler, and (3) LDF system. One proportional-integral-derivative controller was used to adjust and maintain the pressure applied on the skin to within 10 mmHg of the target value and another was used to regulate the temperature to within 0.02°C of the target. The LDF system was used to measure the skin blood flow. The indenter surface had a circular area of 2.85 cm2. The LDF probe (∼2 mm diameter) was located in the center of the circular indenter surrounded by a cooling surface of 1.8 cm2.
Figure 1.
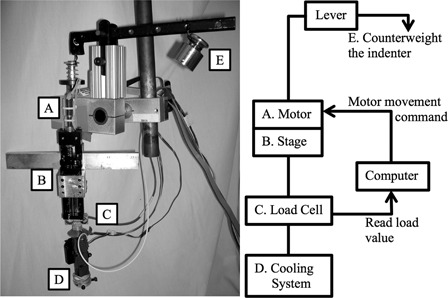
Integrated test system (A–D) and the counter weight (E).
Procedures
All procedures were performed at room temperature 22 ± 1°C. Demographic data (age, weight, and height), self-reported medical history (level and time since injury), blood pressure, heart rate, ASIA Impairment Scale,21 and autonomic function assessment forms22 were obtained upon consent to the study. Subjects were randomized into six different orders of the three test conditions to prevent an ordering effect. Subjects lay prone on a mat table throughout the test sessions, and the experiments took place on the skin in the sacral area. Each experimental condition took up to 40 minutes and was identical in pressure application phase – 0.4 kPa (3 mmHg) for 5 minutes, 8 kPa (60 mmHg) for 20 minutes, and 0.4 kPa for 10 minutes. The test conditions varied by the existence and the rate of local cooling during the 8-kPa-pressure application. Two washout periods (each for 30–60 minutes) were provided between test sessions. Participants were asked to lay prone on the mat table for 15 minutes before each test condition was performed to acclimate to the posture for testing. All three test conditions were performed on 1 day or on 2 days within 1 week depending on the scheduling needs of participants. Caffeinated food or drinks were refrained from for 12 hours prior to the experiment.
Data collection and processing
The pressure applied on the skin, skin temperature, and were collected at 20 Hz via a LabVIEW program (version 7.3, National Instrument, Austin, TX, USA). The SBF signal was then processed through two methods to calculate the time-domain parameters of reactive hyperemia and the spectral densities. The SBF signal was first digitally down-sampled to 0.5 Hz.
Fig. 2 is the SBF collected from one of the subjects and demonstrates the selection of each parameter. To select the time-domain parameters of reactive hyperemia, the down-sampled SBF signal was processed with a 10th order Chebyshev I low-pass filter (cutoff frequency 0.15 Hz) to eliminate the blood flow oscillation caused by heart rate and respiration; the signal then underwent a median filter (22-second window) to remove the artifacts of the signal caused by involuntary movement/spasticity of the subjects with SCI. To select the parameters objectively, the modified bi-exponential equation23 was used to fit the reactive hyperemic response on the SBF signal. A least-squares model fit was used to fit the bi-exponential curve
| 1 |
to the filtered SBF data to calculate the normalized peak SBF (maximum percent increase of SBF, where bSBF is the baseline SBF)
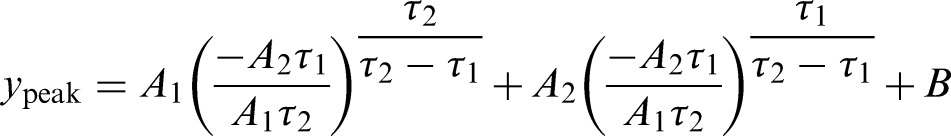 |
2 |
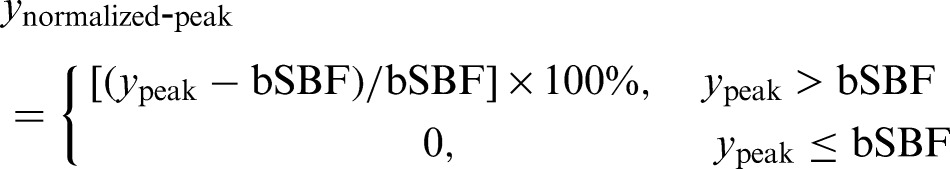 |
3 |
and perfusion area
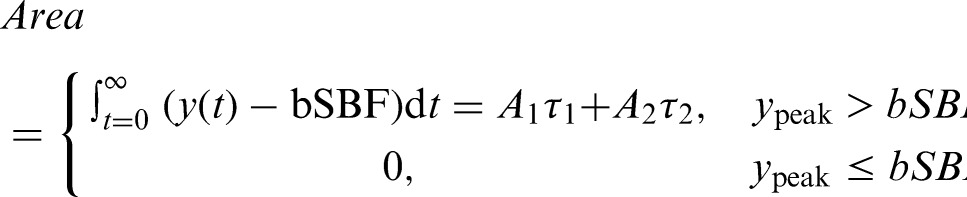 |
4 |
Figure 2.
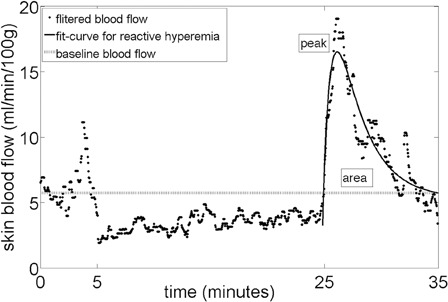
Reactive hyperemia time domain parameters selection.
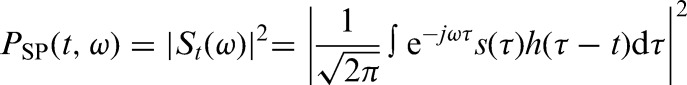
To calculate the spectral densities of the SBF data, a spectrogram (magnitude-square STFT, 512 second Hanning window) was computed on the down-sampled SBF data
 |
5 |
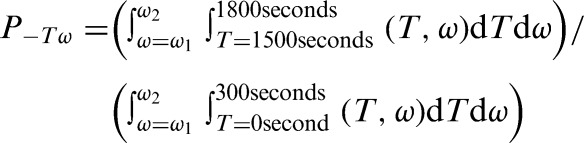
where St(ω) is the short-time Fourier transform (STFT) of the signal s(τ) computed with window h(τ). For statistical analysis, the spectral densities from three different frequency bands were integrated over the first five-minute interval of reactive hyperemia (time period 1500–1800 seconds) and normalized using values integrated over the five minutes of baseline (time period 0–300 seconds).
 |
6 |
Where ω1-ω2 represents the three frequency bands: metabolic (0.008–0.02 Hz), neurogenic (0.02–0.05 Hz), and myogenic (0.05–0.15 Hz) spectral densities. All SBF signal processing procedures were performed using the MatLab program (The MathWorks, Natick, MA, USA).
Data analysis
To ensure the repeatability of the instrument and the study protocol, two-way repeated measures analysis of variance was used to compare the differences in applied pressure, skin temperature, and baseline SBF among test conditions and subject groups. Due to the small sample size and the variation of the SBF data, non-parametric tests were used to test the hypotheses. To test the first two hypotheses, the Friedman test was used to compare the normalized peak SBF and perfusion area among the three test conditions, and pair-wise comparison with Bonferroni correction was used when there was a significant difference among test conditions. To test the other two hypotheses, Wilcoxon signed rank test was used to compare the difference in spectral densities during baseline and reactive hyperemia. SPSS for Mac (version 13, IBM Corp., Armonk, NY, USA) was used for all statistical analyses. Values of P < 0.05 were recognized as significant for all statistical results.
Results
Subjects
Twenty-eight adults were recruited for this study: 14 with SCI (1 female and 13 male) and 14 without neurological deficits (CTRL) (7 female and 7 male) (Table 1). For subjects with SCI, 11 had injury in the cervical region (C4–C8), and 3 had injury in the thoracic region (T4–T6). The averaged time since injury was 12.43 ± 9.32 years.
Table 1.
Summary of subjects' demographic data. The results were presented as mean ± one standard deviation
| Group | Number of subjects recruited | Gender | Age (years) | Body mass index (kg/m2) | Mean blood pressure (mmHg) |
|---|---|---|---|---|---|
| CTRL | 14 | 7 Male | 33.79 ± 11.12 | 22.79 ± 3.21 | 85.11 ± 8.20 |
| 7 Female | |||||
| SCI | 14 | 13 Male | 37.79 ± 10.96 | 22.30 ± 3.64 | 79.18 ± 8.37 |
| 1 Female |
SCI, spinal cord injury; CTRL, controls.
Instrumentation repeatability
Table 2 shows the instrumentation repeatability of pressure, temperature control, and based SBF. During the pressure phase of 60 mmHg, the pressure on the sacral skin was not significantly different within subject (P = 0.144) and between groups (P = 0.177). In controls, the skin cooled at 2.02 ± 0.67°C/minute with fast cooling and remained at 24.97 ± 0.02°C for 18.5 ± 0.3 minutes. The skin cooled at 0.25 ± 0.03°C/minute with slow cooling and remained at 25.00 ± 0.01°C for 9.9 ± 4.1 minutes. In people with SCI, the skin cooled at 1.75 ± 0.77°C/minute with fast cooling and remained at 24.97 ± 0.02°C for 18.4 ± 0.6 minutes. The skin cooled at 0.22 ± 0.04°C/minute with slow cooling and remained at 25.00 ± 0.01°C for 9.4 ± 5.5 minutes. At the end of the 60 mmHg of pressure, the skin temperature in the non-cooling test session was significantly greater than that in fast (P < 0.001) and slow cooling (P < 0.001). The skin temperature in slow cooling was also significantly greater than that in fast cooling (P < 0.001); however, the difference in temperature was smaller than 0.05°C. The baseline SBF was also not significantly different among test conditions (P = 0.530) and between groups (P = 0.146).
Table 2.
Instrumentation repeatability: pressure, temperature control, and baseline SBF
| Pressure phase of 60 mmHg (mmHg) | Temperature at the end of 60 mmHg (°C) | Baseline SBF (au) | ||
|---|---|---|---|---|
| CTRL | PO | 58.04 ± 2.46 | 28.10 ± 0.66 | 5.86 ± 3.14 |
| PS | 57.40 ± 1.50 | 25.00 ± 0.01 | 6.58 ± 3.43 | |
| PF | 57.30 ± 1.83 | 24.97 ± 0.02 | 6.78 ± 3.18 | |
| SCI | PO | 59.28 ± 4.74 | 27.86 ± 0.92 | 6.13 ± 3.34 |
| PS | 59.86 ± 4.31 | 25.00 ± 0.01 | 5.87 ± 2.85 | |
| PF | 58.85 ± 4.19 | 24.98 ± 0.02 | 5.85 ± 2.97 | |
SCI, spinal cord injury; CTRL, controls; PO, pressure only; PS, pressure with slow cooling; PF, pressure with fast cooling; au, arbitrary unit.
Normalized peak skin blood flow and perfusion area
Figs. 3 and 4 are the averaged reactive hyperemic response for each test condition for controls (Fig. 3) and people with SCI (Fig. 4). In controls, the normalized peak SBF was greater with non-cooling (117.15 ± 127.31%) as compared with both slow (47.06 ± 48.87%, P = 0.033) and fast cooling (43.80 ± 62.93%, P = 0.023) conditions; however, there was no significant difference between fast and slow cooling (P = 0.695). The perfusion area was also greater with non-cooling (261.94 ± 213.04 au-seconds) as compared with both slow (67.61 ± 78.30 au-seconds, P = 0.016) and fast cooling (101.13 ± 175.69 au-seconds, P = 0.023) conditions; however there was no significant difference between fast and slow cooling (P = 0.937). For people with SCI, there was no significant difference among test conditions for normalized peak SBF (fast: 82.27 ± 110.66, slow: 140.18 ± 139.02, non-cooling: 108.36 ± 90.04 %, P = 0.338) and perfusion area (fast: 212.11 ± 364.93, slow: 370.04 ± 378.42, non-cooling: 367.10 ± 300.51 au-seconds, P = 0.174).
Figure 3.
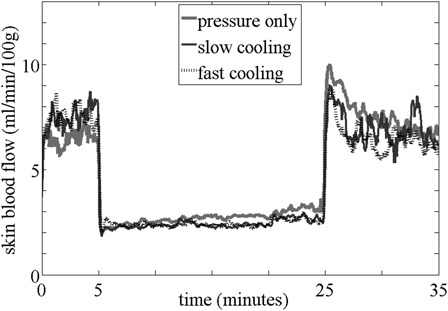
Averaged reactive hyperemic response in controls.
Figure 4.
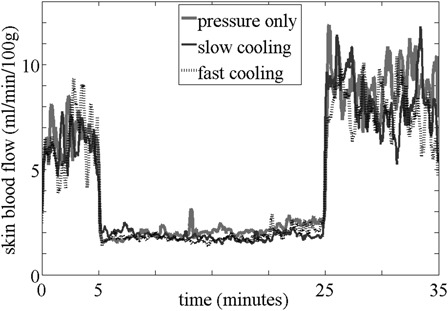
Averaged reactive hyperemic response in people with SCI.
Spectral density
Fig. 5 shows the box plots of the three spectral densities for all test conditions and subject groups. In the control group, only the neurogenic spectral density significantly increased in the pressure with no cooling condition. In subjects with SCI, the metabolic and myogenic spectral densities significantly increased in the pressure with no cooling condition, and all spectral densities significantly increased in the pressure with slow cooling condition.
Figure 5.
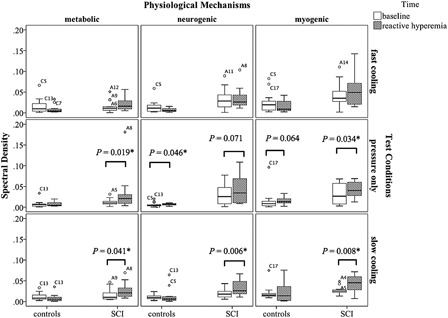
Box plots of spectral densities. The alphanumeric markings are outliers. Symbol * indicates statistically significant values.
Discussion
The phenomenon of reduced peak reactive hyperemia in the control group suggested that local cooling of the skin reduced the severity of tissue ischemia in people without neurological deficits.24 This finding is consistent with a previous swine coronary artery study, where mild cooling from 37 to 34°C reduced 43% of the peak reactive hyperemia.25 Perfusion area represents the total increase in SBF after tissue ischemia, and our results from the control group suggested that local cooling of the skin decreased metabolic repayment of the ischemic tissue in people without neurological deficits.26 Results from the neurogenic spectral density analysis suggested that sympathetic vasoconstriction dominated in regulating the skin blood flow during reactive hyperemia when no cooling intervention was applied. We did not find any increase in metabolic spectral density without cooling, and this may be due to other unknown mechanisms (possibly related to temperature changes) that were below the frequency band we analyzed. A study that discovered these low-frequency oscillations suggested that it could only be analyzed via wavelet transform, but not Fourier transform.27 We did not find any significant differences in reactive hyperemia between fast and slow cooling in people without neurological deficits. This may be because the initial vasodilation was diminished by the partial or total occlusion of blood vessels due to the applied pressure. In addition, the initial vasodilation may last for a comparatively short period of time during loading, since the duration of this vasodilation phase remained unknown.17
The phenomenon of decreased reactive hyperemic response with skin local cooling was not demonstrated in people with SCI. This may be because the reactive hyperemic response is reduced in people with chronic SCI. Previous studies found that the blood flow response in people with SCI had significantly lower normalized peak28 and perfusion area.29 The reduced reactive hyperemic response in chronic SCI may be caused by increased vascular resistance,30 impaired β-adrenergic vasodilation, reduced nitric oxide release or endothelial sensitivity to the nitric oxide.28 These microvascular changes may possibly contribute to the decreased vascular capacity of dilation26 and/or reduced sensitivity to tissue ischemia28 in people with SCI. Results from the metabolic spectral density suggested that there were more metabolic vasodilators accumulated in pressure only and pressure with slow cooling. Other spectral density results suggested that both the nerve mediated vasoconstriction and capillary smooth muscle contraction contribute to regulate the skin blood flow during pressure only and pressure with slow cooling, and the local nerve response and vascular control might be partially preserved in people with chronic SCI.31 Although the magnitude of reactive hyperemia did not reveal any changes due to the varying test conditions, spectral density data provided evidence of potential physiological changes with tissue ischemia and temperature intervention. Further investigation of the percentage of each control mechanism may be helpful to understand why the changes in the spectral density during reactive hyperemia were observed, yet this difference was not evident in the time domain parameters for people with SCI.
Limitations
There are three limitations of this study. First, medical history, smoking history and consumption of caffeinated food and beverages were self-reported. Second, since this is a non-invasive human study, we did not measure the exact metabolic substances (e.g. nitric oxide) or neurotransmitter that contributes to each of the vascular control mechanisms. However, alternative measurements using spectral analyses were performed in this study to investigate these mechanisms, and findings in people with SCI suggested that the add-on spectral analyses of the reactive hyperemic response are crucial to reach our conclusions. Lastly, this study was performed at the sacral area in the prone position to reduce as many confounding variables as possible, and the test condition does not represent that of sitting on a wheelchair seat cushion. The pressure application area was surrounded with tissue that was pressure free in our study, while the tissues surrounding the ischial tuberosities during sitting are not pressure free. Future studies should investigate the cooling effect in a seated position to further implement the findings in clinical practice to prevent pressure ulcers.
Conclusions
This was the first study to investigate the effect of local cooling on ischemic tissue in people at risk for pressure ulcer development. Our results suggested that both local fast and slow cooling had protective effects on ischemic skin in individuals without neurological deficits. This supported previous animal and human studies that local skin cooling is beneficial to the tissue during prolonged pressure. We did not find this protective phenomenon in people with SCI, possibly due to chronic microvascular changes after SCI that were not fully explored. However, less metabolic vasodilator accumulation was indicated through time-frequency analysis of the SBF when local fast cooling was applied. Findings from this study provide evidence of the role microclimate may play in pressure ulcer risk. Microclimate considerations should be part of clinical assessments and pressure ulcer prevention strategies. First, support surfaces with temperature control for weight-bearing soft tissues need to be developed. In addition, investigation of the changes in microclimate of the skin in clinic may contribute to the understanding of the risk for pressure ulcer development in people with SCI.
Acknowledgements
The authors would like to thank Mr. Erik Porach for assistance performing subject testing and for technical support in this project; Ms. Karen Greenwald, Mr. Ian Smith, and Ms. Tina Harrison for assistance with subject recruitment from the Department of Physical Medicine and Rehabilitation, University of Pittsburgh Medical Center; and the subjects for participating in this study. The authors would also like to thank Dr. Arash Mahboobin for the original MatLab programming for STFT analysis. This work was funded by the National Institute on Disability and Rehabilitation Research (NIDRR), Rehabilitation Engineering Research Center (RERC) on Spinal Cord Injury, Grant #H133E070024. The ideas and opinions expressed herein are those of the authors and not necessarily reflective of the NIDRR.
References
- 1.Bouten CV, Oomens CW, Colin D, Bader DL. The aetiopathology of pressure ulcers: a hierarchical approach. In: Bader DL, Bouten CV, Colin D, Oomens CW. (eds.) Pressure ulcer research. Berlin: Springer-Verlag; 2005. p. 1–10 [Google Scholar]
- 2.Kokate JY, Leland KJ, Held AM, Hansen GL, Kveen GL, Johnson BA, et al. Temperature-modulated pressure ulcers: a porcine model. Arch Phys Med Rehabil 1995;76(7):666–73 [DOI] [PubMed] [Google Scholar]
- 3.Iaizzo PA, Kveen GL, Kokate JY, Leland KJ, Hansen GL, Sparrow EM. Prevention of pressure ulcers by focal cooling: histological assessment in a porcine model. Wounds 1995;7(5):161–9 [Google Scholar]
- 4.Tzen Y, Brienza D, Karg P, Loughlin P. Effects of local cooling on sacral skin perfusion response to pressure: implications for pressure ulcer prevention. J Tissue Viabil 2010;19:86–97 [DOI] [PubMed] [Google Scholar]
- 5.Ruch RC, Patton HD. Energy metabolism. In: Ruch RC, Patton HD. (eds.) Physiology and biophysics, 19th ed Philadelphia, PA: Saunders Pr; 1965. p. 1064. [Google Scholar]
- 6.Hochachka PW. Defense strategies against hypoxia and hypothermia. Science 1986;231:234–41 [DOI] [PubMed] [Google Scholar]
- 7.Kellogg DL. In vivo mechanisms of cutaneous vasodilation and vasoconstriction in humans during thermoregulatory challenges. J Appl Physiol 2006;100(5):1709–18 [DOI] [PubMed] [Google Scholar]
- 8.Ruschkewitz Y, Gefen A. Cell-level temperature distributions in skeletal muscle post spinal cord injury as related to deep tissue injury. Med Biol Eng Comput 2010;48(2):113–22 [DOI] [PubMed] [Google Scholar]
- 9.Eckmann DM, Bowers S, Stecker M, Cheung aT. Hematocrit, volume expander, temperature, and shear rate effects on blood viscosity. Anesth Analg 2000;91(3):539–45 [DOI] [PubMed] [Google Scholar]
- 10.Chen Q, Carmara, AKS , An J, Riess ML, Novalija E, Stowe DF. Cardiac preconditioning with 4-h, 17°C ischemia reduces [Ca2+]i load and damage in part via KATP channel opening. Am J Physiol Heart Circ Physiol 2002;282:1961–9 [DOI] [PubMed] [Google Scholar]
- 11.Riess ML, Camara AKS, Kevin LG, An J, Stowe DF. Reduced reactive O2 species formation and preserved mitochondrial NADH and [Ca2+] levels during short-term 17°C ischemia in intact hearts. Cardiovasc Res 2004;61(3):580–90 [DOI] [PubMed] [Google Scholar]
- 12.Diederich R, Mowlavi A, Meldrum G, Medling B, Bueno RMN, Neumeister M. Local cooling provides muscle flaps protection from ischemia-reperfusion injury in the event of venous occlusion during the early reperfusion period. Hand 2009;4:19–23 [DOI] [PMC free article] [PubMed] [Google Scholar]
- 13.Choi S, Noh J, Hirose R, Ferell L, Bedolli M, Roberts JP, et al. Mild Hypothermia provides significant protection against ischemia/reperfusion injury in livers of obese and lean rats. Ann Surg 2005;241:470–6 [DOI] [PMC free article] [PubMed] [Google Scholar]
- 14.Haisma JA, van der Woude LH, Stam HJ, Bergen MP, Sluis TA, Post MW, et al. Complications following spinal cord injury: occurrence and risk factors in a longitudinal study during and after inpatient rehabilitation. J Rehabil Med 2007;39(5):393–8 [DOI] [PubMed] [Google Scholar]
- 15.McKinley WO, Jackson AB, Cardenas DD, DeVivo MJ. Long-term medical complications after traumatic spinal cord injury: a regional model systems analysis. Arch Phys Med Rehabil 1999;80(11):1402–10 [DOI] [PubMed] [Google Scholar]
- 16.Johnson JM, Yen TC, Zhao K, Kosiba WA. Sympathetic, sensory, and nonneuronal contributions to the cutaneous vasoconstrictor response to local cooling. Am J Physiol Heart Circ Physiol 2005;288(4):1573–9 [DOI] [PubMed] [Google Scholar]
- 17.Yamazaki F, Sone R, Zhao K, Alvarez GE, Kosiba WA, Johnson JM. Rate dependency and role of nitric oxide in the vascular response to direct cooling in human skin. J Appl Physiol 2006;100:42–50 [DOI] [PubMed] [Google Scholar]
- 18.Bracic M, Stefanovska A. Wavelet-based analysis of human blood flow dynmics. B Math Biol 1998;60:919–35 [DOI] [PubMed] [Google Scholar]
- 19.Bracic M, Stefanovska A. Wavelet analysis in studying the dynamics of blood circulation. NPCS 1999;2(1):68–77 [Google Scholar]
- 20.Stefanovska A, Bracic M, Kvernmo H. Wavelet analysis of oscillations in the peripheral blood circulation measured by laser Doppler technique. IEEE T Bio-med Eng 1999;46(10):1230–9 [DOI] [PubMed] [Google Scholar]
- 21.Kirshblum SC, Burns SP, Biering-Sorensen F, Donovan W, Graves DE, Jha A, et al. International standards for neurological classification of spinal cord injury (revised 2011). J Spinal Cord Med. 2011;34(6):535–46 [DOI] [PMC free article] [PubMed] [Google Scholar]
- 22.Alexander MS, Biering-Sorensen F, Bodner D, Brackett NL, Cardenas D, Scharlifue S, et al. International standards to document remaining autonomic function after spinal cord injury. Spinal Cord 2009;47(1):36–43 [DOI] [PubMed] [Google Scholar]
- 23.de Mul FFM, Morales F, Smit AJ, Graaff R. A model fro post-occlusive reactive hyperemia as measured with laser-Doppler perfusion monitoring. IEEE T Biomed Eng 2005;52(2):184–90 [DOI] [PubMed] [Google Scholar]
- 24.Matsubara J, Narumi J, Nagasue M, Sakamoto S, Yuasa K, Shimizu T. Postocclusive reactive hyperemia during vascular reconstruction. Int J Angiol 1998;7:222–7 [DOI] [PubMed] [Google Scholar]
- 25.Olivecrona GK, Gotberg M, Harnek J, Van der Pals J, Erlinge D. Mild hypothermia reduces cardiac post-ischemia reactive hyperemia. BMC Cardiovasc Disord. 2007;7:5. [DOI] [PMC free article] [PubMed] [Google Scholar]
- 26.Hagisawa S, Ferguson-Pell M, Cardi M, Miller D. Assessment of skin blood content and oxygenation in spinal cord injured subjects during reactive hyperemia. J Rehabil Res Dev 1994;31(1):1–14 [PubMed] [Google Scholar]
- 27.Kvandal P, Landsverk SA, Bernjak A, Stefanovska A, Kvernmo HD, Kirkebøen KA. Low-frequency oscillations of the laser Doppler perfusion signal in human skin. Microvasc Res 2006;72(3):120–7 [DOI] [PubMed] [Google Scholar]
- 28.Olive JL, McCully KK, Dudley GA. Blood flow response in individuals with incomplete spinal cord injuries. Spinal Cord 2002;40:639–45 [DOI] [PubMed] [Google Scholar]
- 29.Schubert V, Fagrell B. Postocclusive reactive hyperemia and thermal response in the skin microcirculation of subjects with spinal cord injury. Scand J Rehab Med 1991;23:33–40 [PubMed] [Google Scholar]
- 30.Kooijman M. Regulation of periperal vascular tone in spinal cord-injured individuals. Nijmegen, The Netherlands: Radboud University Nijmegen; 2008 [Google Scholar]
- 31.Kooijman M, Rongen GA, Smit AJ, Hopman MTE. Preserved alpha-adrenergic tone in the leg vascular bed of spinal cord-injured individuals. Circulation 2003;108(19):2361–7 [DOI] [PubMed] [Google Scholar]