

Abstract
Waking and sleep data in adults show high heritability and trait-like characteristics in EEG spectra. This phenomenon has not been examined in children and adolescents where brain development influences the EEG. The present study examines whether a trait-like sleep EEG pattern is detectable across adolescent development. Two consecutive nights of standard sleep recordings were performed in 19 9–10-year-old children and 26 15–16-year-old teens, and were repeated 1.5–3 years later. EEG spectra averaged across the night for non-rapid eye movement and rapid eye movement sleep separately were classified using hierarchical cluster analysis, which showed that all 4 nights of a participant clustered together for a majority of participants. Intraclass correlation coefficients were also very high (>0.7) across nights separated by several years, indicating a trait-like feature of the sleep EEG. In summary, our results, using two measures of stability, indicate that a “trait-like” aspect can be detected in the sleep EEG across adolescent development despite considerable neurodevelopmental changes. This finding indicates that the brain oscillators responsible for generating the sleep EEG signal remain relatively stable across adolescent development.
Introduction
The EEG power spectrum has been identified as being among the most heritable traits in humans, and adding to the utility and validity of this measure is that it is stable over time in adults. A number of authors have reported test-retest reliability ranging from 0.84 to 0.95 in both absolute and relative waking EEG power for adults between sessions separated by several months up to ∼3 years (Gasser et al., 1985; Stassen et al., 1987; Pollock et al., 1991; Salinsky et al., 1991; Kondacs and Szabó, 1999; Poulos et al., 2002; Näpflin et al., 2007). The sleep EEGs of adults also show very high levels of heritability (Ambrosius et al., 2008; De Gennaro et al., 2008), stability within an individual across time, and interindividual variability (Feinberg et al., 1980; De Gennaro et al., 2005; Buckelmüller et al., 2006; Tucker et al., 2007). Buckelmüller et al. (2006), for example, used hierarchical cluster analysis to identify individuals across 4 nights separated by as long as several weeks, based on the sleep EEG spectra. The implications of this finding extend beyond the stability of an individual's spectra over time, indicating as well that an individual's spectrum is discernable from that of others. This finding implies that the brain oscillators responsible for generating the power spectrum are distinct across individuals and stable over recordings separated by as long as several weeks.
The stability of waking and sleeping EEG in adults may reflect underlying neuroanatomy and neural circuitry, which are relatively stable in healthy middle-aged adults. During adolescence, however, the brain undergoes major remodeling, and the EEG signals reflect these developmental changes (Buchmann et al., 2011). For example, a significant decline is seen in the waking and sleep EEG amplitude starting in late childhood/early adolescence (Campbell and Feinberg, 2009; Kurth et al., 2010a,b; Tarokh and Carskadon, 2010). This developmental decline in amplitude parallels the extensive synaptic pruning characteristic of the maturing human adolescent (Huttenlocher, 1979; Feinberg, 1982).
The nature and extent of cortical changes during adolescence call into question whether the sleeping EEG sustains consistent morphological characteristics and remains stable across adolescent development. If the sleep EEG represents a trait-like feature, as has previously been suggested from work with adults (Buckelmüller et al., 2006), we would expect the shape of the spectrum to remain stable over this period even in the face of the amplitude decline. On the other hand, if the cortical changes during adolescence underlie fundamental rewiring of the brain structures responsible for generating the sleep EEG, we would expect that the morphology of the sleep EEG spectrum would not be stable across adolescent development. We use two approaches—intraclass correlation coefficients (ICCs) and hierarchical cluster analysis—to examine whether the sleep EEG is stable across early and mid-adolescent development.
Materials and Methods
Participants were recruited using flyers, mailings to previous participants, and radio and newspaper advertisements. Individuals with a current or chronic illness, evidence of learning disability, sleep disorder, or personal or family history of psychopathology were excluded from the study. Additional exclusion criteria included individuals with a pattern of insufficient sleep or excessive daytime sleepiness, indicated by reports of napping two or more times per week. Participants were medication free for all study nights. Parental and participant consent were provided using criteria of the Lifespan Institutional Review Board; families were compensated for their time.
Data from two longitudinal cohorts are presented here. Our sample included children and teens with a parental history of alcohol abuse (PH+) and without such parental history (PH−). Parental alcohol history was assessed using Diagnostic and Statistical Manual of Mental Disorders, fourth edition, criteria applied to structured interviews and is reported in Table 1. We performed a χ2 test to assess whether the rate of successful clustering was different for PH+ and PH− individuals (2 × 2 contingency table with clustering and parental history as factors). We found no significant differences between PH+ and PH− participants for either cohort (children and teens) or in any sleep state [non-rapid eye movement (NREM) and REM sleep] in the Yates corrected χ2 values (Yates, 1934). Because we did not find significant differences between the two groups on our independent variable (clustering), we include PH+ and PH− individuals in the same analysis. The first cohort, the children, included 19 participants who were 9 or 10 years old at the time of the initial recording session and 11–13 years old at the time of the follow-up recording (Table 1). Tanner stage (Tanner, 1962), a measure of external primary and secondary sex characteristics, was determined during a brief physical examination at each assessment. Tanner stages range from Tanner 1, characterized by child-like appearance, to Tanner 5, indicating attainment of adult-like appearance. All children, with the exception of one female who was Tanner 4, were either Tanner 1 or 2 at the time of the initial recording session and had advanced at least one Tanner stage at the follow-up session. The second cohort, teens, included 26 teens, ages 15 and 16 years, who were followed up 2–3 years later (Table 1). All participants in the teen group were postpubertal (Tanner stage 5).
Table 1.
Individual participant data
| Children |
Teens |
|||||||||||||||||||
|---|---|---|---|---|---|---|---|---|---|---|---|---|---|---|---|---|---|---|---|---|
| Sex | PH | Age 1 (years) | Age 2 (years) | NREM clustering |
REM clustering |
Spindle peak 1 (Hz) | Spindle peak 2 (Hz) | Sex | PH | Age 1 (years) | Age 2 (years) | NREM clustering |
REM clustering |
Spindle peak 1 (Hz) | Spindle peak 2 (Hz) | |||||
| C3 | O2 | C3 | O2 | C3 | O2 | C3 | O2 | |||||||||||||
| 1 | F | − | 10.3 | 12.9 | N | N | N | X | 12.2 | 12.8 | F | − | 16.6 | 19.2 | N | X | X | X | 13.3 | 13.8 |
| 2 | M | − | 9.6 | 12 | N | Y | X | X | 11.7 | 12.4 | F | − | 16.6 | 19.2 | Y | Y | Y | Y | 13.3 | 13.4 |
| 3 | M | − | 10.2 | 12.3 | N | X | X | X | 11.6 | 12.6 | F | − | 15.1 | 17.6 | N | N | Y | Y | 13.1 | 13.6 |
| 4 | M | − | 10.7 | 13.3 | N | N | X | X | 12.5 | 13 | F | − | 15.2 | 17.7 | Y | N | N | X | 12.7 | 12.9 |
| 5 | F | − | 9.4 | 11.9 | Y | Y | Y | X | 11.9 | 11.9 | M | − | 15.3 | 17.9 | Y | Y | N | X | 12.9 | 12.9 |
| 6 | M | − | 10.5 | 12.6 | Y | Y | Y | N | 12.8 | 13 | F | − | 15.4 | 18.8 | N | N | Y | X | 12.9 | 13.9 |
| 7 | M | − | 9.9 | 12 | Y | Y | Y | N | 11.3 | 11.1 | F | − | 15.4 | 17.5 | N | Y | X | Y | 13.3 | 14.1 |
| 8 | M | − | 9.9 | 12 | Y | Y | Y | Y | 12.1 | 12.2 | F | − | 15.6 | 17.7 | Y | Y | N | Y | 13.3 | 13.3 |
| 9 | M | − | 10.9 | 13.4 | X | Y | 12.9 | 13.4 | M | − | 15.6 | 18.1 | Y | Y | X | Y | 13.1 | 13 | ||
| 10 | M | − | 9.4 | 11.3 | Y | Y | Y | N | 12.1 | 12 | F | − | 15.6 | 18.1 | N | Y | X | N | 12.6 | 12.9 |
| 11 | F | + | 9.2 | 12.6 | N | X | N | N | 12.8 | 13.4 | F | − | 15.8 | 18.4 | Y | Y | X | X | 13.4 | 13.4 |
| 12 | M | + | 9.7 | 12.2 | Y | Y | Y | Y | 11.6 | 11.9 | M | − | 15.9 | 18 | Y | Y | Y | X | 11 | 12 |
| 13 | F | + | 11.1 | 13.9 | X | X | X | Y | 12.7 | 12.9 | F | − | 16.2 | 18.9 | X | N | X | X | 12.1 | 12.2 |
| 14 | F | + | 10.2 | 12.8 | N | Y | N | Y | 12.6 | 13 | F | − | 16.2 | 18.8 | X | N | X | X | 13.6 | 11.3 |
| 15 | M | + | 10.2 | 11.2 | Y | Y | Y | Y | 12.6 | 12.5 | F | − | 16.4 | 19.1 | N | N | Y | X | 13.6 | 14.2 |
| 16 | F | + | 10.2 | 12.3 | Y | Y | X | Y | 13.2 | 13.2 | F | + | 15.2 | 17.6 | N | N | Y | Y | 12.4 | 12.8 |
| 17 | M | + | 11 | 13.5 | Y | Y | X | X | 12.4 | 11.6 | M | + | 15 | 17.5 | Y | Y | N | N | 12.4 | 13 |
| 18 | M | + | 10.2 | 12.7 | N | X | Y | Y | 12.6 | 13 | F | + | 15.3 | 17.6 | Y | Y | Y | Y | 14 | 14.1 |
| 19 | M | + | 9.2 | 11.7 | N | N | Y | N | 11.3 | 11.9 | M | + | 15.3 | 17.8 | Y | Y | N | N | 13.1 | 13.2 |
| 20 | F | + | 16 | 17.9 | Y | Y | Y | Y | 12.4 | 11 | ||||||||||
| 21 | F | + | 15.6 | 17.6 | Y | N | Y | X | 13.8 | 14 | ||||||||||
| 22 | M | + | 15.9 | 17.7 | Y | Y | X | X | 14 | 13.7 | ||||||||||
| 23 | M | + | 15.6 | 16.6 | Y | Y | N | X | 12.8 | 13.1 | ||||||||||
| 24 | M | + | 16 | 18 | Y | Y | N | Y | 12.6 | 12.8 | ||||||||||
| 25 | F | + | 15.7 | 18.2 | Y | Y | N | N | 12.3 | 12.8 | ||||||||||
| 26 | M | + | 15.2 | 17.7 | Y | X | N | X | 12.9 | 13.4 | ||||||||||
| μ | 10.1 | 12.5 | 12.3 | 12.5 | 15.7 | 18.0 | 13.0 | 13.1 | ||||||||||||
| σ | 0.58 | 0.73 | 0.56 | 0.65 | 0.45 | 0.63 | 0.70 | 0.79 | ||||||||||||
M, Male, F, female; Age 1, age at initial assessment; Age 2, age at follow-up assessment; PH: −, Negative for parental history of alcohol abuse/dependence, +, positive for parental history of alcohol abuse/dependence; X, consecutive nights did not cluster; Y, clustering successful across 4 nights; N, clustering unsuccessful across 4 nights; μ, mean; σ, standard deviation; Spindle peak 1, frequency of the peak in the sigma band on adaptation and baseline nights averaged together for the initial session; Spindle peak 2, frequency of the peak in the sigma band on adaptation and baseline nights averaged together for the follow-up session.
Within cohort, the protocol for recording sessions stayed the same, including that participants spent at least 1 week on a stabilization sleep schedule with fixed bedtimes and rise times before sleeping in the laboratory. Participants in the children's cohort had a schedule of at least 10 h time in bed (TIB), while those in the teen cohort were allotted at least 9 h TIB (Table 2). Compliance with the sleep schedules was confirmed using sleep diaries, continuous wrist actigraphy, and daily phone calls to the laboratory's time-stamped answering machine at rise times and bedtimes.
Table 2.
Sleep stage variables
| Sleep variable (min) | Children |
Teens |
||||
|---|---|---|---|---|---|---|
| Initial | Follow-up | P value | Initial | Follow-up | p value | |
| Stage 1 | 35 (15) | 35 (15) | N.S. | 33 (9) | 43 (14) | <0.001 |
| Stage 2 | 178 (62) | 229 (34) | <0.001 | 215 (41) | 254 (29) | <0.001 |
| SWS | 236 (64) | 180 (47) | <0.001 | 162 (42) | 112 (34) | <0.001 |
| REM | 103 (22) | 108 (22) | N.S. | 96 (20) | 101 (22) | N.S. |
| WASO | 31 (30) | 25 (30) | N.S. | 19 (18) | 17 (18) | N.S. |
| Sleep latency | 12 (10) | 14 (13) | N.S. | 8 (5) | 9 (6) | N.S. |
| Total sleep time | 552 (33) | 552 (30) | N.S. | 506 (4) | 511 (19) | N.S. |
| Total recording time | 600 (15) | 599 (4) | N.S | 543 (10) | 540 (7) | N.S. |
Values are given as means (SDs) in minutes for stage 1, stage 2, slow-wave sleep (SWS) and REM sleep. WASO, Minutes of waking after sleep onset, measured from first occurrence of 1.5 min of stage 1 or stage 2 to final awakening; Sleep latency, time in minutes to the first 1.5 consecutive minutes of stage 1 or first stage 2; REM sleep latency, time (in minutes) to the first REM sleep episode after sleep onset; Total sleep time, total time in minutes spent in NREM and REM sleep; Total recording time, time from lights off to lights on. Statistical significance was assessed using a paired t test (p < 0.05).
Participants spent 2 consecutive nights—adaptation and baseline—in the laboratory for each assessment (initial and follow-up) with bedtimes and rise times fixed by the at-home schedule. The prestudy sleep schedules provided the opportunity for participants to be well slept on the study nights. Participants slept in individual darkened bedrooms while polysomnography (PSG) was recorded; the first recording nights included screening for sleep-related breathing abnormalities and periodic limb movements using oral/nasal thermocouples and leg electromyogram (EMG), respectively. No sleep disorders were detected.
Right and left electro-oculogram, electromyogram (EMG; mentalis, submentalis), and electrocardiogram along with a central (C3/A2) and an occipital (O2/A1) EEG derivation placed according to the international 10–20 system (Jasper, 1958) were recorded on adaptation and baseline nights. Due to equipment upgrades, the recordings were performed on two separate systems. In 39 participants (15 children and 24 teens), the initial recordings were performed using the Albert Grass Heritage System (Astromed) with GAMMA software. The EEG signals were digitized on-line (12 bit AD converter; Butterworth filter, −12 dB/octave; low-pass filter, −6 dB at 35 Hz; time constant 1.0 s) with a sampling rate of either 100 or 128 Hz. Six participants' (4 children and 2 teens) initial recordings and all participants' follow-up recordings were performed on the TWin system (Astromed) using TWin AS40 bedside amplifiers (high-pass EEG filter, 0.3 Hz; low-pass filter, 35 Hz). These signals were collected digitally (storage resolution, 400 Hz) and saved as EDF files. Impedance values were ≤10 kΩ. A calibration signal was input to both systems simultaneously to assess comparability between the two systems. Signals from the systems were in good agreement in the frequency range of 0.3–16 Hz; however, small discrepancies emerged at higher frequencies. Therefore, the analysis was restricted to frequencies <16 Hz, which limits our ability to discern the contribution of higher frequencies to clustering and ICC values.
Sleep data were visually scored in 30 s epochs according to the criteria of Rechtschaffen and Kales (1968). Inter-rater and intrarater reliability were at least 86%. Epochs with artifacts were rejected using a semiautomated procedure based on power in the 0.6–4.6 and 20–40 Hz bands, and confirmed by visual inspection (Buckelmüller et al., 2006). Power spectra were calculated for each 30 s epoch (Hanning window, average of six 5 s epochs) using MATLAB (MathWorks). The frequency resolution was 0.2 Hz, and frequencies between 0.6 and 16 Hz were included in the analysis. All-night power spectra were calculated separately for NREM and REM sleep for the left central (C3/A2) and right occipital (O2/A1) derivations.
As outlined in the Introduction, sleep EEG spectral power declines during adolescent development in most frequency bands for both REM and NREM sleep (Jenni and Carskadon, 2004; Tarokh and Carskadon, 2010). This change is demonstrated in Figure 1, which shows the decline in sleep EEG amplitude in exemplary early and late adolescents for stages 2 and 4 NREM sleep, and REM sleep. To quantify the decline from the initial to follow-up sessions, we integrated sleep EEG power between 0.6 and 16 Hz, averaged across adaptation and baseline nights, calculated the decline in power within a participant, and then averaged across participants. In the children's cohort for NREM sleep, we saw a 40% (SD = 28%) decline in power for C3/A2 and a 48% (SD = 31%) decline for O2/A1 from the initial to the follow-up assessment. Similarly, power for REM sleep declined in the children's cohort by 47% (SD = 23%) for C3/A2, and by 51% (SD = 25%) for O2/A1. In the teen cohort, power declined between assessments by 55% (SD = 17%) in C3/A2 and 59% (SD = 27%) in O2/A1 for NREM sleep, and by 49% (SD = 18%) in C3/A2 and 56% (SD = 30%) in O2/A1 for REM sleep.
Figure 1.

Sample EEG signals in the time domain. Thirty-second EEG tracings in three sleep states: stage 2 and stage 4 NREM and REM sleep. The top row is taken from a male in the children's cohort who was 10.2 years of age at the time of the initial recording and 12.3 years of age at follow-up. The bottom row shows the EEG of a female in the teen cohort who was 15.7 years of age at the initial recording and 18.2 years of age at the follow-up session. The amplitude of the signal decreases with increasing age.
Because we were interested in changes to the spectrum morphology rather than gross changes in the signal amplitude, we normalized each individual's spectra by dividing the power at each frequency bin by the total power from 0.6 to 16 Hz separately for each night and NREM and REM sleep. We were concerned that the calculation of the EEG spectrum is affected by the number of epochs used to compute the average spectra and wished to ensure that this phenomenon did not bias our estimation of the spectra. Therefore, the number of epochs sampled for each night was determined by the lowest number of artifact-free NREM or REM (computed separately) epochs for each participant. We used two approaches that have been used previously in the sleep EEG literature—hierarchical cluster analysis and ICC—to examine sleep EEG stability (Buckelmüller et al., 2006; Tucker et al., 2007).
Cluster analysis.
Stability of the spectra across recording sessions was examined with hierarchical cluster analysis based on cosine distance using MATLAB functions PDIST and LINKAGE. Cosine distance is defined as 1 minus the inner or “dot” product between the unit-length spectral vectors normalized by the length of the vectors. The cluster analysis for each night was performed on 77 dimensional vectors based on log-transformed normalized EEG power spectra (0.6–16 Hz in 0.2 Hz steps). The cluster analysis was performed for each cohort in two stages. As a first step, cluster analyses were performed separately within the initial and follow-up sessions using only the spectra from consecutive adaptation and baseline nights. This procedure was performed for NREM sleep and REM sleep to confirm successful clustering in the absence of developmental changes. Vectors were grouped according to the distance between them and represented visually using a dendrogram (Fig. 2). A dendrogram is composed of upside-down U-shaped lines, where the height of the U represents the distance between the connected objects.
Figure 2.

Sample dendrogram. Dendrogram of 4 nights for REM sleep in the children's cohort. This analysis included data from the 13 participants whose consecutive nights clustered at both sessions. In this plot, participant number is on the x-axis, and cosine distance on the y-axis. Clusters highlighted in blue depict those participants whose 4 nights cluster together, while green depicts participants whose 4 nights do not cluster together. Note that even in those whom all 4 nights do not cluster together, consecutive nights are clustered.
Next, participants whose consecutive nights clustered correctly at both assessments were included in a cluster analysis with data from all 4 nights. No a priori information was given to the clustering algorithm regarding the number or the size of clusters for any of the analyses.
ICC analysis.
To obtain another measure of sleep EEG stability, ICCs were calculated at each frequency bin. ICCs were defined as the error-free between-subject variance divided by the sum of the error-free between- and within-subject variances. The unbiased estimator of the between-subject variance is defined as the between-subject mean square minus the within-subject mean square divided by the number of observations per participants (in this case, 4 participants) (Fleiss, 1986). Thus, large ICC values (approaching 1.0) arise when the between-subject variance is much larger than the within-subject variance. For each cohort, we performed the ICC analysis in the following two ways: (1) using data from consecutive nights at each session (i.e., initial and follow-up sessions); and (2) using data from all four sessions.
We performed a bootstrap analysis to assess the statistical significance of the observed ICCs. The principle underlying the bootstrap is to generate a random distribution of values by reshuffling (with replacement) the observed pool of data. For the analysis of 4 nights, our pool of data consisted of all 4 nights from all participants within a single cohort. Thus, at each frequency bin our pool of data consisted of 76 power values (19 children, 4 nights/child) for the children's cohort and 96 power values (24 teens, 4 nights/teen) for the teen cohort. For each cohort and frequency, we reshuffled the pool of data into a new matrix of n subjects (19 for the children and 26 for the teens) by 4 nights. We then calculated ICCs on the new and randomly generated dataset. This procedure was repeated 1000 times, resulting in a distribution of randomly generated ICCs. We take a conservative approach and assume that in biological data ICC values are typically >0; therefore we use the absolute value of the bootstrap distribution. The observed ICC value was then compared with the absolute value of the bootstrap distribution, and when the observed value was greater than the upper first percentile, it was considered statistically significant. The same procedure was applied to the analysis of consecutive nights, with the exception that instead of 4 nights, the above analysis was performed on the 2 consecutive nights at each assessment.
Comparison of cluster analysis and ICCs.
Cluster analysis and ICCs both measure the stability of a variable, but each uses a different approach and gives somewhat different information. The ICCs takes into account only information at a given frequency bin and can reveal which features of the spectrum are more “stable.” On the other hand, cluster analysis takes into account the shape of the entire spectrum and therefore is based on more information, providing enhanced validity. Cluster analysis is an objective mathematical measure of similarity; however, it does not provide a traditional p value, as is found in ICC analysis. We highlight a key aspect of our approach to the hierarchical cluster analysis: to wit, the number of clusters formed was not determined a priori but was derived intrinsically from the distances of the spectra from one another. Therefore, clusters that included either all 4 nights of a participant or 2 consecutive nights from a participant are noteworthy, as they were not forced through the analytic strategy.
Results
Sleep stage variables
Four participants from the teen cohort were excluded from the sleep stage analysis: three due to technical difficulties on one recording night, and one due to an extended (114 min) bout of wakefulness in the middle of 1 recording night. On the other hand, these participants were included in the 4 night cluster analysis because they met our criteria of successful clustering on consecutive nights at both assessments. The distribution of sleep stages changed between assessments for both cohorts, including significant declines in duration of slow-wave sleep (stages 3 and 4 NREM sleep) and increases in stage 2 sleep duration (Table 2). In addition, we found a significant increase in the number of minutes of stage 1 sleep across assessments in the teen cohort.
C3/A2 clustering: consecutive nights
Table 1 shows individual clustering data for NREM and REM sleep for all participants (participants whose consecutive nights did not cluster together are denoted with an “X” in the clustering column). NREM sleep clustering of adaptation and baseline nights at the initial session in the children was successful for 17 of 19 participants; clustering of consecutive nights for NREM sleep in children was 100% successful at the final session. With regard to clustering using REM sleep EEG spectra, 14 of 19 participants clustered at the initial session, while 15 of 19 clustered in the follow-up session.
For teens, 25 of 26 participants' consecutive nights in the initial session and at the follow-up clustered for NREM sleep EEG spectra, although the participants whose nights did not cluster differed from initial to follow-up (Table 1). For REM sleep EEG spectra, 7 of 26 participants clustered incorrectly at the initial session, and all but 3 participants were correctly clustered at the follow-up session.
O2/A1 clustering: consecutive nights
For the children's cohort, one participant (participant 9) was excluded from the analysis of O2/A1 due to excessive artifacts at this derivation, leaving 18 participants. For NREM sleep in the children's cohort, two participants did not cluster on consecutive nights at the initial session, while two others did not cluster at the follow-up session (Table 1). Looking at REM sleep, one participant did not cluster at either assessment. In addition, five participants' consecutive nights did not cluster at the initial session, and one participant did not cluster at the follow-up session for REM sleep. Thus, for the children's cohort, 14 participants were included in the analysis of NREM sleep, and 12 were included in the analysis of REM sleep for derivation O2/A1.
For the teen cohort, all participants' consecutive nights clustered at the initial session and only two did not cluster at the follow-up session for NREM sleep. With regard to REM sleep, three participants did not cluster at the initial or follow-up session. In addition, five participants did not cluster at either the initial or follow-up sessions; however, the participants were different at each session. Therefore, a total of 24 participants were included in the 4 night cluster analysis for NREM sleep, while only 13 were included in the analysis of REM sleep.
C3/A2 clustering: across development
We then repeated the cluster analysis for each cohort with spectral EEG distance of all 4 nights from participants whose consecutive nights were clustered together. Thus, the children's NREM sleep analysis at derivation C3/A2 included 17 participants and 13 participants for REM sleep; for teens, 24 were included in the NREM sleep analysis, and 18 in the REM sleep analysis. All-night NREM sleep EEG spectra from two representative children and two representative teens whose 4 nights cluster together are shown in Figure 3, while all-night NREM sleep EEG spectra from one child and one teen whose 4 nights do not cluster are depicted in Figure 4. For the children's cohort, all 4 nights of nine participants clustered together for NREM sleep, a clustering rate of 53% (depicted in supplemental Fig. S1, available at www.jneurosci.org as supplemental material). Seventeen participants in the teen cohort clustered correctly, a success rate for NREM sleep EEG spectra of 71% (dendrogram depicting this finding can be found in supplemental Fig. S2, available at www.jneurosci.org as supplemental material).
Figure 3.

Correct clustering in children and teens. Normalized all-night NREM sleep spectra of two representative participants in each cohort whose 4 nights clustered correctly. All 4 nights from a participant are shown in one color, and spectra from different individuals are shown in different colors. Children are depicted on the left (participant numbers: S10 and S16), and teens on the right (participant numbers: S8 and S11). Power density is plotted on a logarithmic scale.
Figure 4.
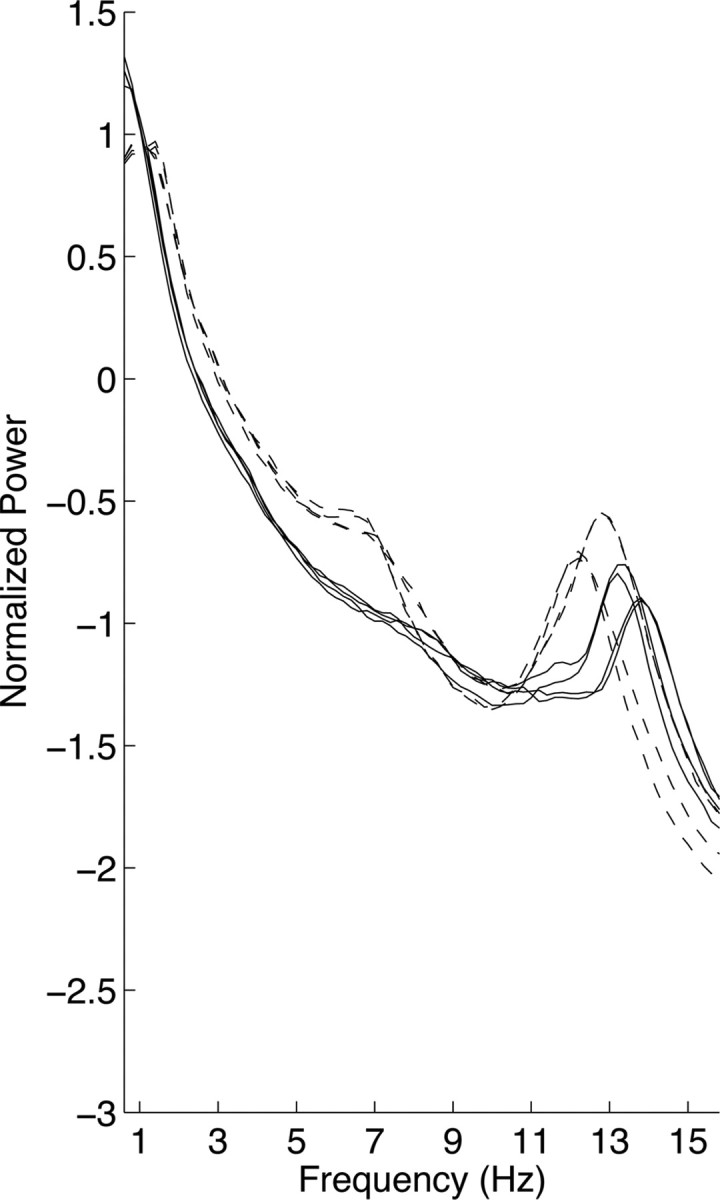
A child and a teen who do not cluster. All-night NREM sleep spectra of 4 nights from one child (participant number S1; dashed lines) and one teen (participant number S1; solid lines) whose consecutive nights, but not all 4 nights, cluster. Note that the spectra on consecutive nights for the child overlap for most frequencies. Power density is plotted on a logarithmic scale.
For REM sleep EEG, all 4 nights were correctly clustered in 10 of 13 children included in the analysis, resulting in a success rate of ∼77%. This finding is shown using a dendrogram in Figure 2, where participants whose 4 nights cluster together are illustrated in blue, while those who do not are in green. On the other hand, only 9 of the 17 teens included in the analysis clustered correctly for REM sleep spectra; a success rate of 53% (supplemental Fig. S3, available at www.jneurosci.org as supplemental material).
O2/A1 clustering: across development
For the children's cohort, 11 of 14 participants clustered across all 4 nights, yielding a successful clustering rate of 78% for NREM sleep. Of the 24 participants included in the analysis of NREM sleep in the teen cohort, 16 clustered successfully, yielding a success rate of 67%. For REM sleep, the success rate in children was 7 of 12 participants or 58%, while in teens it was 9 of 13 participants or 69%.
C3/A2 versus O2/A1 clustering: across development
We performed a χ2 test to assess whether the rate of successful clustering differed between C3/A2 and O2/A1. The factors in our contingency table were derivation (C3/A2 and O2/A1) and clustering (yes or no), and α was set to 0.05. We found no statistically significant differences in the unadjusted χ2 value between the derivations for the children's cohort during NREM (χ2(1) = 2.20) or REM (χ2(1) = 0.99) sleep. This was also true for the teen cohort for NREM (χ2(1) = 0.097) and REM (χ2(1) = 1.15) sleep.
Intraclass correlation coefficients
Landis and Koch (1977) have categorized ICC values >0.5 as “substantial” (0.6–0.8) and “almost perfect” (0.8–1). According to these categories, our ICC values were in the almost perfect category across cohorts, frequencies, and states, with few exceptions (Fig. 5). Statistical analysis revealed that all ICC values, except for two (teen cohort; 0.6 Hz; REM sleep; initial session for C3/A2 and follow-up session O2/A1), were significant, with an α set to 0.01. Figure 5 shows ICC values for NREM sleep for C3/A2 in the children and teen cohorts for consecutive nights at both assessments (i.e., initial and follow-up assessments) and across all four recordings. To give the reader a sense of the statistical significance of our results, we include the results of our bootstrap analysis in the plots by taking an average of the absolute value of all 1000 bootstrapped values at each frequency. As shown in Figure 5, ICC values appear to be slightly higher for consecutive nights than for the analysis across all four recordings (2 pairs of nights separated by several years). ICC values were significant, however, even across all four recordings. With regard to O2/A1 during NREM sleep, all ICC values were statistically significant for both cohorts and are depicted in supplemental Figure 4 (available at www.jneurosci.org as supplemental material).
Figure 5.

ICCs for NREM sleep in children and teens at derivation C3/A2. ICC values across frequencies for consecutive nights at the initial and follow-up sessions and across all 4 nights (top line on each plot). All values shown here were statistically significant. The lower line on each plot is the average of the absolute value of 1000 bootstrapped values at each frequency.
The results for REM sleep were similar to those obtained for NREM sleep, with the majority of ICC values reaching statistical significance across cohorts, derivations, and frequencies for the consecutive night analysis and the analysis of all 4 nights. These results are depicted in supplemental Figures 5 and 6 (available at www.jneurosci.org as supplemental material).
Discussion
In this study, we used two measures of stability, ICCs and cluster analysis, to assess whether trait-like characteristics are preserved over the span of several years during adolescent development. Adolescence is a time of significant brain remodeling with declines in cortical gray matter and EEG amplitude (Buchmann et al., 2011) concurrent with increases in white matter and EEG coherence (Tarokh et al., 2010). Using two EEG derivations, C3/A2 and O2/A1, we found evidence that, despite the many cortical changes, the morphology of the sleep EEG spectrum is largely preserved across adolescent development.
ICCs
A recent study examined ICC values in children (ages 9–12 years) using two sleep EEG recordings separated by 1 or 2 weeks (Geiger et al., 2011). They found that ICC values for NREM sleep (electrode C3/A2) were between 0.72 and 0.96, dependent on frequency. Similarly, we found very high ICC values on consecutive nights (Fig. 5) and extend the findings of Geiger et al. (2011) by showing that high ICC values are maintained during adolescent development in recordings separated by several years. Moreover, the ICC values we obtained are comparable to those found in adults over a much shorter time span. For example, Tucker et al. (2007) using eight all-night PSG recordings (some of which followed sleep deprivation) distributed over 11 d in young adults, estimated the ICC value in the delta band (0.75–4.5 Hz) for EEG derivation C3 referenced against A1/A2 during NREM sleep as 0.78. We found somewhat higher ICC values at the same electrode during NREM sleep in the delta band (0.6–4.6 Hz) for children (ICC, 0.83) and teens (ICC, 0.89) across two pairs of recordings separated by several years. Therefore, despite the many neurodevelopmental changes that occur in adolescence (e.g., synaptic pruning and increasing myelination), ICCs remain as high as those observed in adults, indicating that a trait-like characteristic is preserved across adolescence over the entire frequency range examined.
C3/A2 versus O2/A1 clustering
We examined the stability of the sleep EEG spectra at two derivations to assess whether clustering differed between these cortical regions. A growing literature suggests that the age-related decline in EEG power observed during adolescence initiates in posterior lobes and proceeds anteriorly, with the frontal lobes as the last place this decline begins and ends (e.g., Kurth et al., 2010a). The decline in EEG power is thought to be due to the pruning of underutilized synapses that occurs during this developmental period (Feinberg, 1982). Thus, the implication of the regional differences in EEG power decline is that cortical pruning commences in the occipital lobes and moves toward the front of the head. Indeed, we observed a greater decline in power in the occipital (O2/A1) compared with the central (C3/A2) lead. These regional differences might reflect the developmental trajectory of behavioral and cognitive performance. For example, performance on tasks of visual acuity and global motion detection reaches adult levels by late childhood (Lewis and Maurer, 2005), whereas improvements on tasks requiring frontal lobe function (e.g., working memory) continue well into late adolescence/early adulthood (Kwon et al., 2002). Despite these regional developmental differences, we did not find a significant difference in the incidence of clustering between the anterior (central) and posterior (occipital) derivations in either cohort of sleep state. Our results suggest that the morphology of the sleep EEG spectrum, and thus trait-like characteristics, are equally well preserved in C3/A2 and O2/A1 across adolescent development.
Clustering
A discussion of the cluster analysis requires more nuanced assessment than for the ICCs analysis. Successful clustering depended on state (NREM and REM sleep) and cohort (children and teens). We suggest that the clustering analysis may be more sensitive to developmental changes. The most direct comparison with adults to our dataset is that of Buckelmüller et al. (2006), who performed the same cluster analysis on the sleep EEG spectrum of adults. Successful clustering of 4 nights in the Buckelmüller et al. (2006) study was achieved for both NREM and REM sleep in all eight adult participants, whereas we found 53–77% clustering depending on sleep state (NREM and REM sleep) and cohort (children and teen). Although 53% does not seem high, the probability of all 4 nights of even a single participant clustering by chance is near zero. Though the absence of successful clustering in certain participants may indicate developmental changes in the morphology of the EEG spectrum, we cannot rule out other explanations. For one, clustering becomes more difficult with larger sample sizes due to the increased likelihood that individual participants' spectra will have a similar morphology. Our project had twice as many participants in the children's cohort and three times as many in the teen cohort compared with the Buckelmüller et al. (2006) study. Furthermore, unlike our study, the spectral data in the Buckelmüller et al. (2006) study were not normalized, which provided a further dimension to aid in clustering. We were, however, unable to use non-normalized data for our analysis because using non-normalized data would highlight the large reduction in power between the assessments rather than morphological differences between individuals. Finally, the longest duration between recordings in the Buckelmüller et al. (2006) study was 28 d, compared with study recordings separated by several years in the current study. On the other hand, we conclude that the reduced amount of successful clustering over time in certain individuals in our cohorts was due to developmental changes reflected in the EEG spectrum, since we included in our analyses only participants whose consecutive nights clustered.
The morphology of the NREM and REM sleep EEG spectra are distinct in a number of ways that may also affect clustering. For one, the presence of distinct spectral peaks can aid clustering. All participants had a distinct spectral peak in the 11–16 Hz range in the NREM sleep spectra. On the other hand, only a subset of participants showed a spectral peak in their REM sleep spectra, some for the theta and others for the alpha band. It is therefore unsurprising that clustering was more successful for NREM than REM sleep. Furthermore, REM sleep clustering across assessments was more successful in the children's cohort than the teen cohort. Although we cannot be certain why this is so, we speculate that it may be due in part to the presence of peaks in the REM sleep EEG spectra in more children than teens. Another difference between the NREM and REM sleep EEG spectra is that average NREM sleep spectra included a larger number of epochs and therefore represents a more reliable measure.
One prominent subject-specific feature of the NREM sleep EEG spectra is the morphology and frequency of the peak in the spindle band. The frequency of this spectral peak increased between assessments in a majority of participants in both groups (Table 1). Nunez (2000) has suggested that increased myelination produces faster EEG frequencies. Therefore, the maturational increase in spindle peak frequency may result from the myelination of the cortex known to occur over this developmental period (for review, see Paus et al., 2001). We tested for a significant difference between those who did and did not cluster with respect to the change in the frequency of their spindle peak between assessments [ANOVA with factors time (initial vs follow-up) and clustering (successful vs unsuccessful)]. This analysis showed no main effect of clustering or any interaction with time, indicating that clustering depends only in part on the spindle peak. Another factor, for example, is the slope of the power law decline (f−α) of the spectra, which may change as a function of development and impact clustering.
A larger percentage of participants clustered for NREM sleep spectra in the teen cohort than the children's cohort. One explanation for this finding may be differential maturational changes in neural plasticity (i.e., the brain's ability to respond to new experiences by modifying the structural and functional properties of synapses). Although plasticity is never lost, it is reduced over the lifespan (Huttenlocher, 2002), leading us to expect greater plasticity in the brains of children compared with teens. Accordingly, if the neural circuitry responsible for generating the EEG spectrum had undergone greater change in the children's cohort than the teen cohort, we would expect to see more developmental changes to the morphology of the EEG spectrum in the children and, consequently, less clustering. Therefore, the differential changes in neural plasticity may underlie greater stability in the NREM sleep spectrum of the older cohort (teens).
Plasticity may also account for successful clustering within a cohort. Garlick (2002) has speculated that some brains are better able to adapt their neural circuitry to environmental stimulation: in other words, their brains are more plastic. This theory suggests that over time in some individuals, due to interaction with the environment, the structures responsible for generating the EEG spectrum are altered in a manner significant enough to prevent successful clustering. Garlick (2002) has postulated further that brain plasticity has a genetic basis and is the foundation of intellectual ability (e.g., those with more plastic brains are more able to adapt to environmental demands). Support for this theory comes from a structural magnetic resonance imaging study showing that after the age of 11 years, adolescents of superior intelligence [intelligence quotient (IQ) range, 121–149] showed a greater decline in cortical thinning than adolescents of high (IQ range, 109–120) or average (IQ range, 83–108) intelligence (Shaw et al., 2006). If we accept the conjecture of Garlick (2002), perhaps the individuals in both cohorts who do not cluster across the span of several years have more plastic brains that are more considerably modified through interaction with their environment. Thus, successful clustering may indicate less plasticity.
In summary, our data indicate that—despite many neurodevelopmental changes—trait-like characteristics can be detected in the sleep EEG across adolescent development. This finding suggests that the brain oscillators responsible for generating the sleep EEG signal remain relatively stable across this period. Biological endophenotypes are closer to gene function than behavioral measures. We show that the sleep EEG shows a high degree of interindividual variability, and intraindividual stability across several years, and as such represents a reliable biological endophenotype during adolescent development.
Footnotes
This work was supported by the National Institute on Alcohol Abuse and Alcoholism (Grant AA07459–21 to L.T., and Grant AA13252 to M.A.C.) and the Swiss National Science Foundation (Grants 320000-112674 and 320030-130766 to P.A.). We thank Drs. Ronald Seifer, Christine Acebo, Tracy Rupp, Oskar Jenni, Monique LeBourgeois, Eliza Van Reen, Gahan Fallone, and Margaret Borkowski for assistance with recruitment, screening, recording, and evaluation of the participants. We are grateful to Drs. Elizabeth Forbes and Judith Owens for performing the Tanner staging; William Coon and Henry Arantes for sleep stage scoring; and Thomas Rusterholz for computational assistance. We also thank our research staff, laboratory technicians, and participants.
The authors declare no competing financial interests.
References
- Ambrosius U, Lietzenmaier S, Wehrle R, Wichniak A, Kalus S, Winkelmann J, Bettecken T, Holsboer F, Yassouridis A, Friess E. Heritability of sleep electroencephalogram. Biol Psychiatry. 2008;64:344–348. doi: 10.1016/j.biopsych.2008.03.002. [DOI] [PubMed] [Google Scholar]
- Buchmann A, Ringli M, Kurth S, Schaerer M, Geiger A, Jenni OG, Huber R. EEG sleep slow-wave activity as a mirror of cortical maturation. Cereb Cortex. 2011;21:607–615. doi: 10.1093/cercor/bhq129. [DOI] [PubMed] [Google Scholar]
- Buckelmüller J, Landolt HP, Stassen HH, Achermann P. Trait-like individual differences in the human sleep electroencephalogram. Neuroscience. 2006;138:351–356. doi: 10.1016/j.neuroscience.2005.11.005. [DOI] [PubMed] [Google Scholar]
- Campbell IG, Feinberg I. Longitudinal trajectories of non-rapid eye movement delta and theta EEG as indicators of adolescent brain maturation. Proc Natl Acad Sci U S A. 2009;106:5177–5180. doi: 10.1073/pnas.0812947106. [DOI] [PMC free article] [PubMed] [Google Scholar]
- De Gennaro L, Ferrara M, Vecchio F, Curcio G, Bertini M. An electroencephalographic fingerprint of human sleep. Neuroimage. 2005;26:114–122. doi: 10.1016/j.neuroimage.2005.01.020. [DOI] [PubMed] [Google Scholar]
- De Gennaro L, Marzano C, Fratello F, Moroni F, Pellicciari MC, Ferlazzo F, Costa S, Couyoumdjian A, Curcio G, Sforza E, Malafosse A, Finelli LA, Pasqualetti P, Ferrara M, Bertini M, Rossini PM. The electroencephalographic fingerprint of sleep is genetically determined: a twin study. Ann Neurol. 2008;64:455–460. doi: 10.1002/ana.21434. [DOI] [PubMed] [Google Scholar]
- Feinberg I. Schizophrenia: caused by a fault in programmed synaptic elimination during adolescence? J Psychiatr Res. 1982;17:319–334. doi: 10.1016/0022-3956(82)90038-3. [DOI] [PubMed] [Google Scholar]
- Feinberg I, Fein G, Floyd TC. Period and amplitude analysis of NREM EEG in sleep: repeatability of results in young adults. Electroencephalogr Clin Neurophysiol. 1980;48:212–221. doi: 10.1016/0013-4694(80)90306-5. [DOI] [PubMed] [Google Scholar]
- Fleiss J. The design and analysis of clinical experiments. New York: Wiley; 1986. [Google Scholar]
- Garlick D. Understanding the nature of the general factor of intelligence: the role of individual differences in neural plasticity as an explanatory mechanism. Psychol Rev. 2002;109:116–136. doi: 10.1037/0033-295x.109.1.116. [DOI] [PubMed] [Google Scholar]
- Gasser T, Bächer P, Steinberg H. Test-retest reliability of spectral parameters of the EEG. Electroencephalogr Clin Neurophysiol. 1985;60:312–319. doi: 10.1016/0013-4694(85)90005-7. [DOI] [PubMed] [Google Scholar]
- Geiger A, Huber R, Kurth S, Ringli M, Jenni OG, Achermann P. The sleep EEG as a marker of intellectual ability in school age children. Sleep. 2011;34:181–189. doi: 10.1093/sleep/34.2.181. [DOI] [PMC free article] [PubMed] [Google Scholar]
- Huttenlocher PR. Synaptic density in human frontal cortex-developmental changes and effects of aging. Brain Res. 1979;163:195–205. doi: 10.1016/0006-8993(79)90349-4. [DOI] [PubMed] [Google Scholar]
- Huttenlocher PR. Cambridge, MA: Harvard UP; 2002. Neural plasticity: the effect of environment on the development of the cerebral cortex. [Google Scholar]
- Jasper H. Report of the committee on methods of clinical examination in electroencephalography. Electroenceph Clin Neurophysiol. 1958;10:370–371. [Google Scholar]
- Jenni OG, Carskadon MA. Spectral analysis of the sleep electroencephalogram during adolescence. Sleep. 2004;27:774–783. [PubMed] [Google Scholar]
- Kondacs A, Szabó M. Long-term intra-individual variability of the background EEG in normals. Clin Neurophysiol. 1999;110:1708–1716. doi: 10.1016/s1388-2457(99)00122-4. [DOI] [PubMed] [Google Scholar]
- Kurth S, Jenni OG, Riedner BA, Tononi G, Carskadon MA, Huber R. Characteristics of sleep slow waves in children and adolescents. Sleep. 2010a;33:475–480. doi: 10.1093/sleep/33.4.475. [DOI] [PMC free article] [PubMed] [Google Scholar]
- Kurth S, Ringli M, Geiger A, LeBourgeois M, Jenni OG, Huber R. Mapping of cortical activity in the first two decades of life: a high-density sleep electroencephalogram study. J Neurosci. 2010b;30:13211–13219. doi: 10.1523/JNEUROSCI.2532-10.2010. [DOI] [PMC free article] [PubMed] [Google Scholar]
- Kwon H, Reiss AL, Menon V. Neural basis of protracted developmental changes in visuo-spatial working memory. Proc Natl Acad Sci U S A. 2002;99:13336–13341. doi: 10.1073/pnas.162486399. [DOI] [PMC free article] [PubMed] [Google Scholar]
- Landis JR, Koch GG. The measurement of observer agreement for categorical data. Biometrics. 1977;33:159–174. [PubMed] [Google Scholar]
- Lewis TL, Maurer D. Multiple sensitive periods in human visual development: evidence from visually deprived children. Dev Psychobiol. 2005;46:163–183. doi: 10.1002/dev.20055. [DOI] [PubMed] [Google Scholar]
- Näpflin M, Wildi M, Sarnthein J. Test-retest reliability of resting EEG spectra validates a statistical signature of persons. Clin Neurophysiol. 2007;118:2519–2524. doi: 10.1016/j.clinph.2007.07.022. [DOI] [PubMed] [Google Scholar]
- Nunez PL. Toward a quantitative description of large-scale neocortical dynamic function and EEG. Behav Brain Sci. 2000;23:371–398. doi: 10.1017/s0140525x00003253. [DOI] [PubMed] [Google Scholar]
- Paus T, Collins DL, Evans AC, Leonard G, Pike B, Zijdenbos A. Maturation of white matter in the human brain: a review of magnetic resonance studies. Brain Res Bull. 2001;54:255–266. doi: 10.1016/s0361-9230(00)00434-2. [DOI] [PubMed] [Google Scholar]
- Pollock VE, Schneider LS, Lyness SA. Reliability of topographic quantitative EEG amplitude in healthy late-middle-aged and elderly subjects. Electroencephalogr Clin Neurophysiol. 1991;79:20–26. doi: 10.1016/0013-4694(91)90152-t. [DOI] [PubMed] [Google Scholar]
- Poulos M, Rangoussi M, Alexandris N, Evangelou A. Person identification from the EEG using nonlinear signal classification. Methods Inf Med. 2002;41:64–75. [PubMed] [Google Scholar]
- Rechtschaffen A, Kales A. Los Angeles: UCLA Brain Information Service/Brain Research Institute; 1968. A manual of standardized terminology, techniques and scoring system for sleep stages of human subjects. [Google Scholar]
- Salinsky MC, Oken BS, Morehead L. Test-retest reliability in EEG frequency analysis. Electroencephalogr Clin Neurophysiol. 1991;79:382–392. doi: 10.1016/0013-4694(91)90203-g. [DOI] [PubMed] [Google Scholar]
- Shaw P, Greenstein D, Lerch J, Clasen L, Lenroot R, Gogtay N, Evans A, Rapoport J, Giedd J. Intellectual ability and cortical development in children and adolescents. Nature. 2006;440:676–679. doi: 10.1038/nature04513. [DOI] [PubMed] [Google Scholar]
- Stassen HH, Bomben G, Propping P. Genetic aspects of the EEG: an investigation into the within-pair similarity of monozygotic and dizygotic twins with a new method of analysis. Electroencephalogr Clin Neurophysiol. 1987;66:489–501. doi: 10.1016/0013-4694(87)90095-2. [DOI] [PubMed] [Google Scholar]
- Tanner J. Growth at Adolescence. Oxford: Blackwell; 1962. [Google Scholar]
- Tarokh L, Carskadon MA. Developmental changes in the human sleep EEG during early adolescence. Sleep. 2010;33:801–809. doi: 10.1093/sleep/33.6.801. [DOI] [PMC free article] [PubMed] [Google Scholar]
- Tarokh L, Carskadon MA, Achermann P. Developmental changes in brain connectivity assessed using the sleep EEG. Neuroscience. 2010;171:622–634. doi: 10.1016/j.neuroscience.2010.08.071. [DOI] [PMC free article] [PubMed] [Google Scholar]
- Tucker AM, Dinges DF, Van Dongen HP. Trait interindividual differences in the sleep physiology of healthy young adults. J Sleep Res. 2007;16:170–180. doi: 10.1111/j.1365-2869.2007.00594.x. [DOI] [PubMed] [Google Scholar]
- Yates F. Contingency table involving small numbers and the χ2 test. J R Stat Soc [Suppl] 1934;1:217–235. [Google Scholar]