

Abstract
Since its first description >40 years ago, the neurological “critical period” has been predominantly described as an early, plastic postnatal brain development stage that rather abruptly advances to an aplastic or less plastic “adult” stage. Here, we show that chronic exposure of juvenile or adult rats to moderate-level acoustic noise results in a broad reversal of maturational changes that mark the infant-to-adult progression in the primary auditory cortex. In time, noise exposure reinstates critical period plasticity. Cortical changes resulting from noise exposure are again reversed to reestablish a physically and functionally normal adult cortex, by returning animals to natural acoustic environments. These studies show that at least some of neurological changes believed to mark the transition from the infantile to the mature (adult) stage are, by their nature, reversible.
Introduction
Sensory experiences during the “critical period” have major and long-lasting impacts on brain processing that have been argued to enable individuals to adapt to a wide range of environments (Berardi et al., 2000; Hensch, 2004; Knudsen, 2004; Dahmen and King, 2007; Sanes and Bao, 2009; Wang et al., 2010). In the auditory system, previous studies have documented a well defined, acoustic environment-dependent critical period in the primary auditory cortex (A1) in the rat (Zhang et al., 2001; de Villers-Sidani et al., 2007; Insanally et al., 2009). Within this developmental epoch, cortical representations of spectral, temporal, intensive, or combined features of sound can be greatly distorted (plausibly specialized for their representations) by passive exposure to sound stimuli. These environmental sound-specific changes in cortical responses and cortical circuitry are substantially retained into adulthood (Zhang et al., 2001; de Villers-Sidani et al., 2007; Zhou and Merzenich, 2008). After the closure of the critical period, nonattended or passive exposure to sounds has little plastic consequence for A1; cortical modification requires that the older animal be in a learning (attended; rewarded; novel stimulus) behavioral context (Weinberger, 1995; Buonomano and Merzenich, 1998; Dahmen and King, 2007; Keuroghlian and Knudsen, 2007).
Should we view the critical period as an early developmental stage that the brain grows out of? In this special early epoch, the plasticity of the brain has been argued to be specifically enabled by immature cortical machinery that operates with relatively long time and space constants, with temporally unregulated modulatory facilitation of synaptic plasticity, with physical synapses and extracellular matrices in an infantile state that facilitates synapse mobility and plasticity, and with noisy and temporally dispersed activity attributable to the still primitive development of cortical connections and myelin. All of these aspects of cortical structure and function change during maturation to adulthood. It is surprising that scientists have long viewed this dramatic transition to the adult cortical form to be unidirectional.
That perspective has recently been challenged by studies that have shown that altering the cortical balance of inhibitory-excitatory strengths (Fagiolini and Hensch, 2000; Maya Vetencourt et al., 2008; Southwell et al., 2010) or the removal of chondroitin sulfate proteoglycans from the mature extracellular matrix (Pizzorusso et al., 2002, 2006) reactivates ocular dominance plasticity in the adult visual cortex—and, still more compellingly, by the demonstration that an epoch of ocular dominance plasticity mimicking that recorded in the infant brain can be reopened by dark rearing of adult animals (He et al., 2006). More recently, it has been found that pharmacological epigenetic treatments increasing histone acetylation in adult animals also promote cortical ocular dominance plasticity (Putignano et al., 2007; Silingardi et al., 2010).
Here, we show that postcritical period rats brought back into an environment of moderate-level noise reestablishes a period of sound exposure-driven plasticity in their primary auditory cortices, and that this natural functional reversal is accompanied by a complex series of parallel changes in the cortex that signal a substantial reversal from the adult functional status back in the direction of a less-mature A1.
Materials and Methods
All experiment procedures were approved by the Animal Care and Use Committees at the University of California, San Francisco.
Sound exposure.
Sprague Dawley female rats in a cage (35 × 22 × 20 cm, length by width by height) were placed in a sound-shielded test chamber for noise or tone exposure (24 h per day). The continuous broadband noise was generated by a random-noise generator (General Radio Company) and amplified to a calibrated free-field sound level of 65 dB sound pressure level (SPL), measured at the center within the cage. The energy level for noise was essentially flat across a broad frequency spectrum (0.8–30 kHz). Sound signal for tone exposure was a pulsed 7 kHz tone [50 ms duration tone pips with 5 ms ramps at 65 dB SPL, delivered at 5 pulses per second (pps)]. There was 1 s interval of silence between every five pulses to minimize adaptation effects. No distortion or substantial harmonic signal was found in the chamber when tonal stimuli were delivered. Rats were given ad libitum access to food and water under an 8 h light/16 h dark cycle. The weights and activities of exposed rats were continuously monitored and compared with age-matched naive control rats. No abnormalities in the behavior of exposed rats could be detected during sound exposure and their weights were comparable with naive rats. Their activities during waking and their sleep behaviors indicated that the exposure stimuli were not stressful.
Auditory brainstem response measurement.
Auditory brainstem response (ABR) was measured in a shielded, double-walled sound chamber. Animals were anesthetized with an intraperitoneal injection of sodium pentobarbital (50 mg/kg body weight). Tone pips (3 ms duration, 1.5 ms ramps) of 4, 8, 16, 20, or 28 kHz were delivered to the left ear through a calibrated STAX earphone with a sound tube positioned inside the external auditory meatus. ABRs were recorded by placing silver wires subdermally at the scalp midline (negative), posterior to the stimulated ear (positive), and on the midline of the back 1–2 cm posterior to the neck. ABR signals were acquired, filtered, amplified, and analyzed using equipments and software (BioSig) manufactured by Tucker-Davis Technologies. ABRs were obtained by averaging of 500 recordings (10 per second) at different intensities. ABR thresholds were defined as the lowest sound intensity capable of eliciting a response pattern characteristic of that seen at higher intensities.
Cortical mapping and data analysis.
Under pentobarbital anesthesia, the trachea was cannulated to ensure adequate ventilation and the cisterna magnum drained of CSF to minimize cerebral edema. The skull was secured in a head holder leaving the ears unobstructed. After reflecting the right temporalis muscle, the auditory cortex was exposed and the dura was resected. The cortex was maintained under a thin layer of viscous silicone oil to prevent desiccation. Throughout the surgical procedures and during the recording session, a state of areflexia was maintained with supplemental doses of dilute pentobarbital (8 mg/ml) injected intraperitoneally.
Cortical responses were recorded with parylene-coated tungsten microelectrodes (1–2 MΩ at 1 kHz; FHC) in a shielded, double-walled sound chamber. Recording sites were chosen to evenly sample from the auditory cortex while avoiding blood vessels, and were marked on a magnified digital image of the cortical surface vasculature. At each recording site, the microelectrode was lowered orthogonally into the middle cortical layers (∼500 μm), where vigorous stimulus-driven responses were recorded. Acoustic stimuli were generated using TDT System III (Tucker-Davis Technologies) and delivered to the left ear through a calibrated STAX earphone with a sound tube positioned inside the external auditory meatus. A software package (SigCal, SigGen, and Brainware; Tucker-Davis Technologies) was used to calibrate the earphone, generate acoustic stimuli, monitor cortical response properties on-line, and store data for off-line analysis.
Frequency tuning curves were reconstructed by presenting pure tones of 50 frequencies (1–30 kHz, 25 ms duration, 5 ms ramps) at eight sound intensities (0–70 dB SPL in 10 dB increments) to the contralateral ear in a random, interleaved sequence at a rate of 2 pps. The characteristic frequency (CF) of a cortical site was defined as the frequency at the tip of the V-shaped tuning curve. For flat-peaked tuning curves, CF was defined as the midpoint of the plateau at threshold. For tuning curves with multiple peaks, CF was defined as the frequency at the most sensitive tip (i.e., with lowest threshold). Response bandwidths 20 dB above threshold of tuning curves (BW20s) were measured for all sites.
As previously described (Polley et al., 2006, 2007), the A1 was identified based on the unique rostral-to-caudal tonotopy and reliable neuronal responses to tone pips of selective frequencies. To generate A1 maps, Voronoi tessellation (a Matlab routine; The MathWorks) was performed to create tessellated polygons, with electrode penetration sites at their centers. Each polygon was assigned the characteristics (i.e., CF) of the corresponding penetration site. In this way, every point on the surface of the auditory cortex was linked to the characteristics experimentally derived from a sampled cortical site that was closest to this point.
To document the cortical temporal modulation-transfer functions (tMTFs), trains of six tonal pulses (25 ms duration with 5 ms ramps at 60 dB SPL) were delivered four times at each of eight repetition rates (2, 4, 7, 10, 12.5, 15, 17.5, and 20 pps) in a randomly interleaved sequence. The tone frequency was set at the CF of each site. The tMTF is the normalized cortical response (i.e., average response to the last five pulses divided by the response to the first pulse) as a function of the temporal rate (Kilgard and Merzenich, 1998; Bao et al., 2004; Zhou and Merzenich, 2009). The cortical ability for processing repetitive stimuli was estimated with the highest temporal rate at which the tMTF was at one-half its maximum (fh1/2).
Vector strength (Goldberg and Brown, 1969; Lu et al., 2001; Joris et al., 2004) was calculated using the following equation:
where n is the total number of spikes, ti (i = 1, 2, … n) is the time between the onset of the first pulses and the ith spike, and T is the interstimulus interval. Spikes that occurred during a 6T period after the onset of the first tonal pulse were included to compute vector strength.
The degree of synchronization between cortical sites was assessed by recording in silence for 10 periods of 10 s spontaneous neuronal spikes from two to four electrodes simultaneously. Cross-correlation functions were computed from each electrode pairs by counting the number of spikes coincidences for time lags of −50 to 50 ms with 1 ms bin size and were normalized by dividing each of its bins by the square root of the product of the number of discharges in both spike trains (Brosch and Schreiner, 1999). Neural events occurring within 10 ms of each other in two channels were considered synchronous. The degree of synchronization may be correlated with spike rates in a nonlinear manner. For each pair of spike trains, we estimated the number of synchronized events if the two spike trains were not correlated, using NANBΔT, where NA and NB are the numbers of spikes in the two spike trains, Δ (= 21 ms) is the bin size, and T is the duration of the recording (Eggermont, 1992; Bao et al., 2003). The strength of the synchrony was then assessed using a Z score (Eggermont, 1992) as follows:
 |
For neural synchrony recording, off-line spike sorting using TDT OpenSorter (Tucker-Davis Technologies) was performed to include only single units in the analysis.
Quantitative immunoblotting and ELISA.
Rats used for quantitative immunoblotting and ELISA were not those used for electrophysiological experiment but were otherwise treated in the same way. Rats were anesthetized with an intraperitoneal injection of sodium pentobarbital, and the overall boundaries of the right A1 were functionally determined using electrophysiological recording procedures as above. Animals were then deeply anesthetized with an additional dose of sodium pentobarbital. The right A1 was rapidly dissected, frozen in dry ice, and stored at −80°C until processing.
For quantitative immunoblotting analysis, synaptoneurosomes were prepared as described previously (Hollingsworth et al., 1985) with slight modifications. Equal amounts of synaptoneurosomal proteins (7–10 μg), determined using the BCA assay (Pierce), were resolved in 4–15% polyacrylamide gels and transferred to PVDF (polyvinylidene difluoride) membranes. Membranes were probed with primary antibodies, followed by the appropriate secondary antibody conjugated with infrared dyes (LI-COR Biosciences). Primary antibodies used were anti-GABAA α1 (1:200; Millipore Bioscience Research Reagents), anti-GABAA β2/3 (1:1000; Millipore), anti-AMPA GluR2 (1:500; Millipore Bioscience Research Reagents), anti-NMDA NR2a (1:400; Millipore), anti-NMDA NR2b (1:1000; Millipore), and anti-actin (1:1000; Millipore Bioscience Research Reagents). Immunoreactive bands were visualized and quantified using Odyssey Infrared Imaging System (LI-COR Biosciences). The relative levels of each protein were calculated as a ratio against actin, normalized to those of naive controls run in the same gel.
For the determination of brain-derived neurotrophic factor (BDNF) levels, fragments of the A1 were lysed and acidified as described (Okragly and Haak-Frendscho, 1997). Total protein concentrations were determined using the BCA assay (Pierce). BDNF was quantified using an ELISA kit (Human BDNF Quantikine kit; R&D Systems) as per the manufacturer's protocol.
Results
In an initial experimental series, rats were exposed to continuous, moderately intense (65 dB SPL) white noise over a 6 week period beginning at postnatal week 8 (Pw8). ABR measurement and cortical recording were then conducted on these noise-exposed (NE) rats, and data were compared with that of age-matched naive control rats reared under standard, quiet housing conditions (Fig. 1A).
Figure 1.

Cortical frequency representation and response selectivity. A, Experimental timelines for NE and age-matched naive control rats. B, ABR thresholds obtained in NE rats relative to normative ABR thresholds measured in control rats. Positive values indicate larger ABR thresholds compared with control rats. Dashed lines, Range of normative ABR thresholds (±2 SD). C, Representative CF maps recorded from A1 of NE and control rats. The color of each polygon in these maps indicates the CF for neurons recorded at that site (see color scales). Polygons are Voronoi tessellations representing each neuronal middle-cortical-layer response sample site, generated so that every point on the cortical surface was assumed to have the characteristics of its closest neighbors. A, Anterior; D, dorsal. D, Comparison of the distributions for CFs between NE and control rats. E, Representative examples of tonal receptive fields. F, Comparison of the receptive field bandwidths (BW20s) between NE and control rats. Error bar represents SEM. *p < 0.00012.
Figure 1B shows the ABR thresholds of NE rats (N = 7) relative to normative ABR thresholds measured in control rats (N = 9). All these ABR data for NE rats were within the normal ±2 SD boundaries. Statistical analysis showed no significant difference in ABR threshold between NE and control rats at each frequency determined (t test, all p > 0.48). These results indicate normal hearing threshold for NE rats.
Highly significant differences in frequency tuning, temporal response characteristics, and response coordination, however, were documented in A1 in NE rats (N = 7) compared with control rats (N = 9). As has been shown in many previous studies (Zhang et al., 2001; Polley et al., 2007; Insanally et al., 2009), A1 was relatively predictably topographically (tonotopically) organized in control rats, with isofrequency bands oriented approximately orthogonal to a systematic rostrocaudal frequency representation gradient. A1 tonotopy was distorted in NE rats, to proportionally exaggerate and proportionally reduce the territories representing higher and lower frequencies, respectively (Fig. 1C, NE vs control). That conclusion was confirmed by quantitative comparisons of the distributions for all CFs obtained from both rat groups (Fig. 1D). A significant rightward shift of CF distribution for NE rats compared with control rats (Kolmogorov–Smirnov test, p < 0.0001) documented increased A1 areas of representation for higher frequencies but decreased representational areas of lower frequencies, induced by chronic noise exposure.
Neurons all across A1 responded less selectively (neurons were less sharply tuned) to sound frequencies in NE than in control rats (Fig. 1E, NE vs control). The tuning curve bandwidths measured 20 dB above threshold (BW20s) provided an index of that frequency selectivity, which was significantly and systematically degraded by this chronic noise exposure (Fig. 1F) (t test, all p < 0.00012).
Temporal responses in A1 of both rat groups were also examined by recording cortical responses to CF tonal pulses delivered at variable rates. In control rats, most cortical neurons could follow repeated stimuli at and below rates of 10 pps with each successive tone pulse evoking a similar number of spikes as did the first tone in the train. By contrast, most A1 neurons in NE rats only followed stimuli at or below 7 pps (Fig. 2A, NE vs control). For tMTFs in which normalized cortical responses were defined as a function of stimulus repetition rates (Fig. 2A, insets), responses decreased at high repetition rates (i.e., 7–15 pps) in NE compared with control rats (Fig. 2B, top left) (t test, p < 0.05–0.00001). A comparison of the distributions for the highest temporal rates at which tMTF was at one-half of its maximum (fh1/2, a measure of the cortical capacity for processing high rate stimuli) also showed a significant leftward shift for NE versus control rats (Fig. 2B, top right) (Kolmogorov–Smirnov test, p < 0.001), again demonstrating the decreased rate-following ability induced by noise exposure, for neurons across all CF ranges (Fig. 2B, bottom left) (t test, p < 0.05–0.00001).
Figure 2.
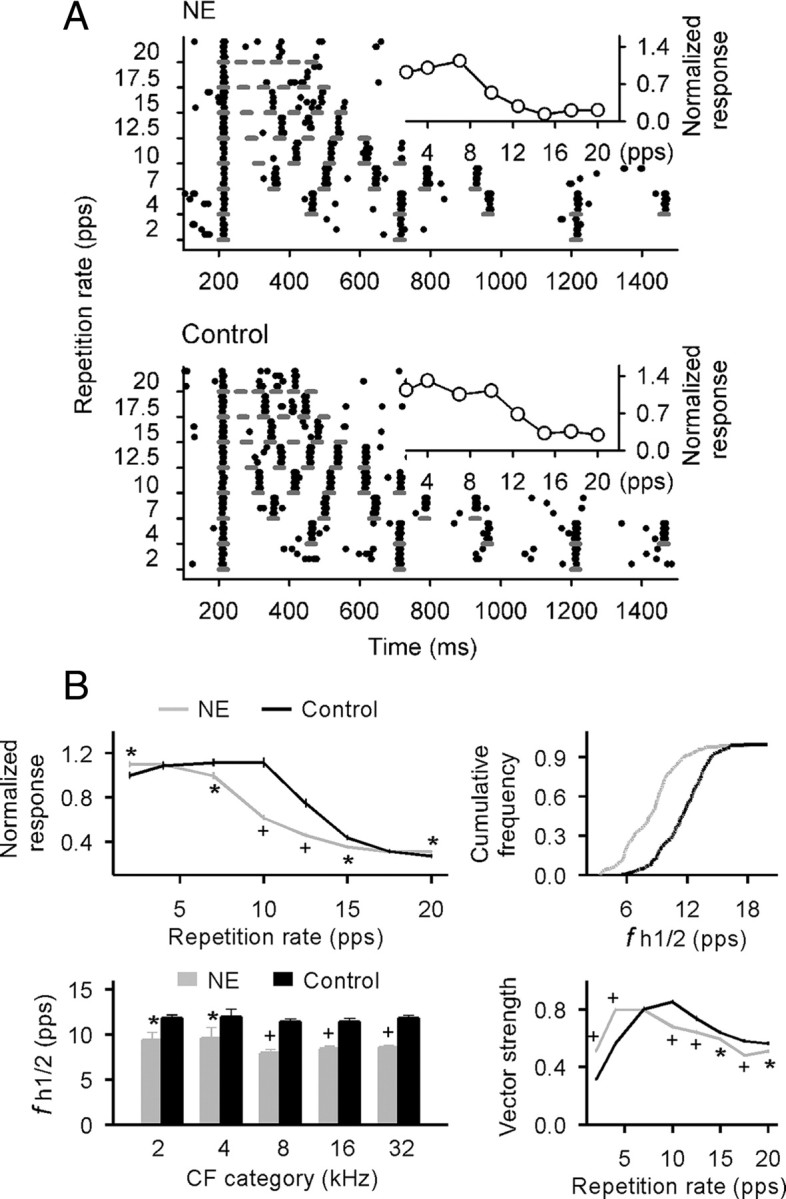
Cortical temporal response characteristics. A, Dot raster plots of cortical responses to pulse trains of different repetition rates recorded from NE (top) and age-matched naive control (bottom) rats. The short line indicates pulse duration. The inset shows the tMTF for each raster plot example. B, Average tMTFs (top left), distributions for the highest temporal rate at which cortical responses were at one-half of their maximum (i.e., fh1/2; top right), average fh1/2 (bottom left), and average vector strengths measured at different pulse repetition rates (bottom right) for all recordings in NE and control rats. Error bar represents SEM. *p < 0.05; +p < 0.00001.
To characterize the precision of spike timing relative to stimulus phases, we calculated vector strengths, which quantify the degree of phase locking of neural responses to successive, identical stimuli. Although the average vector strengths as a function of stimulus repetition rates followed the same bandpass patterns for both rat groups, the curve was again shifted leftward and peaked at lower repetition rates in NE versus control rats (peaked at 4 pps in NE rats vs 10 pps in control rats) (Fig. 2B, bottom right). Note that vector strengths were smaller at high repetition rates, but larger at low rates, in NE versus control rats (t test, p < 0.05–0.00001).
Neural synchrony was documented in A1 by simultaneously recording spike activity during spontaneous activity periods from cortical neurons separated by variable distances (318 recording pairs from five NE rats and 282 pairs from four control rats). We considered all spikes that occurred in two recording channels within 10 ms of one another to be synchronized events. As shown in left of Figure 3A, the average correlograms normalized for firing rates between −10 and 10 ms lags differed significantly between the two groups (0.039 ± 0.0006 for NE rats and 0.061 ± 0.0009 for control rats; t test, p < 0.00001), with a narrower temporal dispersion recorded in NE rats. The distributed patterns of spontaneous activity correlation reflecting distributed cortical network coupling also differed significantly between them. In our analysis, the observed frequency of occurrence of synchronized events for the two neurons was corrected for the expected chance occurrence of a synchronous event. The resulting average Z score for pairs of simultaneously recorded cortical sites in both groups decreased as a function of interelectrode distances (Fig. 3A, right) (ANOVA, both p < 0.0001). However, values were lower at all electrode separations, and correlations were recorded over shorter cortical distances in NE than in control rats (t test, all p < 0.0005 at separations ranging from 0.3 to 0.9 mm). Induced changes applied for cortical zones representing low (<3.1 kHz), middle (3.1–9.5 kHz), and high (>9.5 kHz) frequencies (Fig. 3B) (t test, p < 0.05–0.00001).
Figure 3.

Neural synchrony in A1. A, Average normalized cross-correlation functions (left) and Z score of neuronal firing synchrony as a function of distance between two recording sites (right) for NE and control rats. Error bar represents SEM. *p < 0.0005. B, Average Z scores of neuronal firing synchrony across representative A1 regions for low (<3.1 kHz), middle (3.1–9.5 kHz), and high (>9.5 kHz) frequencies for NE and control rats. *p < 0.05; +p < 0.00001.
To determine the enduring impacts of noise exposure on A1 response properties after the noise exposure epoch was terminated, 10 additional NE rats were returned to a normal auditory environment and mapped 2 weeks (N = 4) or 8 weeks (N = 6) after the end of noise exposure (Fig. 4A). BW20, fh1/2, and correlation coefficients for correlograms (between −10 and 10 ms from simultaneity) were measured and compared with data from NE rats recorded immediately after exposure, and with data from age-matched control rats (N = 5). By these indices, the functional status of A1 recorded 2 weeks after the noise exposure was comparable with that recorded immediately after exposure (Fig. 4B, NE-2 weeks vs NE) (ANOVA with post hoc Student–Newman–Keuls test, both p > 0.05)—that is, it still differed to about the same degree, in both of these indices, from control rats (Fig. 4B, NE-2 weeks vs control) (ANOVA with post hoc Student–Newman–Keuls test, both p < 0.001). By contrast, data recorded 8 weeks after the noise exposure significantly differed (were reversed) from that recorded immediately after exposure (Fig. 4B, NE-8 weeks vs NE) (ANOVA with post hoc Student–Newman–Keuls test, all p < 0.001), and indices of A1 function were now comparable with data from normal, never-exposed control rats (Fig. 4B, NE-8 weeks vs control) (ANOVA with post hoc Student–Newman–Keuls test, all p > 0.05). As expected, data recorded 2 weeks after the noise exposure were significantly different from that recorded 8 weeks after exposure (Fig. 4B, NE-2 weeks vs NE-8 weeks) (ANOVA with post hoc Student–Newman–Keuls test, both p < 0.001). These results documented a restoration of normal response properties for NE rats after their return to a normal acoustic environment for a period over several weeks.
Figure 4.

Restoration of normal response properties for NE rats after being returned to a normal environment. A, Experimental timelines for different groups of rats. NE-2 weeks or NE-8 weeks, NE rats that were returned to a normal auditory environment and mapped at Pw16 or Pw22 (i.e., 2 or 8 weeks after the end of noise exposure). B, Response properties of NE rats measured immediately, 2 weeks, or 8 weeks after the noise exposure, illustrating with naive control rats. Note that we did not record correlation coefficient for NE-2 weeks rats. Error bar represents SEM. *p < 0.001.
In the data described to this point, NE rats were exposed to continuous noise beginning at Pw8. At this age, the rat is approaching sexual maturity, and A1 has matured far beyond the normal closure of the critical period window (a month after the birth) (Zhang et al., 2001; Hsieh et al., 2002; Insanally et al., 2009) for passive sound exposure-driven plasticity. Since tone-specific enlargement in A1 representation resulting from transient exposure to sound stimuli is one basic index of critical period plasticity (Zhang et al., 2001), we directly confirmed the postcritical period status of normal rats at this age by exposing them to pulsed 7 kHz tone pips over a week (Fig. 5A). As has been recorded in previous studies (de Villers-Sidani et al., 2007; Insanally et al., 2009), in striking contrast to rats in the normal early critical period, this exposure produced no measurable alteration of A1 tonotopy compared with age-matched control rats [Fig. 5B, tone-exposed (TE) vs control] (t test, all p > 0.3).
Figure 5.

Transient tone exposure beyond the critical period does not alter A1 tonotopy. A, Experimental timelines for different groups of rats. Note that TE rats were exposed to 7 kHz tones at Pw8, which is the onset of noise exposure for NE rats (Fig. 1A). B, Differences in percentages of the A1 area tuned to different frequency ranges for TE (N = 4) versus control (N = 4) rats. Note that the percentage of A1 area representing each frequency range in TE rats was comparable with that in control rats.
By contrast, a subset of NE rats (N = 7) were identically exposed to pulsed 7 kHz tones for 1 week, beginning at the end of their noise exposure epoch [these rats were thus defined as noise-exposed plus tone-exposed rats (i.e., NE+TE rats)] (Fig. 6A). The functional status of these rats was compared with that of age-matched non-sound-exposed control rats (N = 12). The A1 zone that selectively responded to 7 kHz was enlarged by mere sound exposure in these NE+TE rats compared with control rats (Fig. 6B, NE+TE vs control), just as in infant critical period rats. This frequency-specific distortion in A1 is illustrated in a second way in Figure 6C, where CFs of all recording sites from each group of rats were plotted against a normalized tonotopic axis. Examination of the CF distribution reveals an overrepresentation of sites tuned to 7 kHz, and a relative underrepresentation of sites tuned to immediately lower and higher sound frequencies for NE+TE rats, when compared with control rats (Fig. 6C, NE+TE vs control). To quantitatively characterize the effects of pulsed tone exposure on A1 frequency representation, the percentages of A1 areas representing each frequency range were averaged within the same experimental group and the differences between exposed and control animals plotted (Fig. 6D). Average percentage of the A1 areas tuned to 7 kHz ± 0.25 octaves in NE+TE rats was very significantly increased compared with control rats (Fig. 6D, NE+TE vs control) (ANOVA with post hoc Student–Newman–Keuls test, p < 0.001). It should be noted that the magnitudes of these sound exposure-induced changes paralleled those resulting from a matched period of exposure in the critical period in infant rats. As in those infants (Zhang et al., 2001; de Villers-Sidani et al., 2007; Insanally et al., 2009), the percentages of A1 area tuned to frequencies that were just below or just above the exposed tone frequency were also reduced (Fig. 6D, NE+TE vs control) (ANOVA with post hoc Student–Newman–Keuls test, p < 0.05 at 9.9 kHz). It is also important to note that, whereas A1 areas representing lower frequencies were reduced but those representing higher frequencies were enlarged for NE-controls (N = 4) (Fig. 6B–D, NE-control vs control) (ANOVA with post hoc Student–Newman–Keuls test, both p < 0.05 at 2.5 and 28 kHz), the CF distributions in TE-control rats (N = 7) were not statistically distinguishable from those recorded in completely naive, age-matched controls (Fig. 6B–D, TE-control vs control) (ANOVA with post hoc Student–Newman–Keuls test, all p > 0.05).
Figure 6.

Noise exposure reinstates critical period plasticity in A1. A, Experimental timelines for NE+TE, TE-control, NE-control, and age-matched naive control rats. B, Representative CF maps obtained from NE+TE, TE-control, NE-control, and control rats. Outlined polygons indicate recording sites with CF of 7 kHz ± 0.25 octaves. C, Distributions of CFs plotted against a normalized tonotopic axis in different groups of rats. Note that there were increased A1 sites that were tuned to 7 kHz (dashed line) in NE+TE rats, but not in TE-control or NE-control rats, when compared with control rats. D, Differences in percentages of the A1 area tuned to different frequency ranges for NE+TE, TE-control, or NE-control rats versus control rats. *p < 0.05, +p < 0.001, compared with control rats.
Cortical changes induced by passive sound exposure during the critical period in infants have been shown to be relatively long-enduring (Zhang et al., 2001; Hensch, 2004; Zhou and Merzenich, 2008). To evaluate the long-term impacts of tone exposure on cortical representations in the new sensitive period induced in NE rats, four NE+TE rats were returned to a normal auditory environment and mapped 7 weeks later (Fig. 7A). We found that percentages of the A1 area tuned to 7 kHz ± 0.25 octaves for these NE+TE rats were still larger than control rats (Fig. 7B, NE+TE-7 weeks vs control) (ANOVA with post hoc Student–Newman–Keuls test, p < 0.001), just as NE+TE rats measured 1 week after the end of the tone exposure (Fig. 7B, NE+TE vs control) (ANOVA with post hoc Student–Newman–Keuls test, p < 0.001). Again, the percentages of A1 area tuned to frequencies just below or just above 7 kHz were reduced for both NE+TE-7 weeks and NE+TE rats compared with control rats (NE+TE-7 weeks or NE+TE vs control; ANOVA with post hoc Student–Newman–Keuls test, all p < 0.05 at 5, 9.9, and 14 kHz). Thus, as in the early postnatal critical period, the plasticity changes induced by tonal exposure after noise exposure persisted with little change for up to at least 7 weeks after that exposure.
Figure 7.

Long-term impacts of tone exposure on A1 representation. A, Experimental timelines for different groups of rats. NE+TE-7 weeks, NE+TE rats were returned to a normal auditory environment and mapped at Pw22 (i.e., 7 weeks after the end of tone exposure). B, Differences in percentages of the A1 area tuned to different frequency ranges for NE+TE or NE+TE-7 weeks rats versus control rats. Error bar represents SEM. *p < 0.05, +p < 0.001, compared with control rats.
To examine whether noise exposure would induce the same plastic changes in A1 in older rats, we initiated the noise exposure protocol in a second series of experiments conducted in 1-year-old animals. Chronic noise exposure similarly exaggerated the A1 area representing higher frequencies but reduced that representing lower frequencies for these NE or NE-old rats (Fig. 8A,B, NE or NE-old vs control) (Kruskal–Wallis with post hoc Dunn's test, both p < 0.001). The average BW20 of A1 sites also increased compared with control rats (Fig. 8C, NE or NE-old vs control) (ANOVA with post hoc Student–Newman–Keuls test, p < 0.05–0.001 except for NE-old vs control at 2 kHz). Some of these NE-old rats were again exposed to 7 kHz tonal stimuli immediately after the noise exposure epoch (Fig. 9A). A dramatic frequency-specific distortion in A1 was again evoked by mere passive sound exposure, in NE+TE rats but not in TE-control rats, with both groups again indexed by data from completely naive nonexposed rats of the same age (Fig. 9B–D) (ANOVA with post hoc Student–Newman–Keuls test, p < 0.001).
Figure 8.

Postexposure effects on A1 of rats older than 1 year. A, Representative CF maps recorded from A1 of exposed (NE-old; N = 4) and age-matched control rats (N = 5). Note that NE-old rats were chronically exposed to noise for 7 weeks beginning at age of 1 year. B, Distributions for CFs recorded from NE (i.e., rats were exposed to noise for 6 weeks beginning at Pw8) (Fig. 1A), NE-old, and control rats. Significant rightward shift of CF distributions for both exposed rat groups compared with control group indicates increased A1 areas of representation for higher frequencies but decreased representational areas of lower frequencies, induced by chronic noise exposure. C, Average BW20s of different rat groups. Error bar represents SEM. *p < 0.05; +p < 0.001.
Figure 9.

Noise exposure reinstates cortical period plasticity in A1 of rats older than 1 year. A, Experimental timelines for different groups of rats. Note that NE+TE rats were exposed to pulsed 7 kHz tones for a subsequent 1 week period after 7 weeks of noise exposure beginning at age of 1 year. B, Representative CF maps showing overrepresentation of 7 kHz for NE+TE rats compared with age-matched TE-control and naive control rats. C, Distributions of CFs plotted against a normalized tonotopic axis for NE+TE (N = 5), TE-control (N = 4), and naive control (N = 5) rats. D, Differences in percentages of the A1 area tuned to different frequency ranges for NE+TE or TE-control rats versus control rats. *p < 0.001, compared with control rats.
To begin to document the auditory system changes that paralleled the reestablishment of the critical period, levels of cortical inhibition and excitation were documented in NE and NE-8 weeks rats by using quantitative immunoblotting. The data were then compared with those obtained in naive control rats at Pw14 and in immature rats at postnatal day 7 (Pd7) and Pd12. Pd7 is before the critical period of A1 development for this rat species, whereas Pd12 is within the critical period. Antibodies that recognize α1 and β2/3 subunits of GABAA receptors were used to assay changes in cortical inhibition. Antibodies that recognize the NR2a and NR2b subunits of NMDA receptors and the GluR2 subunit of AMPA receptors were used to track changes in cortical excitation. Quantitative immunoblotting revealed significant lower expression levels of these molecules in the auditory cortex of immature rats compared with adult control rats (Fig. 10A,B, Pd7 or Pd12 vs control) (ANOVA with post hoc Student–Newman–Keuls test, all p < 0.005 except for α1 at Pd12). Noise exposure significantly decreased the expression of α1, β2/3, NR2a, and NR2b subunits (Fig. 10A, NE vs control) (ANOVA with post hoc Student–Newman–Keuls test, p < 0.05–0.005) but with no effects on the expression of GluR2 subunit (Fig. 10B, NE vs control) (ANOVA with post hoc Student–Newman–Keuls test, p > 0.05). We also measured cortical BDNF levels by using an ELISA method for different rat groups. Again, expression levels of BDNF in immature rats were significantly lower than that of adult control rats (Fig. 10C, Pd7 or Pd12 vs control) (ANOVA with post hoc Student–Newman–Keuls test, both p < 0.001). A decreased expression of BDNF was recorded in cortical field A1 of NE rats compared with control rats (Fig. 10C, NE vs control) (ANOVA with post hoc Student–Newman–Keuls test, p < 0.001). All of these molecular changes in A1 of NE rats were substantially or completely reversed to normal adult titers by returning NE rats to a normal acoustic environment for 8 weeks after the end of noise exposure (Fig. 10A,C, NE-8 weeks vs control) (ANOVA with post hoc Student–Newman–Keuls test, all p > 0.05).
Figure 10.

Molecular changes in A1 induced by noise exposure. A, B, Expression levels of GABAA α1 and β2/3 subunits, NMDA NR2a and NR2b subunits (A), and AMPA GluR2 subunit (B) measured by using quantitative immunoblotting, for different rat groups. See Figure 1A for experimental timelines of NE and control rats, and Figure 4A for experimental timeline of NE-8 weeks rats. The insets show representative Western blots. Error bar represents SEM. *p < 0.05, +p < 0.005, compared with control rats. The numbers of animals used for measurement are shown in Table 1. C, BDNF level measured by using an ELISA method, for different rat groups. *p < 0.001, compared with control rats.
Table 1.
Number of animals in each group used for quantitative immunoblotting and ELISA
| NE | NE-8 weeks | Control | Pd7 | Pd12 | |
|---|---|---|---|---|---|
| α1 | 8 | 9 | 8 | 7 | 7 |
| β2/3 | 9 | 9 | 9 | 7 | 7 |
| NR2a | 5 | 6 | 8 | 8 | 8 |
| NR2b | 6 | 6 | 8 | 8 | 7 |
| GluR2 | 6 | 6 | 9 | 7 | 7 |
| BDNF | 5 | 5 | 5 | 5 | 5 |
Discussion
For >50 years, the neuroscience mainstream has viewed brain development as a multiple-stage process that begins with a precritical period epoch, advances into a relatively short-duration, highly plastic critical period, and then progresses relatively abruptly into a third aplastic or less plastic adult phase. That critical period is usually described as a developmental stage during which mere exposure to visual or sound or tactual or other stimuli drives substantial neurological specialization or change (Berardi et al., 2000; Hensch, 2004; Knudsen, 2004). Over the past 30 years, scientists have revised their view of the nature and power of adult plasticity. We now know that the adult brain is continuously plastic, but that in contradistinction to the critical period epoch, plasticity in the older brain expressed in primary cortical areas is strongly modulated as a function of behavioral state and behavioral outcomes (Weinberger, 1995; Buonomano and Merzenich, 1998; Gilbert et al., 2009; de Villers-Sidani et al., 2010). Here, we add to the evidence supporting a second major revision in our understanding of these change progressions: at least some of the very complex chemical, physical, and functional changes resulting in the transition to an adult stage are reversible (Fagiolini and Hensch, 2000; Pizzorusso et al., 2002; He et al., 2006; Maya Vetencourt et al., 2008; Baroncelli et al., 2010; Harauzov et al., 2010).
In this study, we documented a great capacity for naturally driving “negative” cortical changes, by exposing postcritical period rats over a several-week-long period to continuous, moderate-level noise. Because all subsequent plasticity in the rat must occur in the presence of this always-present noise, we hypothesized that this should ultimately result in the plastic degradation of the selective representation of the detailed features of sound stimuli within the auditory system and cortex. Those changes were expected to be expressed through fundamental plastic changes in excitatory and inhibitory neuronal processes contributing to now-very-noisy sound stimulus representations. Our hypothesis was confirmed. A wide range of such changes are here documented to occur in the cortex, and in most respects, after this exposure, A1 reacquired characteristics that apply for this cortical area in the critical period in a less mature (infantile) state. A1 was producing less GABAA α1 and β2/3 subunits, and NMDA receptor NR2a and NR2b subunits; a primary trophic factor that contributes critically to vigorous critical period plasticity, BDNF, was also downregulated; spectral responses were less selective; representational topography favored high and disfavored low frequency representations; temporal responses were sluggish, and imprecise at higher input rates; cortical activities were less temporally and spatially dispersed. All of these aspects of cortical function and structure moved in the direction of the “more immature” A1 (Zhang et al., 2001; Berardi et al., 2003; Chang and Merzenich, 2003; Chang et al., 2005; Hensch, 2005; Daw et al., 2007). Moreover, this complex series of changes was again paralleled by an emergent sound exposure-sensitive epoch—a new critical period—in these rats. The plastic distortion induced in a juvenile animal was of the same magnitude as that generated in an infant critical period rat. This sound exposure-induced remodeling endured in the cortex, just as it does when induced in the infant critical period (Zhang et al., 2001; de Villers-Sidani et al., 2007; Zhou and Merzenich, 2008). Identical reversals in the indices of cortical maturation were also recorded in older rats, strongly indicating that these many aspects of cortical maturation can regress at any age in life. However, when the cortex was allowed to again progress in its organization by returning the animal back to a normal acoustic environment, A1 again evolved back to an adult status reflected by a re-reversal of the indices of maturity described above—changing in them, just as it does in the transition from the critical period to the adult stage, in a normal early life (Zhang et al., 2001; Chang and Merzenich, 2003; Chang et al., 2005; Hensch, 2005; Daw et al., 2007).
Some other studies have also recently shown that chronic passive exposure to a special form of noise (very rapid, randomly delivered tonal stimuli) results in broadened frequency tuning in A1 zone representing frequencies of exposed tones in adult cats (Noreña et al., 2006; Pienkowski and Eggermont, 2009, 2010). Here, we show that these noise-induced changes actually reinstate passive sound exposure-driven plasticity, and show that a wide array of complex changes are reversed by returning these young now-adult animals into a normal acoustic environment. Again, the noise exposure did not impair the peripheral hearing as demonstrated by the ABR measurement. Interestingly, the recovery from the negative changes induced by noise are distinguished from cortical changes induced by transient sound exposure during the critical period, in that the latter changes do not rapidly fade but, to the contrary, persist long after they are induced (Zhang et al., 2001; de Villers-Sidani et al., 2007; Zhou and Merzenich, 2008).
Studies directed toward understanding the relatively abrupt transition from the critical period to the adult cortical stage have focused on GABAergic inhibition, NMDA receptors, and BDNF, all argued to play important roles in regulating or enabling changes that express that transition (Huang et al., 1999; Berardi et al., 2000, 2003; Fagiolini and Hensch, 2000; Fagiolini et al., 2004; Hensch, 2005; Hensch and Fagiolini, 2005). Here, we recorded reversible changes in all of the three usual suspects (GABAA α1 and β2/3 subunits, NMDA NR2a and NR2b subunits, and BDNF). It might be noted that one index of cortical maturity measured in this study, the expression level of AMPA receptor GluR2 subunit, did not change after noise exposure. Significant changes in glutamate receptor expression were also found in the adult primate somatosensory cortex after peripheral nerve compression (Mowery and Garraghty, 2009).
In the visual cortex, reduction of GABAergic inhibition has been shown to reopen a period of stimulus exposure-based plasticity (Sale et al., 2007; Maya Vetencourt et al., 2008; Harauzov et al., 2010), revealing what Hensch and colleague (Morishita and Hensch, 2008) described as a conserved potential for plasticity carried into adulthood. Similarly, returning older rats to continuous darkness or environmental enrichment has been shown to reopen an epoch of ocular dominance plasticity (He et al., 2006, 2007; Baroncelli et al., 2010). Again, changes in GABAergic inhibitory processes were recorded in parallel with this apparent critical period reopening. Recent studies also argue that the embryonic Otx2 homeoprotein controls changes in parvalbumin GABAA neurons that may open and close the critical period in the visual cortex (Sugiyama et al., 2008). Changes in A1 responses after noise exposure (i.e., degraded frequency tuning and more sluggish temporal responses) are similar to those resulting from reduced cortical GABAergic inhibition (Wang et al., 2000; Caspary et al., 2008). Immunoblotting data revealing a decrease in the expression level of GABAA α1 and β2/3 subunits in A1 of NE rats, and the restoration of their levels after the post-noise exposure recovery of these inhibition-dependent response characteristics all support this conclusion that parvalbumin-containing neurons and other processes involving GABAA receptors have also been weakened by chronic noise exposure.
It has been argued that the degree of critical period-like plasticity is a titrated function of the level of GABAA activity (Hensch, 2005). Many previous studies have shown that cortical inhibition plays an important role in shaping neuronal processing in A1 (Wang et al., 2000; Wehr and Zador, 2003; Wu et al., 2008), as in the visual cortex. The mature, functionally differentiated cortex, with its strongly and powerfully selective inhibitory processes in place, responds with greater cooperativity, reliability, and predictably. Our study indicates that the processes degrading GABAA inhibition and therefore enabling plasticity trade off against response reliability and stability, and indicates that this trade-off is subject to continuous fluctuation over the course of a lifetime. Ongoing studies are designed to define strategies for manipulating this “set point” for plasticity in older brains, and for further elucidating the many theoretical and practical implications of these findings.
Dark-rearing studies showed that prolonged sensory deprivation can induce plasticity in adult visual cortex (He et al., 2006, 2007). Here, we provide evidence showing that the absence of patterned activity, rather than a decrease of activity per se, may be the key for reinstating plasticity in the adult cortex. Although it has been shown that an external intervention changing the excitation/inhibition balance or altering the extracellular matrix can reintroduce plasticity in the visual cortex (Fagiolini and Hensch, 2000; Pizzorusso et al., 2002, 2006; Putignano et al., 2007; Maya Vetencourt et al., 2008; Silingardi et al., 2010), the present study indicates that this nonstructured sensory bombardment can by itself drive a change in inhibitory and excitatory circuits, and a reduction in elements of the extracellular matrix linked to the reinstatement of plasticity in the cortex. Additional studies combining in vivo patch-clamp recording and pharmacological techniques shall provide additional insights on the underlying mechanisms.
Footnotes
This work was supported by the Program for New Century Excellent Talents in China, Shanghai Rising-Star Program Grant 09QH1400900, the Fundamental Research Funds for the Central Universities in China, National Institutes of Health grants, and a grant from Fundação de Amparo à Pesquisa do Estado do Rio de Janeiro. R.P. is a recipient of the Long-Term Fellowship from the Human Frontier Science Program. E.d.V.-S. is supported by a Clinician–Scientist Award of the Canadian Institutes of Health Research. C.M. is supported by predoctoral fellowships from Conselho Nacional de Desenvolvimento Científico e Tecnológico. We thank M. P. Stryker for helpful comments on this manuscript and T. Babcock for technical support.
References
- Bao S, Chang EF, Davis JD, Gobeske KT, Merzenich MM. Progressive degradation and subsequent refinement of acoustic representations in the adult auditory cortex. J Neurosci. 2003;23:10765–10775. doi: 10.1523/JNEUROSCI.23-34-10765.2003. [DOI] [PMC free article] [PubMed] [Google Scholar]
- Bao S, Chang EF, Woods J, Merzenich MM. Temporal plasticity in the primary auditory cortex induced by operant perceptual learning. Nat Neurosci. 2004;7:974–981. doi: 10.1038/nn1293. [DOI] [PubMed] [Google Scholar]
- Baroncelli L, Sale A, Viegi A, Maya Vetencourt JF, De Pasquale R, Baldini S, Maffei L. Experience-dependent reactivation of ocular dominance plasticity in the adult visual cortex. Exp Neurol. 2010;226:100–109. doi: 10.1016/j.expneurol.2010.08.009. [DOI] [PubMed] [Google Scholar]
- Berardi N, Pizzorusso T, Maffei L. Critical periods during sensory development. Curr Opin Neurobiol. 2000;10:138–145. doi: 10.1016/s0959-4388(99)00047-1. [DOI] [PubMed] [Google Scholar]
- Berardi N, Pizzorusso T, Ratto GM, Maffei L. Molecular basis of plasticity in the visual cortex. Trends Neurosci. 2003;26:369–378. doi: 10.1016/S0166-2236(03)00168-1. [DOI] [PubMed] [Google Scholar]
- Brosch M, Schreiner CE. Correlations between neural discharges are related to receptive field properties in cat primary auditory cortex. Eur J Neurosci. 1999;11:3517–3530. doi: 10.1046/j.1460-9568.1999.00770.x. [DOI] [PubMed] [Google Scholar]
- Buonomano DV, Merzenich MM. Cortical plasticity: from synapses to maps. Annu Rev Neurosci. 1998;21:149–186. doi: 10.1146/annurev.neuro.21.1.149. [DOI] [PubMed] [Google Scholar]
- Caspary DM, Ling L, Turner JG, Hughes LF. Inhibitory neurotransmission, plasticity and aging in the mammalian central auditory system. J Exp Biol. 2008;211:1781–1791. doi: 10.1242/jeb.013581. [DOI] [PMC free article] [PubMed] [Google Scholar]
- Chang EF, Merzenich MM. Environmental noise retards auditory cortical development. Science. 2003;300:498–502. doi: 10.1126/science.1082163. [DOI] [PubMed] [Google Scholar]
- Chang EF, Bao S, Imaizumi K, Schreiner CE, Merzenich MM. Development of spectral and temporal response selectivity in the auditory cortex. Proc Natl Acad Sci U S A. 2005;102:16460–16465. doi: 10.1073/pnas.0508239102. [DOI] [PMC free article] [PubMed] [Google Scholar]
- Dahmen JC, King AJ. Learning to hear: plasticity of auditory cortical processing. Curr Opin Neurobiol. 2007;17:456–464. doi: 10.1016/j.conb.2007.07.004. [DOI] [PubMed] [Google Scholar]
- Daw MI, Scott HL, Isaac JT. Developmental synaptic plasticity at the thalamocortical input to barrel cortex: mechanisms and roles. Mol Cell Neurosci. 2007;34:493–502. doi: 10.1016/j.mcn.2007.01.001. [DOI] [PMC free article] [PubMed] [Google Scholar]
- de Villers-Sidani E, Chang EF, Bao S, Merzenich MM. Critical period window for spectral tuning defined in the primary auditory cortex (A1) in the rat. J Neurosci. 2007;27:180–189. doi: 10.1523/JNEUROSCI.3227-06.2007. [DOI] [PMC free article] [PubMed] [Google Scholar]
- de Villers-Sidani E, Alzghoul L, Zhou X, Simpson KL, Lin RC, Merzenich MM. Recovery of functional and structural age-related changes in the rat primary auditory cortex with operant training. Proc Natl Acad Sci U S A. 2010;107:13900–13905. doi: 10.1073/pnas.1007885107. [DOI] [PMC free article] [PubMed] [Google Scholar]
- Eggermont JJ. Neural interaction in cat primary auditory cortex. Dependence on recording depth, electrode separation, and age. J Neurophysiol. 1992;68:1216–1228. doi: 10.1152/jn.1992.68.4.1216. [DOI] [PubMed] [Google Scholar]
- Fagiolini M, Hensch TK. Inhibitory threshold for critical-period activation in primary visual cortex. Nature. 2000;404:183–186. doi: 10.1038/35004582. [DOI] [PubMed] [Google Scholar]
- Fagiolini M, Fritschy JM, Löw K, Möhler H, Rudolph U, Hensch TK. Specific GABAA circuits for visual cortical plasticity. Science. 2004;303:1681–1683. doi: 10.1126/science.1091032. [DOI] [PubMed] [Google Scholar]
- Gilbert CD, Li W, Piech V. Perceptual learning and adult cortical plasticity. J Physiol. 2009;587:2743–2751. doi: 10.1113/jphysiol.2009.171488. [DOI] [PMC free article] [PubMed] [Google Scholar]
- Goldberg JM, Brown PB. Response of binaural neurons of dog superior olivary complex to dichotic tonal stimuli: some physiological mechanisms of sound localization. J Neurophysiol. 1969;32:613–636. doi: 10.1152/jn.1969.32.4.613. [DOI] [PubMed] [Google Scholar]
- Harauzov A, Spolidoro M, DiCristo G, De Pasquale R, Cancedda L, Pizzorusso T, Viegi A, Berardi N, Maffei L. Reducing intracortical inhibition in the adult visual cortex promotes ocular dominance plasticity. J Neurosci. 2010;30:361–371. doi: 10.1523/JNEUROSCI.2233-09.2010. [DOI] [PMC free article] [PubMed] [Google Scholar]
- He HY, Hodos W, Quinlan EM. Visual deprivation reactivates rapid ocular dominance plasticity in adult visual cortex. J Neurosci. 2006;26:2951–2955. doi: 10.1523/JNEUROSCI.5554-05.2006. [DOI] [PMC free article] [PubMed] [Google Scholar]
- He HY, Ray B, Dennis K, Quinlan EM. Experience-dependent recovery of vision following chronic deprivation amblyopia. Nat Neurosci. 2007;10:1134–1136. doi: 10.1038/nn1965. [DOI] [PubMed] [Google Scholar]
- Hensch TK. Critical period regulation. Annu Rev Neurosci. 2004;27:549–579. doi: 10.1146/annurev.neuro.27.070203.144327. [DOI] [PubMed] [Google Scholar]
- Hensch TK. Critical period plasticity in local cortical circuits. Nat Rev Neurosci. 2005;6:877–888. doi: 10.1038/nrn1787. [DOI] [PubMed] [Google Scholar]
- Hensch TK, Fagiolini M. Excitatory-inhibitory balance and critical period plasticity in developing visual cortex. Prog Brain Res. 2005;147:115–124. doi: 10.1016/S0079-6123(04)47009-5. [DOI] [PubMed] [Google Scholar]
- Hollingsworth EB, McNeal ET, Burton JL, Williams RJ, Daly JW, Creveling CR. Biochemical characterization of a filtered synaptoneurosome preparation from guinea pig cerebral cortex: cyclic adenosine 3′,5′-monophosphate-generating systems, receptors, and enzymes. J Neurosci. 1985;5:2240–2253. doi: 10.1523/JNEUROSCI.05-08-02240.1985. [DOI] [PMC free article] [PubMed] [Google Scholar]
- Hsieh CY, Chen Y, Leslie FM, Metherate R. Postnatal development of NR2A and NR2B mRNA expression in rat auditory cortex and thalamus. J Assoc Res Otolaryngol. 2002;3:479–487. doi: 10.1007/s10162-002-2052-8. [DOI] [PMC free article] [PubMed] [Google Scholar]
- Huang ZJ, Kirkwood A, Pizzorusso T, Porciatti V, Morales B, Bear MF, Maffei L, Tonegawa S. BDNF regulates the maturation of inhibition and the critical period of plasticity in mouse visual cortex. Cell. 1999;98:739–755. doi: 10.1016/s0092-8674(00)81509-3. [DOI] [PubMed] [Google Scholar]
- Insanally MN, Köver H, Kim H, Bao S. Feature-dependent sensitive periods in the development of complex sound representation. J Neurosci. 2009;29:5456–5462. doi: 10.1523/JNEUROSCI.5311-08.2009. [DOI] [PMC free article] [PubMed] [Google Scholar]
- Joris PX, Schreiner CE, Rees A. Neural processing of amplitude-modulated sounds. Physiol Rev. 2004;84:541–577. doi: 10.1152/physrev.00029.2003. [DOI] [PubMed] [Google Scholar]
- Keuroghlian AS, Knudsen EI. Adaptive auditory plasticity in developing and adult animals. Prog Neurobiol. 2007;82:109–121. doi: 10.1016/j.pneurobio.2007.03.005. [DOI] [PubMed] [Google Scholar]
- Kilgard MP, Merzenich MM. Plasticity of temporal information processing in the primary auditory cortex. Nat Neurosci. 1998;1:727–731. doi: 10.1038/3729. [DOI] [PMC free article] [PubMed] [Google Scholar]
- Knudsen EI. Sensitive periods in the development of the brain and behavior. J Cogn Neurosci. 2004;16:1412–1425. doi: 10.1162/0898929042304796. [DOI] [PubMed] [Google Scholar]
- Lu T, Liang L, Wang X. Temporal and rate representations of time-varying signals in the auditory cortex of awake primates. Nat Neurosci. 2001;4:1131–1138. doi: 10.1038/nn737. [DOI] [PubMed] [Google Scholar]
- Maya Vetencourt JF, Sale A, Viegi A, Baroncelli L, De Pasquale R, O'Leary OF, Castrén E, Maffei L. The antidepressant fluoxetine restores plasticity in the adult visual cortex. Science. 2008;320:385–388. doi: 10.1126/science.1150516. [DOI] [PubMed] [Google Scholar]
- Morishita H, Hensch TK. Critical period revisited: impact on vision. Curr Opin Neurobiol. 2008;18:101–107. doi: 10.1016/j.conb.2008.05.009. [DOI] [PubMed] [Google Scholar]
- Mowery TM, Garraghty PE. Nerve-injury induced changes to GluR1 and GluR2/3 sub-unit expression in area 3b of adult squirrel monkeys: developmental recapitulation? Front Syst Neurosci. 2009;3:1. doi: 10.3389/neuro.06.001.2009. [DOI] [PMC free article] [PubMed] [Google Scholar]
- Noreña AJ, Gourévitch B, Aizawa N, Eggermont JJ. Spectrally enhanced acoustic environment disrupts frequency representation in cat auditory cortex. Nat Neurosci. 2006;9:932–939. doi: 10.1038/nn1720. [DOI] [PubMed] [Google Scholar]
- Okragly AJ, Haak-Frendscho M. An acid-treatment method for the enhanced detection of GDNF in biological samples. Exp Neurol. 1997;145:592–596. doi: 10.1006/exnr.1997.6500. [DOI] [PubMed] [Google Scholar]
- Pienkowski M, Eggermont JJ. Long-term, partially-reversible reorganization of frequency tuning in mature cat primary auditory cortex can be induced by passive exposure to moderate-level sounds. Hear Res. 2009;257:24–40. doi: 10.1016/j.heares.2009.07.011. [DOI] [PubMed] [Google Scholar]
- Pienkowski M, Eggermont JJ. Intermittent exposure with moderate-level sound impairs central auditory function of mature animals without concomitant hearing loss. Hear Res. 2010;261:30–35. doi: 10.1016/j.heares.2009.12.025. [DOI] [PubMed] [Google Scholar]
- Pizzorusso T, Medini P, Berardi N, Chierzi S, Fawcett JW, Maffei L. Reactivation of ocular dominance plasticity in the adult visual cortex. Science. 2002;298:1248–1251. doi: 10.1126/science.1072699. [DOI] [PubMed] [Google Scholar]
- Pizzorusso T, Medini P, Landi S, Baldini S, Berardi N, Maffei L. Structural and functional recovery from early monocular deprivation in adult rats. Proc Natl Acad Sci U S A. 2006;103:8517–8522. doi: 10.1073/pnas.0602657103. [DOI] [PMC free article] [PubMed] [Google Scholar]
- Polley DB, Steinberg EE, Merzenich MM. Perceptual learning directs auditory cortical map reorganization through top-down influences. J Neurosci. 2006;26:4970–4982. doi: 10.1523/JNEUROSCI.3771-05.2006. [DOI] [PMC free article] [PubMed] [Google Scholar]
- Polley DB, Read HL, Storace DA, Merzenich MM. Multiparametric auditory receptive field organization across five cortical fields in the albino rat. J Neurophysiol. 2007;97:3621–3638. doi: 10.1152/jn.01298.2006. [DOI] [PubMed] [Google Scholar]
- Putignano E, Lonetti G, Cancedda L, Ratto G, Costa M, Maffei L, Pizzorusso T. Developmental downregulation of histone posttranslational modifications regulates visual cortical plasticity. Neuron. 2007;53:747–759. doi: 10.1016/j.neuron.2007.02.007. [DOI] [PubMed] [Google Scholar]
- Sale A, Maya Vetencourt JF, Medini P, Cenni MC, Baroncelli L, De Pasquale R, Maffei L. Environmental enrichment in adulthood promotes amblyopia recovery through a reduction of intracortical inhibition. Nat Neurosci. 2007;10:679–681. doi: 10.1038/nn1899. [DOI] [PubMed] [Google Scholar]
- Sanes DH, Bao S. Tuning up the developing auditory CNS. Curr Opin Neurobiol. 2009;19:188–199. doi: 10.1016/j.conb.2009.05.014. [DOI] [PMC free article] [PubMed] [Google Scholar]
- Silingardi D, Scali M, Belluomini G, Pizzorusso T. Epigenetic treatments of adult rats promote recovery from visual acuity deficits induced by long-term monocular deprivation. Eur J Neurosci. 2010;31:2185–2192. doi: 10.1111/j.1460-9568.2010.07261.x. [DOI] [PubMed] [Google Scholar]
- Southwell DG, Froemke RC, Alvarez-Buylla A, Stryker MP, Gandhi SP. Cortical plasticity induced by inhibitory neuron transplantation. Science. 2010;327:1145–1148. doi: 10.1126/science.1183962. [DOI] [PMC free article] [PubMed] [Google Scholar]
- Sugiyama S, Di Nardo AA, Aizawa S, Matsuo I, Volovitch M, Prochiantz A, Hensch TK. Experience-dependent transfer of Otx2 homeoprotein into the visual cortex activates postnatal plasticity. Cell. 2008;134:508–520. doi: 10.1016/j.cell.2008.05.054. [DOI] [PubMed] [Google Scholar]
- Wang BS, Sarnaik R, Cang J. Critical period plasticity matches binocular orientation preference in the visual cortex. Neuron. 2010;65:246–256. doi: 10.1016/j.neuron.2010.01.002. [DOI] [PMC free article] [PubMed] [Google Scholar]
- Wang J, Caspary D, Salvi RJ. GABA-A antagonist causes dramatic expansion of tuning in primary auditory cortex. Neuroreport. 2000;11:1137–1140. doi: 10.1097/00001756-200004070-00045. [DOI] [PubMed] [Google Scholar]
- Wehr M, Zador AM. Balanced inhibition underlies tuning and sharpens spike timing in auditory cortex. Nature. 2003;426:442–446. doi: 10.1038/nature02116. [DOI] [PubMed] [Google Scholar]
- Weinberger NM. Dynamic regulation of receptive fields and maps in the adult sensory cortex. Annu Rev Neurosci. 1995;18:129–158. doi: 10.1146/annurev.ne.18.030195.001021. [DOI] [PMC free article] [PubMed] [Google Scholar]
- Wu GK, Arbuckle R, Liu BH, Tao HW, Zhang LI. Lateral sharpening of cortical frequency tuning by approximately balanced inhibition. Neuron. 2008;58:132–143. doi: 10.1016/j.neuron.2008.01.035. [DOI] [PMC free article] [PubMed] [Google Scholar]
- Zhang LI, Bao S, Merzenich MM. Persistent and specific influences of early acoustic environments on primary auditory cortex. Nat Neurosci. 2001;4:1123–1130. doi: 10.1038/nn745. [DOI] [PubMed] [Google Scholar]
- Zhou X, Merzenich MM. Enduring effects of early structured noise exposure on temporal modulation in the primary auditory cortex. Proc Natl Acad Sci U S A. 2008;105:4423–4428. doi: 10.1073/pnas.0800009105. [DOI] [PMC free article] [PubMed] [Google Scholar]
- Zhou X, Merzenich MM. Developmentally degraded cortical temporal processing restored by training. Nat Neurosci. 2009;12:26–28. doi: 10.1038/nn.2239. [DOI] [PMC free article] [PubMed] [Google Scholar]