Abstract
Individuals with a proximal urea cycle disorder, such as carbamoyl phosphate synthetase deficiency 1 or ornithine transcarbamylase deficiency, may present with encephalopathy resulting from hyperammonemia. The clinical presentation of arginase deficiency is considerably different, characterized by progressive spasticity involving the lower extremities and usually dementia. Diagnosis may be delayed, and patients are often thought to have cerebral palsy. The true etiology of brain injury in arginase deficiency is unknown, but is not thought to be due to hyperammonemia and brain swelling, the mechanism ofinjury recognized in ornithine transcarbamylase deficiency. Elevated arginine could augment nitric oxide synthesis, leading to oxidative damage. The hypothesis for the present study was that specific brain vulnerability in arginase deficiency would involve micro-structural alterations in corticospinal tracts and that this finding, as measured by diffusion tensor imaging, would differ from age-matched control subjects and those with ornithine transcarbamylase deficiency. Diffusion tensor imaging data were compared for a 17-year-old male patient with arginase deficiency, age-matched normal control subjects, and age-matched individuals with ornithine transcarbamylase deficiency. Significant differences were found in suspected areas of interest, specifically in the corticospinal tracts. This finding confirms the hypothesis that the mechanism of injury in arginase deficiency, although still unknown, is unlikely to be similar to that causing ornithine transcarbamylase deficiency.
Introduction
Urea cycle disorders are a family of inherited disorders of the pathway responsible for the detoxification of ammonia and its conversion to nontoxic urea. Six of the eight known urea cycle disorders are caused by enzyme deficiencies and the other two by mitochondrial transport protein defects. It is estimated that approximately 1:30,000 live births are affected by a urea cycle disorder [1].
The final step in the urea cycle, mediated by the enzyme arginase, catalyzes the hydrolysis of arginine into ornithine, which is returned into the mitochondria for continuation of the cycle, and into urea, which is transported to the kidneys to be excreted. Arginase deficiency, an autosomal recessive disorder, is one of the least common of all the urea cycle disorders, with incidence estimates between 1:350,000 and 1:1,000,000 [2]. The actual incidence, however, is unknown.
Arginase deficiency has a unique clinical presentation and is unlike the seven other urea cycle disorders (hyperammonemic encephalopathy), often manifesting as a spastic diplegia that may be indistinguishable from cerebral palsy [3]. To date, very few cases of arginase deficiency have been described for the neonatal period, even in cases with two nonsense mutations eliminating all enzyme activity [4,5]. Adult onset has rarely been recognized [6]. Two separate isozymes of arginase exist, encoded in two separate genes. Type I, a deficiency of which causes disease, is found in the liver cytoplasm and red blood cells primarily and contributes the vast majority of arginase activity, whereas type II is inducible and is found in the mitochondria of extrahepatic tissues, particularly the kidneys and brain [7].
Based on the clinical characteristics of individuals with arginase deficiency, one would expect to find changes in the white matter tracts, particularly the corticospinal tracts, compared with normal control subjects. In a recent study, diffusion tensor imaging of pyramidal tracts was used to make predictions regarding prognosis of motor dysfunction in infants. Specifically, it was found that children determined to have permanent motor dysfunction had lower fractional anisotropy and higher transverse diffusivity than children in whom the motor dysfunction returned to normal [8].
For the present study, based on the clinical findings associated with arginase deficiency (spasticity, clonus, hyperreflexia), the hypothesis was that there would be changes in the corticospinal tracts visualized by diffusion tensor imaging, compared with normal control subjects. A second hypothesis was that, because of the significantly different clinical presentations between patients with arginase deficiency and patients with other forms of urea cycle disorders (specifically, ornithine transcarbamylase deficiency), diffusion tensor imaging would reveal variability in these two patient populations as well.
To better understand the pathologic processes of urea cycle disorders and their effects on the brain, noninvasive neuroimaging techniques were used in a study conducted as part of the Urea Cycle Disorders Consortium within the Rare Diseases Clinical Research Network funded by the National Institutes of Health. All participants signed informed consent for participation in the study.
This particular report focuses on a subset of individuals from the larger study: one patient with arginase deficiency, age-matched normal control subjects, and subjects with ornithine transcarbamylase deficiency.
Case Report
The case subject was born full-term at normal weight, but was noted to have jaundice in the postnatal period and required 4-5 days of phototherapy. In addition, he did not breast feed well and also refused formula. He vomited frequently and exhibited poor growth. Early developmental milestones were nonetheless considered to be normal.
The subject was first diagnosed with arginase deficiency at the age of 4 years. Elevation of plasma arginine and the absence of arginase activity in red blood cells confirmed the diagnosis (data not shown). He was initially observed to have an increase in frequency of falling and a deterioration of motor skills. He developed significant spasticity, particularly of the lower extremities. He began having seizures around the age of 4 years, including both absence and generalized tonic-clonic seizures. He was treated with various antiepileptic medications, most recently carbamazepine. Since 2006, he has not required any antiepileptic drugs, and as of writing had remained seizure-free.
At the time of the imaging study in 2008, the subject (now 17 years of age), was able to participate in most normal physical activities, ambulating without the need of orthoses or assistive devices. On physical examination, he was found to have increased tone in the lower extremities, hyperreflexia of the lower extremities (3+/5), and lower extremity clonus, but no evidence of muscle atrophy in thighs or legs. His medications at the time of study included sodium benzoate, and he was on a protein-restricted diet with nutritional support (Cyclinex-2 and ProPhree; Abbott Nutrition, Columbus, OH).
Neuropsychologic testing from 2007 (when the patient was 16 years of age) indicated particular strengths in visual memory and verbal skills (especially for reading and expressive language), which were supported by his progress in regular school classes and straight A's on grade reports. His full-scale intelligence quotient, or IQ, was 102, with a verbal IQ of 105 and performance IQ of 99 (average = 100, S.D. = 15). As expected, however, he exhibited impairment in the grip strength test, which evaluates motor strength. He also performed relatively poorly on tasks that required unstructured, complex problem-solving tasks (tower of London) and organization (Rey-Osterreith figure).
Materials and Methods
Subjects
Seven age-matched normal control subjects (2 male, 5 female), with a mean age of 20.6 years (S.D. = 2.1; range, 18-23 years), were compared with the subject with arginase deficiency. All normal control subjects (n = 23), with a mean age of 33.8 years (S.D. = 12.9), were compared with subjects with ornithine transcarbamylase deficiency (n = 23), who had a mean age of 33.4 years (S.D. = 13.0).
Data Acquisition and Fractional Anisotropy Calculation
Diffusion tensor imaging data were acquired four times on a 3 T magnetic resonance imaging system (Magnetom Trio; Siemens, Erlangen, Germany) using gradient echo planar sequence with two diffusion-weighted gradients of b = 1000 s/mm2 applied in 30 orthogonal directions and b = 0 s/mm2 for five acquisitions, according to the International Consortium on Brain Mapping protocol. Each individual acquisition required 1 minute 30 seconds to collect using the following parameters: TR/TE = 6500/88 ms, a 90° flip angle, and 60 axial interleaved slices, with an effective resolution of 2.5-mm3 isotropic voxels.
Analyses of the diffusion tensor imaging data were limited to white matter regions estimated from a high-resolution T1-weighted acquisition consisting of three to four magnetization prepared rapid acquisition gradient echo, or MPRAGE, scans acquired during the same scanning session, each with a scan time of 6 minutes 51 seconds and the following parameters: TR/TE = 1600/4.38 ms, TI = 640 ms, 15° flip angle, 1 average, 160 sagittal slices with a 1.0-mm thickness, field of view = 256 × 256 mm2, matrix = 256 × 256, resulting in an effective resolution of 1.03-mm isotropic voxels. This high-resolution structural scan was also used to quantify the volume of various cortical structures.
From the raw data, the diffusion tensor was calculated using a singular value decomposition [9]. The fractional anisotropy, a measure of the degree of anisotropy, was calculated for each acquisition from the eigenvalues of the diffusion tensor, using software developed in-house.
Postprocessing and Statistical Analyses
Each of the four separate diffusion tensor imaging scans were registered to the first diffusion tensor imaging acquisition using the b = 0 images with a 6 degrees of freedom linear transformation. An average fractional anisotropy map was calculated after applying the transformations computed from the b = 0 images. The average b = 0 image was calculated and used to derive a second-order polynomial warp registration with the Talairach atlas using the International Consortium on Brain Mapping ICBM5 12 echo planar imaging template [10,11]. These transformations were applied to the individual fractional anisotropy maps, resulting in a single mean fractional anisotropy map in Talairach space for each subject. A 20.0-mm3 full-width, half-maximum Gaussian smoothing filter was applied to the spatially normalized fractional anisotropy map.
A random-effects analysis was performed using SPM5 software (http://www.fil.ion.ucl.ac.uk/spm) to identify areas in which the degree of anisotropy differs between the subject populations. A white-matter probability map was derived using the SPM5 segmentation algorithm for each individual subject. The average of the subjects’ white-matter maps was thresholded to derive the white-matter mask that was applied to the statistical results.
Quality Control
A rigorous quality control procedure was performed to remove individual slices and scans that exhibited artifacts arising from motion, eddy currents, or other factors. This procedure included rating each individual acquisition based on visual inspection of the raw diffusion-weighted images, the corresponding fractional anisotropy map, and the goodness of the registration to the first b = 0 image. Any acquisition with more than two slices containing artifacts was eliminated from the calculation of the mean fractional anisotropy map. Each step of the quality control procedure included a rating scale that was summed to derive an overall quality control rating for each subject. The summary quality control rating was assessed to determine whether there were any differences in the overall quality of the diffusion tensor imaging data between the populations of subjects.
Tractography
Fiber tractography was performed to identify the tracts found in the statistical analysis using DtiStudio version 2.4 (http://cmrm.med.jhmi.edu) [12]. The fibers were limited to areas that passed through regions identified from the statistical comparison of the fractional anisotropy maps. Tracking was initiated at voxels with a fractional anisotropy value >0.4 and terminated either when a voxel was reached with an fractional anisotropy value <0.4 or when the angle of two consecutive eigenvectors was >70°. Identification of regions with tractography differences was performed using both the planar views of the statistical maps overlaid on each subject's average b = 0 image and the tracts that were generated using the tractography software. Both the Talairach atlas and an atlas of white matter were used to identify the tracts involved with significant differences in fractional anisotropy [10,12].
Results
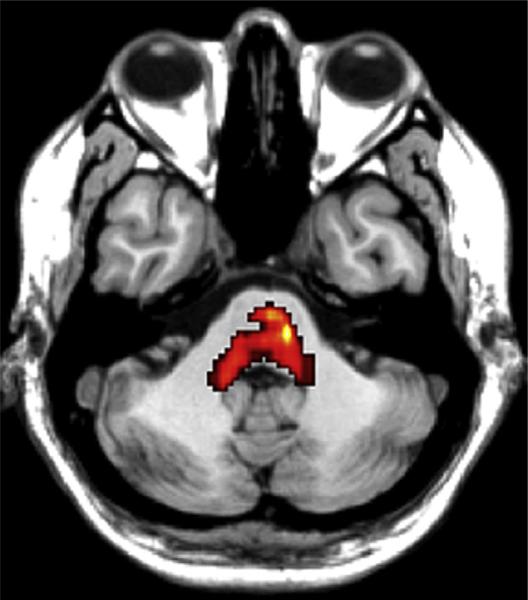
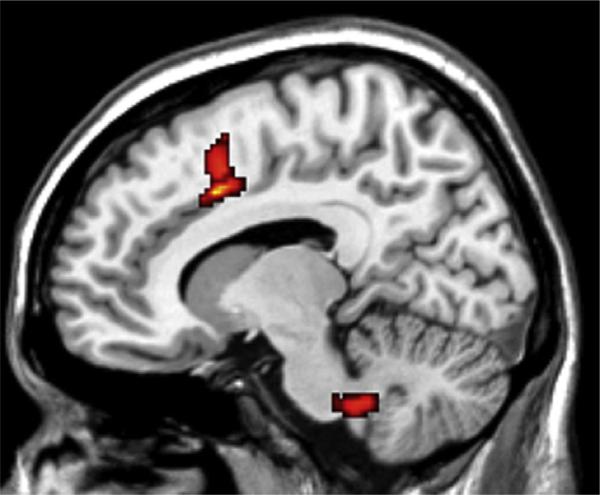
Compared with the normal control subjects, in the arginase deficiency patient two regions exhibited an alteration in white matter integrity and microstructural damage, as evidenced by decreased fractional anisotropy: one was an area within the central pons, extending into the cerebellum, at or near the level of decussation of the corticospinal tracts (P = 0.000) (Fig 1), and the other was an area adjacent to the corpus callosum (P = 0.003) (Fig 2). In contrast, preliminary analysis of research currently in progress suggests that subjects with ornithine transcarbamylase deficiency have decreased fractional anisotropy in the anterior cingulate white matter (unpublished data).
Figure 1.
Significant differences in fractional anisotropy between the patient with arginase deficiency and normal control subjects are indicated in color, in the pons (T1-weighted magnetic resonance image; axial view; TR/TE = 6500/88 ms), based on SPM5 statistical parametric mapping analysis.
Figure 2.
Significant differences in fractional anisotropy between the present patient with arginase deficiency and normal control subjects are indicated in color, adjacent to the corpus callosum (T1-weighted magnetic resonance image; axial view; TR/TE = 6500/88 ms), based on SPM5 statistical parametric mapping analysis.
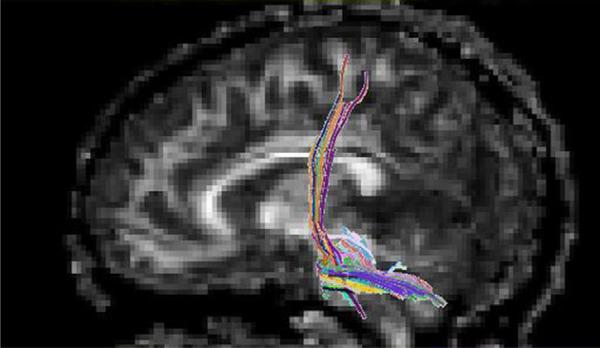
Various fiber tracts were analyzed for the diffusion tensor imaging fiber count. The most significant region of interest (level of decussation of the corticospinal tracts) was used to generate fiber tracking (Fig 3). Group statistical analysis performed using a cluster-based analysis (SPM5) identified significant reduction in diffusion tensor imaging fiber count, compared with control subjects and also compared with subjects with ornithine transcarbamylase deficiency.
Figure 3.
White matter tractography for the patient with arginase deficiency through the region of interest in the pons (sagittal view; TR/ TE = 6500/88 ms). Colors indicate the dominant direction of the fibers.
Discussion
The patient discussed here presented with typical features of arginase deficiency [5]. The most conspicuous feature is spastic paraparesis or paraplegia with lesser involvement of the upper extremities. Unlike the more proximal urea cycle defects, the mechanism of brain injury is not likely to involve elevated plasma ammonia, because symptomatic hyperammonemia rarely occurs in this condition.
The neurologic manifestations seen in arginase deficiency could arise from the accumulation of arginine and its metabolites. Arginine is a precursor of nitric oxide, which functions variously as an endothelial derived relaxing factor, a signal transduction molecule, a mediator of immune response, and a neurotransmitter [13]. Elevated levels of arginine may cause greater synthesis of nitric oxide, leading to oxidative damage via reduction of energy metabolism.
Alternatively, or perhaps in addition, the clinical features of arginase deficiency may result from hyperargininemia, a state in which several guanidino compounds increase. These compounds act as neurotoxins, both in vitro and in vivo. Guanidine compounds inhibit the activity of transketolase and they may produce demyelination with consequent upper motor neuron signs. Accumulation of guanidine compounds may affect γ-aminobutyric acidergic neurotransmission, resulting in excitotoxicity and epileptogenic risk [14].
The present findings demonstrate the utility of diffusion tensor imaging in characterizing injury in specific white matter tracts. This methodology provides a measure not possible with conventional magnetic resonance imaging. Although qualitative evaluation of images involves a high degree of subjectivity, it reflects a limitation of currently available technology, and one encountered by multiple investigators. Nonetheless, one of the definite advantages of diffusion tensor imaging is the ability to measure tract diameters and tract-specific diffusion tensor imaging parameters quantitatively (an analysis that is planned for a complement to the present study). Using an increased number of subjects and acquiring additional control data, diffusion tensor imaging will likely advance our understanding of brain injury in children and adults with urea cycle disorders, including arginase deficiency.
Acknowledgments
A.L.G. is supported by a National Institutes of Health (NIH) National Center for Research Resources (NCRR) career development award K12RR17613. Parts of the study were also supported by NCRR grants U54RR019453 and 1M01RR020359. The authors thank the subjects for their dedication to and participation in this study and Ms. Cindy LeMons, AA, of the National Urea Cycle Disorders Foundation for her ongoing enthusiasm. The authors also thank Rebecca R. Seltzer, BA, and Dr. Bennett Gertz, MD, for technical assistance and Dr. Eric Crombez, MD, for his role in care of the patient.
References
- 1.Brusilow SW, Maestri NE. Urea cycle disorders: diagnosis, pathophysiology, and therapy. Adv Pediatr. 1996;43:127–70. [PubMed] [Google Scholar]
- 2.Applegarth DA, Toone JR, Lowry RB. Incidence of inborn errors of metabolism in British Columbia, 1969-1996. Pediatrics. 2000;105:e10. doi: 10.1542/peds.105.1.e10. [DOI] [PubMed] [Google Scholar]
- 3.Prasad AN, Breen JC, Ampola MG, Rosman NP. Argininemia: a treatable genetic cause of progressive spastic diplegia simulating cerebral palsy: case reports and literature review. J Child Neurol. 1997;12:301–9. doi: 10.1177/088307389701200502. [DOI] [PubMed] [Google Scholar]
- 4.Crombez EA, Cederbaum SD. Hyperargininemia due to liver arginase deficiency. Mol Genet Metab. 2005;84:243–51. doi: 10.1016/j.ymgme.2004.11.004. [DOI] [PubMed] [Google Scholar]
- 5.Cederbaum SD, Shaw KN, Spector EB, Verity MA, Snodgrass PJ, Sugarman GI. Hyperargininemia with arginase deficiency. Pediatr Res. 1979;13:827–33. doi: 10.1203/00006450-197907000-00007. [DOI] [PubMed] [Google Scholar]
- 6.Cowley DM, Bowling FG, McGill JJ, van Dongen J, Morris D. Adult-onset arginase deficiency. J Inherit Metab Dis. 1998;21:677–8. doi: 10.1023/a:1005492819527. [DOI] [PubMed] [Google Scholar]
- 7.Cederbaum SD, Yu H, Grody WW, Kern RM, Yoo P, Iyer RK. Arginases I and II: do their functions overlap? Mol Genet Metab. 2004;81((Suppl). 1):S38–S44. doi: 10.1016/j.ymgme.2003.10.012. [DOI] [PubMed] [Google Scholar]
- 8.Ludeman NA, Berman JI, Wu YW, et al. Diffusion tensor imaging of the pyramidal tracts in infants with motor dysfunction. Neurology. 2008;71:1676–82. doi: 10.1212/01.wnl.0000304084.59964.e2. [DOI] [PubMed] [Google Scholar]
- 9.Basser PJ, Mattiello J, LeBihan D. MR diffusion tensor spectroscopy and imaging. Biophys J. 1994;66:259–67. doi: 10.1016/S0006-3495(94)80775-1. [DOI] [PMC free article] [PubMed] [Google Scholar]
- 10.Talairach J, Tournoux P. In: Co-planar stereotaxic atlas of the human brain: 3-dimensional proportional system: an approach to cerebral imaging. Rayport M, editor. Thieme Medical Publishers; New York: 1988. [Google Scholar]
- 11.Woods RP, Grafton ST, Holmes CJ, Cherry SR, Mazziotta JC. Automated image registration: I. General methods and intrasubject, intra-modality validation. J Comput Assist Tomogr. 1998;22:139–52. doi: 10.1097/00004728-199801000-00027. [DOI] [PubMed] [Google Scholar]
- 12.Mori S, Kaufmann WE, Pearlson GD, et al. In vivo visualization of human neural pathways by magnetic resonance imaging. Ann Neurol. 2000;47:412–4. [PubMed] [Google Scholar]
- 13.Scaglia F, Lee B. Clinical, biochemical, and molecular spectrum of hyperargininemia due to arginase I deficiency. Am J Med Genet C Semin Med Genet. 2006;142C:113–20. doi: 10.1002/ajmg.c.30091. [DOI] [PMC free article] [PubMed] [Google Scholar]
- 14.Deignan JL, Marescau B, Livesay JC, et al. Increased plasma and tissue guanidino compounds in a mouse model of hyperargininemia. Mol Genet Metab. 2008;93:172–8. doi: 10.1016/j.ymgme.2007.09.016. [DOI] [PubMed] [Google Scholar]


