Abstract
Background
Regeneration of the lost periodontium is the ultimate goal of periodontal therapy. Advances in tissue engineering have demonstrated the multilineage potential and plasticity of adult stem cells located in the periodontal apparatus. However, it remains unclear how epigenetic mechanisms controlling signals determine tissue specification and cell lineage decisions. To date, no data is available on micro-RNAs (miRNAs) activity behind human-derived dental stem cells.
Methods
In this study, we isolated periodontal ligament stem cells (PDLSCs), dental pulp stem cells (DPSCs), and gingival stem cells (GSCs) from extracted third molars; human bone marrow stem cells (BMSCs) were used as a positive control. The expression of OCT4A and NANOG was confirmed in these undifferentiated cells. All cells were cultured under osteogenic inductive conditions and RUNX2 expression was analyzed as a marker of mineralized tissue differentiation. A miRNA expression profile was obtained at baseline and after osteogenic induction in all cell types.
Results
RUNX2 expression demonstrated the successful osteogenic induction of all cell types, which was confirmed by alizarin red stain. The analysis of 765 miRNAs demonstrated a shift in miRNA expression occurred in all four stem cell types, including a decrease in hsa-mir-218 across all differentiated cell populations. Hsa-mir-218 targets RUNX2 and decreases RUNX2 expression in undifferentiated human dental stem cells (DSCs). DSC mineralized tissue type differentiation is associated with a decrease in hsa-mir-218 expression.
Conclusions
These data reveal a miRNA regulated pathway for the differentiation of human DSCs and a select network of human microRNAs that control DSC osteogenic differentiation.
Keywords: stem cells, osteogenesis, cell differentiation, RUNX2, RNA induced silencing complex, messenger RNA
INTRODUCTION
The discovery of dental derived adult stem cells (DSC) in the periodontal ligament (PDLSC), dental pulp (DPSC) and attached gingiva (GSC), represent an alternative site for cell harvesting that is less invasive compared to bone marrow stem cells (BMSC) and yet, possess similar properties (1-8).
Studies have identified numerous transcription factors that influence the differentiation status of stem cells. Research has demonstrated that the amount of OCT4 must be tightly regulated in order to maintain a stem cell phenotype (9). Similarly, NANOG was demonstrated to be another transcription factor that plays a crucial role in maintaining the undifferentiated status of stem cells (10). Furthermore, NANOG acts in parallel with cytokine stimulation of Stat3 to drive embryonic stem cell self-renewal (11). RUNX2 (runt-related transcription factor 2), on the other hand, is a transcription factor shown to be essential for osteoblastic differentiation and skeletal morphogenesis. Studies have demonstrated that osteoblastic differentiation is associated primarily with increases in RUNX2/CBFA1 activity in bone marrow stromal cells (12, 13).
MicroRNAs (miRNAs) are a class of post-transcriptional regulators that bind to complementary sequences in the 3′ UTR of target mRNAs. miRNAs bind approximately to 60% of all genes, are abundantly present in human cells and each miRNA is capable of repressing multiple targets (14-16). Several murine miRNAs have been discovered that regulate osteogenesis; miRNA-26a and miRNA-125b negatively regulate osteoblast differentiation (17,18), while miRNA-29b, and miRNA-210 positively regulate osteogenesis (18,20). Recently several new miRNA regulatory pathways were identified including a Runx2/miRNA-3960/miRNA-2861 regulatory feedback loop (21) and a Runx2 transcriptional control of miRNA-23a-27a-24-2 cluster involving SATB2 (22) was identified for the regulation of mouse osteoblast differentiation. It also has been demonstrated that RUNX2 is targeted by specific miRNAs in human bone marrow stem cells (23) and murine osteoblast differentiation programs (24-26).
We have identified a unique relationship between human miRNAs expressed in undifferentiated DSCs and differentiation of these cells towards a mineralized tissue. These results were compared to a well-characterized model, BMSC. We describe a defined set of human miRNAs involved in this process and demonstrated that human RUNX2 expression correlated with decreased miRNA-218 in differentiated human DSCs.
MATERIALS and METHODS
Cell isolation, FACS Sorting and Culture
Fifty disease-free third molars were collected after elective surgeries performed at the Oral and Maxillofacial Surgery clinic at the UTHSC Dental School. Patients with good overall health and no periodontal disease were asked to donate their teeth under IRB consent. Teeth were kept in DMEM with 10% FBS and 1% Pen-strep at 37°C until a total of 50 teeth were obtained (3 days). The periodontal ligament was scraped, gingival and dental pulp tissues were kept separated and digested in a solution of 3 mg/ml collagenase type I (Worthington Biochem, Freehold NJ) and 4 mg/ml of dispase (Worthington Biochem, Freehold NJ). Primary cells from donors were pooled together at the same passage in order to obtain a primary cell type either periodontal ligament, dental pulp or gingival cells used for FACS sortings and expanded for additional experiments. We had one batch of each particular cell type which was combined from all donors. The experiments were performed in triplicate at 3 different times using the same batch of cells. Collected tissues were treated separately according to their anatomical location and enzymatically digested. PDL, GING, and DP cells from different individuals were pooled together for analyses(1). Primary human bone marrow stem cells (BMSC) were obtained from Dr. Jim Dennis at Case Western Reserve University (OH) to serve as a positive control.
Immunohistochemistry
To elucidate the presence of STRO-1 positive cells in the heterogeneous cell population, BMSC, PDL, GING, and DP cells were seeded separately at 5×10³ cells per well on a 4 chambered slide. Cells were fixed with 4% formaldehyde. Cells were blocked with 10% Normal Goat Serum (Invitrogen, CA) for 30 m. and washed. Mouse anti-STRO-1 monoclonal IgM primary antibody (Invitrogen, CA) which is a cell surface marker for stem cells was diluted at 1:25, 1:50, and 1:100 and incubated overnight at 4°C. Cells were washed 3 times with PBS and incubated with goat anti-mouse IgM-FITC secondary antibody at 1:50 Alexa Fluor 488 (AF488, Invitrogen, CA) at room temperature for 2 h. Cells were counter stained with phalloidin red, DAPI, mounted with Prolong Gold (Invitrogen, CA). Microscopic images were recorded at 40× magnification using a Nikon fluorescent microscope (Eclipse 80i) fitted with a Nikon DS-Qi1 Digital camera, using the DAPI/Texas Red/FITC excitation/emission filter sets to ascertain the presence of stem cells in the heterogeneous population of the PDL, GING and DP.
Fluorescence-Activated Cell Sorting (FACS)
Between 1.1 – 2.3 × 10⁶ cells per sample of each cell type were used. The sample was labeled using a mixture of 100μL of primary antibody (STRO-1 antibody, Invitrogen, CA), 50μL normal goat serum (Invitrogen, CA), and 350μL FACS wash buffer (3% FBS and 0.25M EDTA in PBS). Cells were then washed 3 times with 10mL of FACS wash buffer and labeled using 5μL secondary antibody (Alexa Fluor 488, Invitrogen, CA) and sorted. The negative control lacked primary antibody, was stored on ice for 30 m. in 3μL secondary antibody (Alexa Fluor 488). The second negative control consisted of 2.94 × 10⁵ cells stored in 300μL of FACS wash buffer only, and sorted (1).
Isolation of STRO-1 positive cells was performed on a fluorescence-activated cell sorter (FACS) AriaII from BD Biosciences. STRO-1-AF488 was excited using a 488nm laser and detected with a 520LP and 530/30BP filter set. Data was analyzed using BD FACS DIVA software at the Flow Cytometry and Cellular Imaging Core Facility, MD Anderson Cancer Center (Houston, TX). Enriched STRO-1 DPSC, GSC, and PDLSC were obtained, cultured, and expanded as separate cell types. Other stem cell makers tested to confirm the undifferentiated status of our GSC, PDLSC and DPSC cells included CD 105, Integrin ß1(CD 29), Stage-specific embryonic antigen-4 (SSEA4) and OCT4 (ab 44967, ab 30394, ab16287 and ab27985 respectively; Abcam, Boston MA. 1:25, 1:25, 1:10 and 1:50 dilution). As a negative control, a mouse IgG1 isotype monoclonal antibody (ab27479 Abcam, Boston, MA.) was used. Cells were sorted at 2nd passage and expanded for 2 additional passages before plated for the experiments unless specified. All the experiments were performed in triplicates in three different experiments using the same batch of tissues from all combined donors.
Total RNA Isolation
BMSCs, PDLSCs, GSCs, and DPSCs were plated separately at 5 × 10³ cells per well, on a 6 well plate and incubated for 7, 14, 21, and 28 days. RNA isolation was performed using the mirVana miRNA isolation kit (Applied Biosystems, CA). Adherent cells were trypsinized and pelleted, then washed and resuspended in PBS. The samples were then disrupted with the mirVana Lysis/Binding Solution and vortexed to lyse them and expose the total RNA. The RNA was organically extracted, then eluted and stored in nuclease-free water.
qRT-PCR Analysis to Confirm Undifferentiated Status
To verify gene expression for the early tissue specific markers OCT4 and NANOG, first-strand cDNA was produced from 500ng of total RNA extracted from PDLSC, DPSC, GSC, and BMSC using the QuantiTect Reverse Transcriptase kit (Qiagen, Valencia, CA) according to manufacturer’s instructions. Amplification reactions were analyzed in real-time on a BioRad Icycler (MyiQ Optical Module) using Power SYBR Green (Applied Biosystems, CA) chemistry and the threshold values calculated using MyiQ software (version 1.0.410). Thermal cycling parameters were as follows: 95°C – 10 min followed by 40 cycles of 95°C – 30 sec, 60°C – 30 sec, 72°C – 30 sec. After data collection, the following dissociation parameters were used: 95°C – 30 sec, 60°C – 30 sec, 95°C – 30 sec and then held at 4°C. Real Time PCR primers were designed using the following accession numbers GAPDH (NM_002046; forward primer GAGTCAACGGATTTGGTCGT, reverse primer GACAAGCTTCCCGTTCTGAG, 185bp product) OCT4A (NM_002701; forward primer GGCTCGAGAAGGATGTGGTCCG, reverse primer ACGGAGACAGGGGGAAAGGCT, 247bp product), NANOG (NM_024865, forward primer AGGAAGACAAGGTCCCGGTCAAGAA, reverse primer GAGGCCTTCTGCGTCACACCAT, 250bp product).
Immunohistochemistry of OCT4
To elucidate the presence of OCT4 at the cell nuclei and avoid potential confounding with an OCT4 pseudogene, PDLSC, DPSC and GSC were permeabilized with 0.2% NP-40 (Sigma-Aldrich, St Louis, MO) in PBS for 10 min, wash, blocked and analyzed by immunohistochemistry using a polyclonal anti-OCT4 antibody (ab 27985, 1:25 dilution, Abcam Boston, MA.) As a negative control, a mouse IgG1isotype monoclonal antibody (ab27479 Abcam, Boston, MA.) was used.
Differentiation towards Mineralized Tissue
BMSC, PDLSC, GSC, and DPSC were plated at 5 × 10³ per well on a 6 well plate to examine osteogenic differentiation as defined by an increase on RUNX2 expression. Twelve hours after the initial seeding, tissue culture media was replaced with osteogenesis differentiation medium containing Dulbecco DMEM-LG with 10% FBS-Pen/Strep, 10-7M dexamethasone, 50μM ascorbic acid-2 phosphate and 2mM β-glycerophosphate (Invitrogen, CA). Control cells were grown in DMEM-LG with 10% FBS-Pen/Strep only. cDNA was obtained and cells were screened for an increase in RUNX2 expression with qRT-PCR using the parameters described above at days 7, 14, 21, and 28 (NM_001024630, forward primer GAACTGGGCCCTTTTTCAGA, reverse primer GCGGAAGCATTCTGGAAGGA, 319bp product). Confirmation of mineralization was accomplished using alizarin red stain. Cells were washed in PBS, fixed for 5 m. in −20° C methanol, and air dried. Cells were rehydrated in PBS for 2 min., alizarin red solution was added for 1 min. and washed.
microRNA Profile
miRNA analyses were performed at day 0 (baseline) for all cell types and again when RUNX2 expression presented the highest peak in expression reported by our qRT-PCR data. In BMSC maximum RUNX2 expression was at day 14, while DPSC and GSC peaked at day 21 and PDLSC peaked at day 28. The results between the undifferentiated cell types and their differentiated counterparts were compared. Total RNA quality in our PDLSC, GSC, and DPSC and BMS was measured on an Agilent Technologies (Santa Clara, CA) 2100 nano-chip to ascertain RNA quality (RIN ≥ 8.0) and that a miRNA peak was evident. RNA quantity was determined using a Nanodrop ND-1000 spectrophotometer (Thermo Scientific, Wilmington, DE). RNA samples were diluted to 5.5ng/μL in nuclease-free H2O prior to use.
cDNA and qPCR Protocols
Two Exiqon (Copenhagen, Denmark) human miRNA panel plates (panel I & II, V2.R) per sample were made on our undifferentiated and differentiated PDLSC, GSC, DPSC, and BMSC. Results were analyzed following the version 3.1 protocol. Briefly, two 20μL cDNA reactions were made for each sample consisting of 16μL of RT master mix with spike-in control and 4μL of diluted RNA. The reverse transcription reactions were run in an ABI 2720 thermocycler (Foster City, CA) as follows: 42°C-60 min, 95°C-5 min. The two 20 μL cDNA reactions were added to 4.36 ml of nuclease-free H2O and mixed followed by an equal volume of 2× SYBR Green PCR master mix (8.8 ml final). 10μL of complete 1× PCR master mix were added to each well of both 384-well miRNA panel I and II plates utilizing a Beckman Biomek2000 robot (Brea, CA). The plates were run in a Roche LC480 Lightcycler as follows: 95°C- 10 min followed by 45 cycles of 95°C-10 sec and 60°C-1 min with a ramp rate of 1.6°/sec. Samples were ran in triplicates.
Data Analysis
Cq values were determined using the second derivative method in the LC480 software using the absolute quantification setting. Using the Exiqon module for GenEx analysis software (MultiD), the plate layout for each panel was imported into the appropriate LC480 run file and the analyzed and annotated data exported. The exported data was analyzed utilizing GenEx software (ver. 5.7.2.44, Multi-D Analyses AB, Göteborg, Sweden) to determine the fold difference in the treated sample compared to the cognate control. Changes in miRNA expression were considered significant if they were expressed in less than 30 cycles and showed a fold increase or decrease of 3 or greater.
Potential Target Genes and Disease Associations
Once the miRNA profiles were ascertained, potential gene targets were assessed using the online software at three different programs (PicTar, TargetScan, mirBase) were used to predict possible targets of microRNAs. In addition, a survey was done using PubMed (accessed at http://www.ncbi.nlm.nih.gov/pubmed/) to determine whether these miRNAs had correlations in other areas of study.
Screening Result Validation for miRNA-218
Triplicate 10 μl RT reactions were run using 5.5ng/μL diluted RNA samples as described above for the validation of each sample. The cDNAs were then diluted 80-fold. SYBR Green based-qPCR master mix was combined with assay-specific primer pairs for miRNA-218. We then added 6μL of assay-specific qPCR master mix per well of an LC480 384-well white plate followed by 4μL of diluted cDNA for each sample such that for each sample one qPCR was made. This makes a complete RT-qPCR triplicate for each sample against each assay. The plate was run in the LC480 qPCR instrument using the cycling conditions described above. Data analysis was the same as was used for the microarrays.
qRT-PCR Analysis to confirm RUNX2 down-regulation
To verify the decrease in RUNX2 expression, as a product of miRNA-218 decrease, qRT-PCR was performed in all cell types as mentioned above and results were adjusted against BMSC as a positive control.
Cell culture, transient transfections, luciferase and β-galactosidase assays
PDLSC, GSC, and DPSC were cultured in DMEM supplemented with 5% or 10% FBS and penicillin/streptomycin and transfected by electroporation. The method of transient transfections, luciferase and β-galactosidase assays were described previously (25). Transfected cells were incubated for 48h. The pcDNA3.1 empty vector or pSilencer 4.1 negative control vectors were added to equalize the total amount of co-transfected expression vectors as done previously (25,26).
Expression and reporter constructs
The expression plasmid containing the cytomegalovirus (CMV) promoter linked to the mmu-miR-218 was constructed in pSilencer 4.1 (Ambion). Runx2 3′UTR and Runx2 mutant 3′UTR generated by mutagenesis were directionally cloned into the pGL3 CXCR4 1P (Addgene, plasmid 11310), (25) replacing the siRNA binding site by XbaI and ApaI. All constructs were confirmed by DNA sequencing.
Western Blot
PDLSC, GSC, and DPSC cells were harvested and lysates were analyzed for endogenous Runx2 and beta-tubulin expression. Approximately 20 μg of lysate was resolved on 10% SDS denaturing gels. Following SDS gel electrophoresis, the proteins were transferred to PVDF filters (Millipore), immunoblotted with Runx2 antibody (1:500, Abcam, ab76956), or β-tubulin antibody (1:500, Santa Cruz, sc-9104) and detected using ECL plus reagents from GE Healthcare.
RESULTS
Labeling of dental derived stem cells and FACS
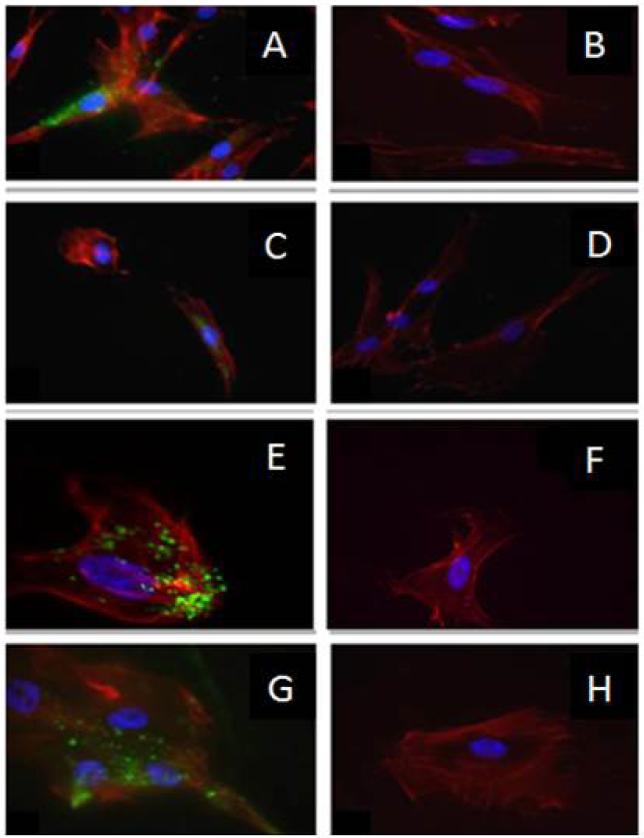
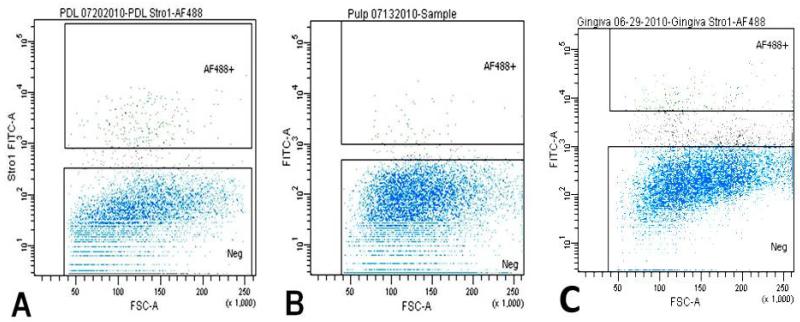
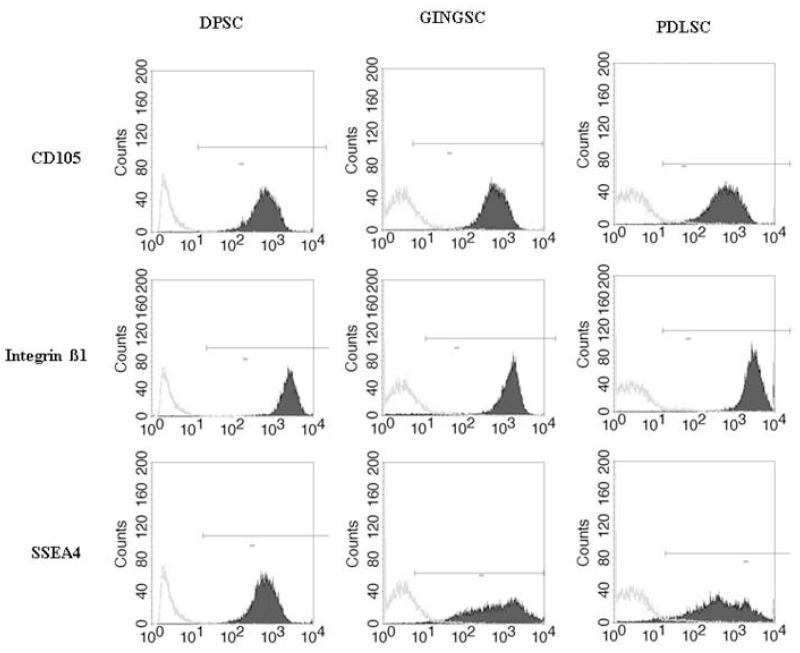
In order to obtain dental stem cell-enriched populations, we first collected heterogeneous DP, GING, and PDL populations from extracted third molars and labeled them separately with STRO-1 antibody. This antibody is a monoclonal mouse anti-human antibody IgM, which targets undifferentiated cell populations. Successful labeling was confirmed with confocal microscopy, which demonstrated fluorescence of the STRO-1 in some positive cells while differentiated cells showed no fluorescence. Our controls, lacking the primary antibody, were used in order to demonstrate the lack of unspecific binding (Fig. 1). Isolation of these cells by Fluorescence-Activated Cell Sorting (FACS) yielded samples of the labeled stem cells. The percentages of STRO-1 positive cells (AF488+, green) were 2.1% in the PDL, 1.6% in the GT, and 0.6% in the DP cell populations (Fig. 2). Other well characterized stem cell markers such as CD 105, Integrin ß1 and SSEA4 confirmed our results (Fig. 3) (27, -30).
Fig. 1.
STRO-1 labeling of DSC for cell sorting- (A, C, E, and G) left panels represent images from PDLSC, DPSC, GSC, and BMSC, respectively, using STRO-1 antibody (green), phalloidin red (cytoskeleton) and DAPI (blue, nuclei). (B, D, F, and H) right panels show the negative control of the same cell type lacking the primary antibody. (20×). BMSC are utilized as a positive control.
Fig. 2.
Fluorescence activated cell sorting plots-A, B, and C represent sortings of PDLSC, DPSC, and GSC. Viable cells in blue color; black color depicting damaged cells rejected during the sorting; and in green, strongly STRO-1 positive cells, represented 2.1%, 0.6%., 1.6%, respectively for PDLSC, DPSC, and GSC.
Fig. 3.
Fluorescence activated cell sorting histograms-Third passage STRO-1 positive cells were analyzed by FACS after staining with FITC (solid black) or control isotype IgG (grey). The stem cell antibody makers used were CD 105, Integrin ß1 and SSEA4. Results are representative of 3 different experiments.
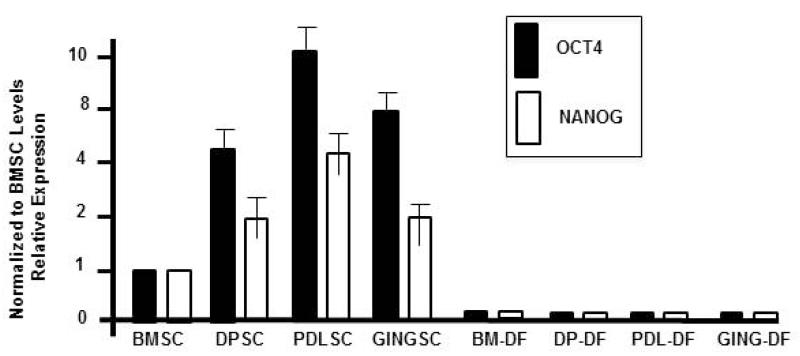
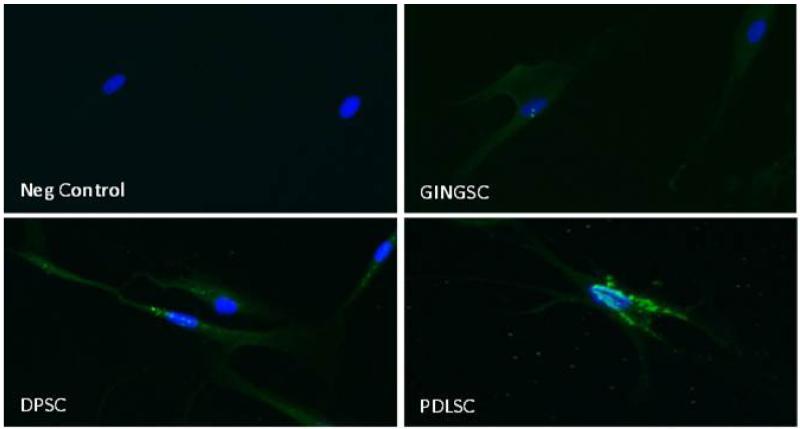
To determine if these cell populations were undifferentiated and had “stemness” properties we screened for the expression of stem cell associated factors. Quantitative real-time PCR demonstrated that OCT4 and NANOG were expressed in all three dental stem cells (DSC) types. The real time PCR results of dental pulp stem cells (DPSC), periodontal ligament stem cells (PDLSC) and gingival stem cells (GSC) were normalized to GAPDH and compared against bone marrow stem cells (BMSC) our positive control (Fig. 4). To avoid a potential contamination in our qRT-PCR results by an OCT4 pseudogene (31), we confirmed its nuclear presence with an immunofluorescence approach (Fig. 5).
Fig. 4.
qRT-PCR results of OCT4 and NANOG expression-OCT4 and NANOG levels in DPSC, PDLSC, and GINGSC populations are shown relative to BMSC levels. RNA was harvested from isolated dental stem cells or after 21 days in osteogenesis differentiation medium (DF, Differentiated cells). All data was normalized to GAPDH to account for RNA concentration differences in the samples.
Fig.5.
Immunohistochemistry for OCT4 localization in DSC-Third passage GSC, PDLSC and DPSC were grown in 4 well chamber slides, permeabilized and stained with a mouse anti-human OCT4 antibody (1:50 dilution). Negative control: mouse IgG isotype. Secondary antibody goat anti-mouse FITC. DAPI was used in the mounting solution. Positive immunolocalization (green) was seen at the perinuclear area (blue). 20× magnification.
Mineralized tissue differentiation of PDLSC, GSC, DPSC, and BMSC
The isolated DSC were induced towards a mineralized tissue. Cells were incubated with osteogenesis differentiation medium or normal culture media as described above and assayed for gene expression. To evaluate a genotypic shift towards a differentiated and mineralizing tissue type, quantitative real-time PCR was carried out at days 7, 14, 21, and 28 in order to evaluate gene expression markers for undifferentiation and differentiation. All cells after incubation in differentiation medium (BM-DF, DP-DF, PDL-DF, and GING-DF) revealed undetectable levels of OCT4 and NANOG expression (Fig. 4). These cells incubated in the osteogenic inductive medium have lost their stem cell properties.
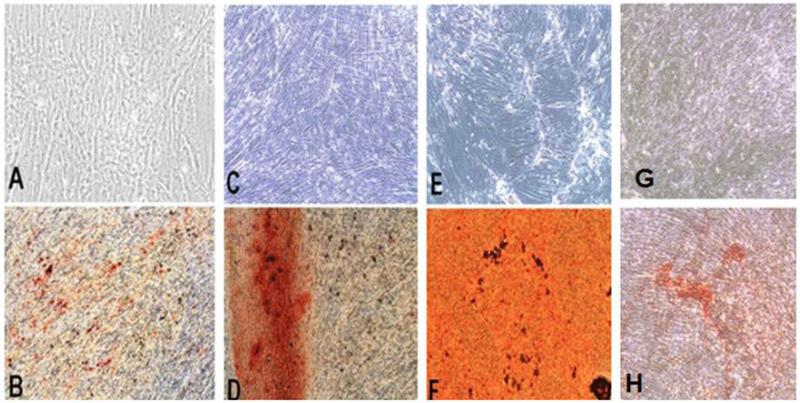
To evaluate DSC differentiation to a mineralized tissue as expressed by calcium deposits, osteogenically induced cultures were stained at day 28 after induction under osteogenic media or control. DSC were washed with PBS, fixed with methanol and stained with an aqueous 2% alizarin red solution (Sigma Aldrich) for 2 min. following standardized protocols, washed with tap water until solution was removed and dehydrated with increasing concentrations of ethanol. Samples were air dried. All three test samples performed in triplicate showed staining throughout. Control samples, not osteogenically induced, were negative (Fig. 6).
Fig. 6.
Mineralization of differentiated DSC-Mineralization was confirmed with Alizarin red stain after 28 days in culture with regular media (A, C, E, and G) and with osteogenic media (B, D, F, and H). PDLSC (A, B), DPSC (C, D), BMSC (E, F), and GSC (G, H). Magnification: 10×
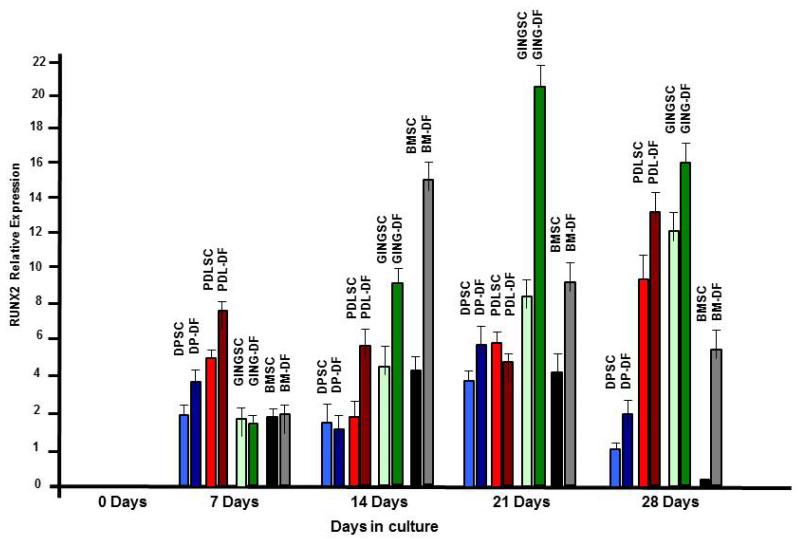
RUNX2 is associated with mineralized tissue formation and osteoblast differentiation; it is a master regulator for bone formation. We then tested if DSC differentiation and mineralization correlated with increased RUNX2 expression. qRT-PCR results showed no increase RUNX2 expression in the undifferentiated controls (Fig. 7, 0 days). Interestingly, DSCs incubated in DMEM and osteogenic inductive media revealed small increases in RUNX2 expression after 7 days in culture (Fig. 7, 7 days). However, the differentiated GING, DP and PDL cells showed increases in RUNX2 expression compared to undifferentiated cells. At 14 day in culture the differentiated GING and BM cells had large increases in RUNX2 expression, while RUNX2 expression in DP and PDL cells was similar to day 7 (Fig. 7, 14 days). After 21 days in culture RUNX2 expression peaked in GING-DF cells, modest increases were observed in DP-DF cells and RUNX2 expression was decreased in BM-DF cells (Fig. 7, 21 days). Interestingly, in all DSCs cultured in DMEM, RUNX2 expression increased at day 21 albeit at low levels. RUNX2 expression peaked in PDL-DF cells at 28 days and decreased in all other differentiated cell types (Fig. 7, 28 days). The staining shown in fig. 6 reveal that these cells had undergone the transition to a mineralized phenotype after 28 days in osteogenic inductive media, in correlation with a decreased RUNX2 expression.
Fig. 7.
. RUNX2 expression increases in DSC cultured in osteogenic inductive media-qRT-PCR results of RUNX2 screening of DSCs at 0, 7, 14, 21, and 28 days grown in regular media or osteogenic media. Data presents average ±SD of triplicate experiments
A regulated microRNA network in human PDLSC, GSC, and DPSC
We have shown that isolated human DSC incubated in osteogenic differentiation medium become mineralized associated with increased RUNX2 expression. Clearly, other authors have shown that RUNX2 is associated with differentiated mineralized tissues; however we tested that miRNA expression was differentially regulated during the differentiation process. In our miRNA analysis we compared the expression of 759 known miRNAs between the three differentiated cell types against the undifferentiated control cells. Our significance value for miRNA expression analyses was set at 30 or less cycles and 3-fold or greater increase or decrease (Table 1). The miRNA profile of BMSC revealed eight miRNAs that were differentially expressed when the cells were osteogenically induced: hsa-let-7i*, hsa-mir-29b, hsa-mir-222, hsa-mir-148a, hsa-mir-31, hsa-mir-136, hsa-mir-210, and hsa-mir-335. All miRNAs showed a decrease in expression when the stem cells were differentiated. The profile of DPSCs showed an increase in expression of two miRNAs, hsa-mir-1247 and hsa-mir-708. Four miRNAs were down-regulated: hsa-mir-502-p, hsa-mir-218, hsa-mir-99a, and hsa-mir-210. The profile of PDLSC showed a down-regulation of six miRNAs: hsa-mir-222, hsa-mir-15a, hsa-mir-99a, hsa-mir-199b-5p, hsa-mir-210, and hsa-mir-218. The miRNA profile of GSCs indicated a down-regulation of hsa-mir-99a, hsa-mir-99a*, hsa-mir-210, hsa-mir-218, and hsa-mir-214. Although miRNA-218 was not the most down-regulated miRNA, we decided to target miR-218 in this study since it was the only predicted miRNA to target RUNX2. (Table 1. A and B).
Table 1.
miRNA profiles in differentiated…expression among DSC.
| A. | |||||||
|---|---|---|---|---|---|---|---|
| BMSC miRNA | Fold change | DPSC miRNA | Fold change | GSC miRNA | Fold change | PDLSC miRNA | Fold change |
| hsa-let-7i* | 3.125 × decrease | hsa-mir-708 | 3.52 × increase | hsa-mir-99a | 4.76 × decrease | hsa-mir-222 | 3.03 × decrease |
| hsa-mir-29b | 3.125 × decrease | hsa-mir-1247 | 6.42 × increase | hsa-mir-99a* | 4.54 × decrease | hsa-mir-15a | 3.70 × decrease |
| hsa-mir-222 | 3.22 × decrease | hsa-mir-502-p | 3.03 × decrease | hsa-mir-210 | 4.54 × decrease | hsa-mir-99a | 5.00 × decrease |
| hsa-mir-148a | 3.57 × decrease | hsa-mir-218 | 3.12 × decrease | hsa-mir-218 | 3.84 × decrease | hsa-mir-199b-5p | 5.56 × decrease |
| hsa-mir-31 | 3.70 × decrease | hsa-mir-99a | 3.33 × decrease | hsa-mir-214 | 2.85 × decrease | hsa-mir-210 | 6.67 × decrease |
| hsa-mir-136 | 5.88 × decrease | hsa-mir-210 | 9.09 × decrease | hsa-mir-218 | 16.67 × decrease | ||
| hsa-mir-210 | 12.5 × decrease | ||||||
| hsa-mir-335 | 50.00 × decrease | ||||||
| B. | ||||
|---|---|---|---|---|
| miRNA | BMSC | DPSC | PDLSC | GSC |
| hsa-mir-210 | Downregulated | Downregulated | Downregulated | Downregulated |
| hsa-mir-222 | Downregulated | - | Downregulated | - |
| hsa-mir-218 | - | Downregulated | Downregulated | Downregulated |
| hsa-mir-99a | - | Downregulated | Downregulated | Downregulated |
miRNA-218 regulates RUNX2 expression
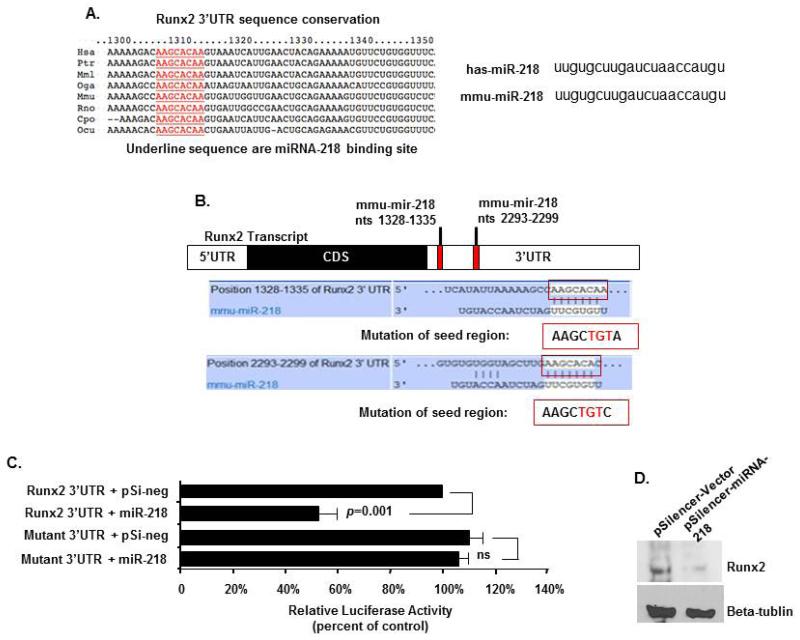
Three different online programs (PicTar, TargetScan, mirBase) were used to predict possible targets of microRNAs. RUNX2 was suggested as a potential target of miRNA-218 and because miRNA-218 expression decreased in differentiated DSCs and RUNX2 increased we tested if this miRNA targeted RUNX2. The RUNX2 3′UTR miRNA-218 7 nucleotide-binding element is highly conserved among different vertebrate species (Fig. 8A). Furthermore, both human and mouse miRNA-218 are identical in sequence (Fig. 8A). The RUNX2 3′UTR and mutated seed region 3′UTR was cloned downstream of the luciferase gene and used in a reporter assay for miRNA-218 activity (Fig. 7B) (22, 24). DSC cells transfected the Runx2 3′UTR luciferase construct and miRNA-218 demonstrated a 50% repression of luciferase activity (Fig. 7C). The mutation of the miRNA-218 seed sequence in the Runx2 3′UTR abolished regulation by miRNA-218 in the transfection experiments (Fig. 7C). Therefore, transfected miRNA-218 decreased endogenous Runx2 protein in PDLSC, GSC, and DPSC cells (Fig. 7D).
Fig. 8.
miRNA-218 targets Runx2 expression-A) Schematics of putative mmu-mir-218 binding site and mutant Runx2 3′UTR. Mutations of the seed binding region on 3′UTR of Runx2 were generated in the reporter plasmid. B) DSC cells were transfected with 2.5 μg of Runx2 3′UTR and mutant Runx2 3′UTR reporter plasmids. 1 μg of empty or miRNA-218 expression plasmids were co-transfected. To control for transfection efficiency all transfections included the SV-40 β-galactosidase reporter (0.5 μg). The activities are shown as mean-fold activation normalized to β-galactosidase activity (+SEM) from three independent experiments. C) Western blot of Runx2 in DSC cells transfected with 5 μg pSilencer vector or pSilencer-miRNA-218, cell lysates were harvested after 48 hours.
DISCUSSION
In our study, we were able to successfully isolate PDL, GT, and DP STRO-1 positive cells with the monoclonal antibody STRO-1. The STRO-1 surface marker antibody has been used to consistently identify stromal cell precursors in human bone marrow. STRO-1 positive cells have shown plasticity towards differentiation to an osteoprogenitor cell type which is characterized by RUNX2 expression (26, 32) and calcium deposits (33, 34).
STRO-1 has become a reliable tool for isolating stem cells of dental origin (1). The results of the STRO-1 labeling and confocal microscopy demonstrate that only certain cells from a heterogeneous population of DP, GT, and PDL cells bound the antibody. The additional stem markers used to identify these cells such as CD105, CD29, SSEA4 and OCT4 (27-30) confirmed our findings. Our results revealed that 2.1% of the PDL and 1.6% of the GT cells were STRO-1 positive, which compares favorably with other studies (1, 36, 37). The percentage of STRO-1 positive DP cells was low at 0.6%. Other researchers have used magnetic-activated cell sorting (MACS) or FACS to isolate these cells and determined these methods to be restrictive because of the rarity of these cells, compounded by the number of cells available after processing (6). Nevertheless, were able to successfully isolate homogenous samples of labeled cells. However, it is important to note that the amount of stem cells available at the perivascular area is strongly dependent on donor age and as we have a pool of donors, it is difficult to ascertain particular age of the tissue samples.
Once the stem cell populations were isolated, we evaluated the expression of two markers for undifferentiated cells, OCT4 and NANOG. The expression of Oct4 in mouse embryonic stem cells must be tightly regulated in order to maintain a stem cell phenotype (9). An increase in Oct3/4 expression causes differentiation into primitive endoderm and mesoderm, while repression induced the loss of pluripotency and de-differentiation to trophoectoderm. Similarly, NANOG was demonstrated to be another transcription factor that plays a crucial role in maintaining the undifferentiated status of stem cells (11). NANOG acts in parallel with cytokine stimulation of Stat3 to drive embryonic stem cell self-renewal (11). We have shown that STRO-1-labeled DSCs expressed these transcription factors as compared to the well-characterized human bone marrow stem cells, providing additional evidence of their undifferentiated status (36).
Differentiation of human dental stem cells
The DSC were induced to differentiate in order to elucidate the signaling cascade that ultimately ends in cell lineage differentiation. After the PDLSC, DPSC, GSC, and BMSC were cultured under osteogenic inducing conditions, we confirmed the presence of mineral deposits using alizarin red stain (1, 2, 5,37,38). In order to ascertain the time point of greatest osteogenic activity, we selected a peak expression of the transcription factor RUNX2, which has been demonstrated to promote expression of ECM products related to mineralized tissues, as well as to start a cascade of signaling which promotes differentiation (12). RUNX2 is a member of the RUNX family of transcription factors and encodes a nuclear protein with a Runt DNA-binding domain. RUNX2 plays a crucial role in osteoblast differentiation (39). RUNX2 expression peaked in BMSCs at day 14, while DPSCs and GSCs peaked at day 21 and PDLSCs peaked at day 28. These results are in agreement with a previous study (1). An explanation for the early RUNX2 expression in BMSCs may be that the embryological niche in the mesoderm area is more conductive for mineralization as compared to the ectodermal origin of PDLSC, GSC and DPSC. (40)
A role for miRNAs in human dental stem cells
The profile of BMSC revealed that eight miRNAs were down-regulated when the stem cells were induced to differentiate in osteogenic culture. In a recent report the expression of two of the miRNAs identified in our study hsa-miR-148a and hsa-miR-31, were also decreased in BMSC (21). They suggest that these miRNAs may play an important role in inhibiting osteogenic differentiation of mesenchymal stem cells. Taken together with our results both hsa-miR-148a and hsa-miR-31 may be important human miRNAs involved the osteogenic program.
To our knowledge, there have not been any studies reporting miRNA profiles in human dental-derived stem cells. The decrease in hsa-miRNA-210, hsa-miRNA-222, hsa-miRNA-218 and hsa-miRNA-99a expression in DPSC, GSC, and PDLSC ignited our interest to learn their role in cell differentiation mechanisms. These miRNAs appear to play an essential role in the differentiation of dental stem cells. However, despite having the same embryological origin, the overall miRNA profiles of each cell type did not completely overlap. This may be explained by the fact that each cell type occupies a specific niche within the dental tissues (40), and accounts for the differential expression of the miRNAs. It is also noteworthy that in addition to being expressed in both dental cell types, hsa-mir-210 and hsa-miR-222 were also down-regulated in the BMSC group. These miRNAs could play a role in osteogenesis across many cell and tissue types, and further research is needed to clarify this finding.
This is the first report of human DSCs differentially expressed during osteogenic differentiation and demonstrating that human miRNA-218 targets RUNX2 expression. A group of osteo-miRNAs (including miRNA-218) were recently identified as targeting Runx2 in mesenchymal cells to control osteogenic maturation (22). These miRNAs all have variable repression of Runx2 expression and it was proposed that increased miRNA expression in late stage osteoblast differentiation decreases Runx2 expression to permit maturation. However, during chrondrogenesis decreased miRNA expression could lead to increased Runx2 expression (22). A novel Runx2/miRNA-3960/miRNA-2861 regulatory feedback loop has been identified revealing a role for these miRNAs in osteoblast differentiation (19). This mechanism involves histone deacetylase 5, homeobox A2 transcription factor repression of Runx2 expression and BMP2. These data demonstrate the diverse mechanisms regulating miRNA and Runx2 expression as well as osteoblast differentiation. The human miRNAs involved in DSC differentiation may use some of these pathways and we are currently identifying new targets and signaling pathways for the set of four miRNAs that are decreased in differentiated DSC.
DNA microarrays of the undifferentiated and differentiated cells have been performed genes and genetic pathways are being analyzed and correlated to miRNA expression. In addition, we are over expressing specific miRNAs to test the candidate genes identified by DNA microarrays. By selecting a single miRNA and screening the gene profile, a more comprehensive idea of the processes in which those miRNAs participate may emerge.
In summary, DPSC, GSC, and PDLSC were successfully isolated and cultured. Osteogenic induction was performed; tissue mineralization was confirmed using quantitative real-time PCR, and tissue culture staining methods. miRNA profiles for BMSC, DPSC, GINGSC, and PDLSC populations showed changes in expression between undifferentiated and differentiated cell types. Further studies are warranted to ascertain the precise roles that these miRNAs play in stem cell proliferation and differentiation.
ACKNOWLEDGMENTS
This project was approved by UT-IRB Protocol # HSC-DB-10-0417. Confocal microphotography was performed by Dr. Gena Tribble, UTHSC-Houston. This research was supported by UTHSC-H start-up funds to ICG and National Institutes of Health grants DE13941 and DE18885 to B.A.A. All of the authors and coauthors on this research report no financial relationships related to any products listed in this study.
REFERENCES
- 1.Gay IC, Chen S, MacDougall M. Isolation and characterization of multipotent human periodontal ligament stem cells. Orthod Craniofac Res. 2007;10:149–160. doi: 10.1111/j.1601-6343.2007.00399.x. [DOI] [PubMed] [Google Scholar]
- 2.Gronthos S, Mankani M, Brahim J, Robey PG, Shi S. Postnatal human dental pulp stem cells (DPSCs) in vitro and in vivo. Proc Natl Acad Sci U S A. 2000;97:13625–13630. doi: 10.1073/pnas.240309797. [DOI] [PMC free article] [PubMed] [Google Scholar]
- 3.Huang GT, Gronthos S, Shi S. Mesenchymal stem cells derived from dental tissues vs. those from other sources: their biology and role in regenerative medicine. J. Dent. Res. 2009;88:792–806. doi: 10.1177/0022034509340867. [DOI] [PMC free article] [PubMed] [Google Scholar]
- 4.Liu Y, Zheng Y, Ding G, Fang D, Zhang C, Bartold PM, Gronthos S, Shi S, Wang S. Periodontal Ligament Stem Cell-Mediated Treatment for Periodontitis in Miniature Swine. Stem Cells. 2008;26:1065–1073. doi: 10.1634/stemcells.2007-0734. [DOI] [PMC free article] [PubMed] [Google Scholar]
- 5.Miura M, Gronthos S, Zhao M, Lu B, Fisher LW, Robey PG, Shi S. SHED: Stem cells from human exfoliated deciduous teeth. Proc Natl Acad Sci U S A. 2003;100:5807–5812. doi: 10.1073/pnas.0937635100. [DOI] [PMC free article] [PubMed] [Google Scholar]
- 6.Shi S, Gronthos S. Perivascular niche of postnatal mesenchymal stem cells in human bone marrow and dental pulp. J Bone Miner Res. 2003;18:696–704. doi: 10.1359/jbmr.2003.18.4.696. [DOI] [PubMed] [Google Scholar]
- 7.Treves-Manusevitz Sandra, Hoz Lia, Rachima Heled, Montoya Gonzalo, Tzur Ephraim, Vardimon Alexander, Sampath Narayanan A, et al. Stem cells of the lamina propria of human oral mucosa and gingiva develop into mineralized tissues in vivo. J Clin Periodontol. 2013;40(1):73–81. doi: 10.1111/jcpe.12016. [DOI] [PubMed] [Google Scholar]
- 8.Wang F, Yu M, Yan X, Wen Y, Zeng Q, Yue W, Yang P, Pei X. Gingiva-derived mesenchymal stem cell-mediated therapeutic approach for bone tissue regeneration. Stem Cells Dev. 2011 Dec;20(12):2093–102. doi: 10.1089/scd.2010.0523. [DOI] [PubMed] [Google Scholar]
- 9.Niwa H, Miyazaki J, Smith AG. Quantitative expression of Oct-3/4 defines differentiation, dedifferentiation or self-renewal of ES cells. Nat Genet. 2000;24:372–376. doi: 10.1038/74199. [DOI] [PubMed] [Google Scholar]
- 10.Boiani M, Scholer HR. Regulatory networks in embryo-derived pluripotent stem cells. Nat Rev Mol Cell Biol. 2005;6(11):872–84. doi: 10.1038/nrm1744. [DOI] [PubMed] [Google Scholar]
- 11.Chambers I, Colby D, Robertson M, Nichols J, Lee S, Tweedie S, et al. Functional expression cloning of Nanog, a pluripotency sustaining factor in embryonic stem cells. Cell. 2003;113(5):643–55. doi: 10.1016/s0092-8674(03)00392-1. [DOI] [PubMed] [Google Scholar]
- 12.Ducy P, Zhang R, Geoffroy V, Ridall AL, Karsenty G. Osf2/Cbfa1: a transcriptional activator of osteoblast differentiation. Cell. 1997;89(5):747–54. doi: 10.1016/s0092-8674(00)80257-3. [DOI] [PubMed] [Google Scholar]
- 13.Shui C, Spelsberg TC, Riggs BL, Khosla S. Changes in Runx2/Cbfa1 expression and activity during osteoblastic differentiation of human bone marrow stromal cells. J Bone Miner Res. 2003;18:213–221. doi: 10.1359/jbmr.2003.18.2.213. [DOI] [PubMed] [Google Scholar]
- 14.Lin SL, Kim H, Ying SY. Intron-mediated RNA interference and microRNA (miRNA) Front. Biosci. 2008;13:2216–2230. doi: 10.2741/2836. [DOI] [PubMed] [Google Scholar]
- 15.Mallory AC, Vaucheret H. MicroRNAs: something important between the genes. Curr. Opin. Plant Biol. 2004;7:120–125. doi: 10.1016/j.pbi.2004.01.006. [DOI] [PubMed] [Google Scholar]
- 16.Petersen CP, Bordeleau ME, Pelletier J, Sharp PA. Short RNAs repress translation after initiation in mammalian cells. Mol Cell. 2006;21:533–542. doi: 10.1016/j.molcel.2006.01.031. [DOI] [PubMed] [Google Scholar]
- 17.Luzi E, Marini F, Sala SC, Tognarini I, Galli G, Brandi ML. Osteogenic Differentiation of Human Adipose Tissue-Derived Stem Cells Is Modulated by the miR-26a Targeting of the SMAD1 Transcription Factor. J Bone Miner Res. 2008;23:287–295. doi: 10.1359/jbmr.071011. [DOI] [PubMed] [Google Scholar]
- 18.Mizuno Y, Yagi K, Tokuzawa Y, Kanesaki-Yatsuka Y, Suda T, Katagiri T, Fukuda T, Maruyama M, et al. miR-125b inhibits osteoblastic differentiation by down-regulation of cell proliferation. Biochem Biophys Res Commun. 2008;368:267–272. doi: 10.1016/j.bbrc.2008.01.073. [DOI] [PubMed] [Google Scholar]
- 19.Li Z, Hassan MQ, Jafferji M, Aqeilan RI, Garzon R, Croce CM, van Wijnen AJ, Stein JL, Stein GS, Lian JB. Biological Functions of miR-29b Contribute to Positive Regulation of Osteoblast Differentiation. J Biol Chem. 2009;284:15676–15684. doi: 10.1074/jbc.M809787200. [DOI] [PMC free article] [PubMed] [Google Scholar]
- 20.Mizuno Y, Tokuzawa Y, Ninomiya Y, Yagi K, Yatsuka-Kanesaki Y, Suda T, Fukuda T, Katagiri T, et al. miR-210 promotes osteoblastic differentiation through inhibition of AcvR1b. FEBS Lett. 2009;583:2263–2268. doi: 10.1016/j.febslet.2009.06.006. [DOI] [PubMed] [Google Scholar]
- 21.Hu R, Liu W, Li H, Yang L, Chen C, Xia Z-Y, Guo L-J, Xie H, Zhou H-D, Wu X-P, Luo X-H. A Runx2/miR-3960/miR-2861 Regulatory Feedback Loop during Mouse Osteoblast Differentiation. J Biol Chem. 2011;286:12328–12339. doi: 10.1074/jbc.M110.176099. [DOI] [PMC free article] [PubMed] [Google Scholar]
- 22.Hassan MQ, Gordon JAR, Beloti MM, Croce CM, van Wijnen AJ, Stein JL, Stein GS, Lian JB. A network connecting Runx2, SATB2, and the miR-23a, 27a and 24-2 cluster regulates the osteoblast differentiation program. Proc Natl Acad Sci U S A. 2010;107:19879–19884. doi: 10.1073/pnas.1007698107. [DOI] [PMC free article] [PubMed] [Google Scholar]
- 23.Gao J, Yang T, Han J, Yan K, Qiu X, Zhou Y, Fan Q, Ma B. MicroRNA Expression During Osteogenic Differentiation of Human Multipotent Mesenchymal Stromal Cells From Bone Marrow. J Cell. Biochem. 2011;112:1844–1856. doi: 10.1002/jcb.23106. [DOI] [PubMed] [Google Scholar]
- 24.Zhang Y, Xie RL, Croce CM, Stein JL, Lian JB, van Wijnen AJ, Stein GS. A program of microRNAs controls osteogenic lineage progression by targeting transcription factor Runx2. Proc Natl Acad Sci U S A. 2011;108:9863–9868. doi: 10.1073/pnas.1018493108. [DOI] [PMC free article] [PubMed] [Google Scholar]
- 25.Amendt BA, Sutherland LB, Russo AF. Transcriptional antagonism between Hmx1 and Nkx2.5 for a shared DNA-binding site. J Biol Chem. 1999;274(17):11635–42. doi: 10.1074/jbc.274.17.11635. [DOI] [PubMed] [Google Scholar]
- 26.Cao H, Wang J, Li X, Florez S, Huang Z, Venugopalan SR, Elangovan S, Skobe Z, Margolis HC, Martin JF, Amendt BA. MicroRNAs play a critical role in tooth development. J Dent Res. 2010;89(8):779–84. doi: 10.1177/0022034510369304. [DOI] [PMC free article] [PubMed] [Google Scholar]
- 27.Trubiani O, Di Primio R, Traini T, Pizzicannella J, Scarano A, Piattelli A, Caputi S. Morphological and cytofluorimetric analysis of adult mesenchymal stem cells expanded ex vivo from periodontal ligament. Int J Immunopathol Pharmacol. 2005;18(2):213–21. doi: 10.1177/039463200501800204. [DOI] [PubMed] [Google Scholar]
- 28.Dhanasekaran M, Indumathi S, Rashmi M, Rajkumar JS, Sudarsanam D. Unravelling the retention of proliferation and differentiation potency in extensive culture of human subcutaneous fat-derived mesenchymal stem cells in different media. Cell Prolif. 2012;45(6):516–26. doi: 10.1111/j.1365-2184.2012.00843.x. [DOI] [PMC free article] [PubMed] [Google Scholar]
- 29.Kawanabe N, Murata S, Fukushima H, Ishihara Y, Yanagita T, Yanagita E, Ono M, et al. Stage-specific embryonic antigen-4 identifies human dental pulp stem cells. Exp Cell Res. 2012;318(5):453–63. doi: 10.1016/j.yexcr.2012.01.008. 10. [DOI] [PubMed] [Google Scholar]
- 30.Atari M, Barajas M, Hernández-Alfaro F, Gil C, Fabregat M, Ferrés Padró E, Giner L, Casals N. Isolation of pluripotent stem cells from human third molar dental pulp. Histol Histopathol. 2011;26(8):1057–70. doi: 10.14670/HH-26.1057. [DOI] [PubMed] [Google Scholar]
- 31.Liedtke Stefanie, Enczmann Jurgen, Waclawczyk Simon, Wernet Peter, Kogler Gesine. Oct4 and Its Pseudogenes Confuse Stem Cell Research. Stem Cell. 2007;1:364–366. doi: 10.1016/j.stem.2007.09.003. [DOI] [PubMed] [Google Scholar]
- 32.Doench JG, Petersen CP, Sharp PA. siRNAs can function as miRNAs. Genes Dev. 2003;17:438–442. doi: 10.1101/gad.1064703. [DOI] [PMC free article] [PubMed] [Google Scholar]
- 33.Lien CY, Lee OK, Su Y. Cbfb enhances the osteogenic differentiation of both human and mouse mesenchymal stem cells induced by Cbfa-1 via reducing its ubiquitination-mediated degradation. Stem Cells. 2007;25(6):1462–8. doi: 10.1634/stemcells.2006-0391. [DOI] [PubMed] [Google Scholar]
- 34.Shui C, Spelsberg TC, Riggs BL, Khosla S. Changes in Runx2/Cbfa1 expression and activity during osteoblastic differentiation of human bone marrow stromal cells. J Bone Miner Res. 2003;18(2):213–21. doi: 10.1359/jbmr.2003.18.2.213. [DOI] [PubMed] [Google Scholar]
- 35.Simmons PJ, Torok-Storb B. Identification of stromal cell precursors in human bone marrow by a novel monoclonal antibody. Blood. 1991;78:55–62. [PubMed] [Google Scholar]
- 36.Gronthos S, Graves SE, Ohta S, Simmons PJ. The STRO-1+ fraction of adult human bone marrow contains the osteogenic precursors. Blood. 1994;84:4164–4173. [PubMed] [Google Scholar]
- 37.Seo BM, Miura M, Gronthos S, Bartold PM, Batouli S, Brahim J, Young M, Robey PG, Wang CY, Shi S. Investigation of multipotent postnatal stem cells from human periodontal ligament. Lancet. 2004;364(9429):149–55. doi: 10.1016/S0140-6736(04)16627-0. [DOI] [PubMed] [Google Scholar]
- 38.Nagatomo K, Komaki M, Sekiya I, Sakaguchi Y, Noguchi K, Oda S, Muneta T, Ishikawa I. Stem cell properties of human periodontal ligament cells. J. Periodontal Res. 2006;41:303–310. doi: 10.1111/j.1600-0765.2006.00870.x. [DOI] [PubMed] [Google Scholar]
- 39.Lian JB, Javed A, Zaidi SK, Lengner C, Montecino M, van Wijnen AJ, Stein JL, Stein GS. Regulatory controls for osteoblast growth and differentiation: role of Runx/Cbfa/AML factors. Crit Rev Eukaryot Gene Expr. 2004;14(1-2):1–41. [PubMed] [Google Scholar]
- 40.Sharpe PT. Neural crest and tooth morphogenesis. Adv Dent Res. 1998;15:4–7. doi: 10.1177/08959374010150011001. [DOI] [PubMed] [Google Scholar]


