

Abstract
Although long considered a natively endowed and fixed trait, working memory (WM) ability has recently been shown to improve with intensive training. What remains controversial and poorly understood, however, are the neural bases of these training effects and the extent to which WM training gains transfer to other cognitive tasks. Here we present evidence from human electrophysiology (EEG) and simultaneous transcranial magnetic stimulation and EEG that the transfer of WM training to other cognitive tasks is supported by changes in task-related effective connectivity in frontoparietal and parieto-occipital networks that are engaged by both the trained and transfer tasks. One consequence of this effect is greater efficiency of stimulus processing, as evidenced by changes in EEG indices of individual differences in short-term memory capacity and in visual search performance. Transfer to search-related activity provides evidence that something more fundamental than task-specific strategy or stimulus-specific representations has been learned. Furthermore, these patterns of training and transfer highlight the role of common neural systems in determining individual differences in aspects of visuospatial cognition.
Introduction
Training on working memory (WM) tasks has been shown to improve performance on the same and related tasks and, in some cases, generalizes to other cognitive domains (Olesen et al., 2004; Jaeggi et al., 2008, 2011; Chein and Morrison, 2010). Although frontoparietal systems associated with cognitive control have been implicated in WM training and transfer (Olesen et al., 2004; Dahlin et al., 2008; Takeuchi et al., 2010), the neural bases of these effects remain poorly understood. In the present study, we investigated whether transfer of WM training to other cognitive tasks (near transfer) and domains (far transfer) depends on plastic change within this frontoparietal circuit, and between it and extrastriate regions important for stimulus processing. We used two electroencephalography (EEG)-based metrics: (1) measures of effective connectivity derived from delivering transcranial magnetic stimulation (TMS) to parietal cortex and measuring the magnitude and cortical distribution of the resultant evoked response (Johnson et al., 2012), and (2) an event-related potential (ERP) that has been linked with visual short-term memory (VSTM) capacity: the “contralateral delay activity” (CDA; Vogel and Machizawa, 2004).
We measured training-related changes in task-based effective connectivity of the superior parietal lobule (SPL), a key node for visuospatial WM (Koenigs et al., 2009), VSTM (Hamidi et al., 2009), and the endogenous control of attention (Corbetta and Shulman, 2002; Yantis and Serences, 2003), using the perturb-and-measure approach of concurrent TMS/EEG. Because this measure varies systematically with changes in global brain state (Ferrarelli et al., 2010) and behavioral state (Johnson et al., 2012), we expected that it would also be sensitive to changes in the causal interactions hypothesized to underlie WM training effects.
Interest in the CDA derives from its relation to individual differences in VSTM capacity (Luck and Vogel, 1997; Cowan, 2001). Because its magnitude scales with VSTM load and saturates at an individual's estimated VSTM capacity (Vogel and Machizawa, 2004), the CDA is thought to index the amount of information maintained in VSTM. Accordingly, we hypothesized that WM training would increase an individual's VSTM capacity, which would be paralleled by an increase in the at-capacity CDA amplitude.
Finally, we investigated far transfer effects using a visual search task that has no overt mnemonic components but that produces an ERP component analogous to the CDA. Search relates to VSTM in that it engages frontoparietal systems, it implicitly engages VSTM (Emrich et al., 2010), and individual differences in estimates of VSTM capacity correlate strongly with the amplitude of the “contralateral search activity” (CSA) recorded during the search period (Emrich et al., 2009; Luria and Vogel, 2011). Thus, if working memory training modulates CDA amplitude as predicted, and if VSTM and search similarly engage a common neural substrate, we hypothesized that training-related changes in the CDA would be mirrored by training-related changes in the CSA.
Results indicated that WM training improved VSTM and that this effect was underlain by increased effective connectivity within the frontoparietal control network. Furthermore, although WM training increased VSTM capacity, this was accompanied by a decrease in the amplitude of the CDA, and CSA.
Materials and Methods
Participants
Thirty participants (16 female; age, mean ± SD, 20.9 ± 2.75 years) were recruited for the study from the University of Wisconsin-Madison community. Inclusion criteria selected healthy participants between the ages of 18 and 35 years, with normal or corrected-to-normal visual acuity and normal color vision, and who were not currently taking medication for psychiatric conditions. All procedures were approved by the University of Wisconsin—Madison Institutional Review Board.
Overview of tasks
Training was preceded and followed by 2 d of testing on a variety of cognitive tasks, of which there were four categories: those used to train, those used to derive measures of effective connectivity using TMS/EEG (during which concurrent single-pulse TMS was delivered while EEG was recorded), those used to derive ERP measures using only EEG data, and those that were purely psychometric. All participants performed the tasks in the same order. This order was maintained over pretraining and post-training testing sessions.
Training tasks.
Both groups trained 5 d per week, for 5 weeks, for 40 min to an hour per day. Subjects could miss a total of 2 d during the study that were in addition to and nonconsecutive with built-in, weekly breaks from training (2 d per week). Thus, the mean number of training sessions may be <25, but no <23 sessions. One noncompliant subject, from the experimental group, was dropped from the analyses. Post-training assessment was performed 1, 2, or 3 d after the last training day.
The experimental training task was an adaptive, visuospatial, dual n-back task executed using Brain Workshop (version 4.8.1), freely available software (http://brainworkshop.sourceforge.net) (Jaeggi et al., 2008). Subjects had to attend to two stimulus dimensions: color and location. Stimuli varied between seven primary colors. The locations varied between eight positions on a 3 × 3 grid in the center of the monitor (fixation cross in center position). A total of 12.5% of trials were lure (N − 1, N + 1, or 2N) trials. An accuracy score (25 trials within a block) of ≥80% correct increased the n level. A score of 50–79% correct maintained the n level. Three consecutive scores of <50% correct decreased the n level. Subjects received accuracy feedback each trial. Subjects performed 25 blocks per training session. Each block tested an n value. Session performance was mean n reached across blocks. Difficulty (n value) was adjusted based on real-time performance. The control group performed an adaptive, speeded visuospatial task with no explicit WM component (“Tetris”; JsTetris version 1.16.0.0 created by Cezary Tomczak, freely available at http://code.google.com/p/js-tetris/). The control group subjects played Tetris for 38 min per session. Performance feedback on score was provided during the game. Session performance was the total score over all games. All training was performed under supervision. A 20-inch CRT monitor was used to display stimuli for both tasks.
Training gain was quantified by fitting (minimum least-squares) training performance per session to the power law function: y = ax−b, where y is the mean n level reached and a and b are constants. b is the “rate of learning” parameter (Newell and Rosenbloom, 1980). Additionally, control training gains were also fit to a linear function: y = p1*x + p2 where p1 is analogous to the gain parameter, b, described above. All subjects who showed a negative goodness of fit (adjusted R2) were excluded from the analyses of group-level training effects but were included in training gain-related analyses and their gain estimate was effectively zero (one experimental participant).
TMS/EEG task.
This task (referred to as the location VSTM task) tested spatial VSTM (Fig. 1a). Each trial consisted of a cue, followed by either two or four black squares presented serially, then a delay period, then a probe that either did or did not match (p = 0.5) the location of one of the stimuli. Subjects were instructed to maintain fixation throughout the delay. Feedback was provided on a trial-by-trial basis, with the word “Incorrect” appearing on the screen for 500 ms after an incorrect response (550 ms intertrial interval). The task block consisted of 480 trials (presented in sub-blocks of 60 trials). On 50% of trials (randomly interleaved), two TMS pulses were delivered during the delay period. The first pulse was delivered 750 ± 250 ms after delay-period onset, followed by the second pulse 2000 ± 250 ms later. Before testing, participants received verbal instructions and completed a block of 16 practice trials (without TMS), which was repeated until a criterion of 75% accuracy was reached (no more than three practice blocks were required for any subject). Within each hemifield, memory targets were presented within a 4.3° × 8.6° region centered ∼3.3° horizontally from fixation. Memory targets consisted of black squares subtending ∼1° of visual angle at a viewing distance of 70 cm and were presented on a gray background. The probe consisted of a black square (∼1° of visual angle). For nonmatch trials, the probe was presented at a randomly chosen location within one of the four screen quadrants and at a minimum of 2.5° (center-to-center distance) away from the memory target location.
Figure 1.
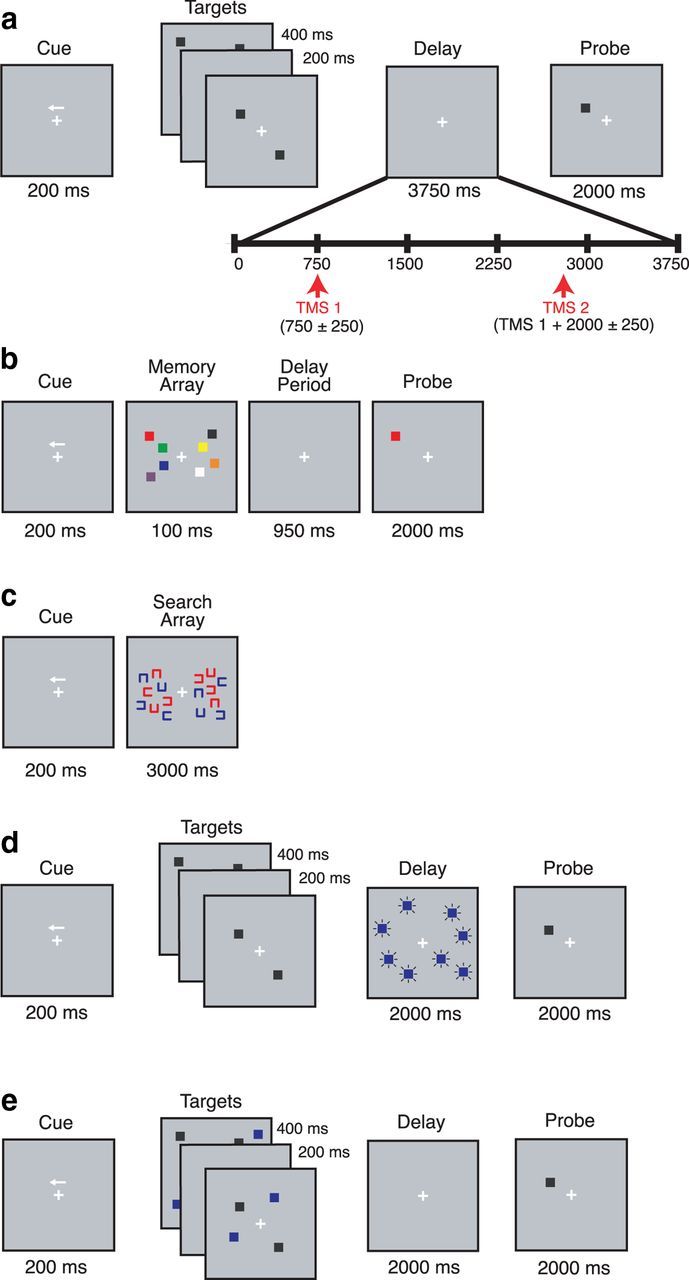
Schematic representation of tasks. a, Location VSTM task, where on 50% of trials, two pulses of TMS were delivered during the delay. Subjects were instructed to direct attention to the cued hemifield and remember the locations of the black stimuli over the delay. At the end of the trial, they were to indicate whether the probe location matched one of those shown during encoding. b, Color-in-location VSTM task, where subjects were instructed to remember the color and location of the stimuli over the delay. c, Visual search task, where subjects were instructed to search for a red “C” with the opening facing right (consistent across trials). d, DD task (a variant of the location VSTM task) during the delay of which, distracting blue squares were presented. e, TD task (another variant of the location VSTM task) during the encoding period of which, distracting blue squares were presented. In all tasks, subjects were instructed to maintain fixation throughout the delay.
TMS/EEG: targeting and stimulation.
This protocol was based on Johnson et al. (2012). TMS was delivered with a Magstim Standard Rapid magnetic stimulator fit with a focal bipulse, figure-of-eight 70 mm stimulating coil (Magstim). TMS was applied to a portion of the left SPL [Brodmann Area (BA) 7] (identified on the individual's whole-brain T1-weighted anatomical magnetic resonance imaging (MRI), acquired with a GE MR750 3T MRI scanner before the experiment (176 axial slices with a resolution of 1 mm). TMS targeting was achieved using a Navigated Brain Stimulation system (Nextstim) with infrared-based frameless stereotaxy and the individual's MRI. TMS was delivered at an intensity that resulted in an estimated electric field on the cortical surface, below the coil, of 110–140 V/m (which translated to 65–100% of stimulator output). The estimated electric field is derived from an electromagnetic model of the individual's cortical surface, which is based on his or her structural MRI, as calculated using algorithms provided by the Navigated Brain Stimulation algorithms. Generally, this translated to the TMS-evoked response, as measured in the ongoing EEG signal, being between 10 and 20 μV in amplitude at its first positive peak. The coil was oriented such that the handle pointed along the sagittal plane (downward), with some adjustments in exact positioning to minimize electrical artifacts at nearby electrodes. Stimulator intensity, coil position, and orientation for a given subject were held constant across the pretraining and post-training sessions. EEG auditory artifact from the TMS coil's discharge was masked by white noise played through headphones during the session.
TMS/EEG: EEG recording.
EEG was recorded with a 60-channel TMS-compatible amplifier (Nexstim), equipped with a sample-and-hold circuit that can hold amplifier output constant from 100 μs before to 2 ms after stimulation. Electrode impedance was <5 kΩ. The reference electrode was placed on the forehead. Eye movements were recorded with two additional electrodes placed near the eyes. The sampling rate was 1450 Hz with 16-bit resolution.
TMS/EEG: data preprocessing.
Data were processed offline using the EEGLab toolbox (Delorme and Makeig, 2004), downsampled to 365 Hz, and bandpass filtered between 1 and 100 Hz. Independent components analysis was used to identify and remove components reflecting residual muscle activity, eye movements, blink-related activity, and residual TMS-related artifacts. Before independent components analysis, data were average-referenced.
TMS/EEG: source reconstruction.
Source modeling and calculation of effective connectivity measures were performed using the methods described by Casali et al. (2010). Individual cortical meshes (5124 vertices) were created using the Statistical Parametric Mapping software package (SPM8; http://www.fil.ion.ucl.ac.uk/spm/). Meshes were coregistered with EEG sensors. The 3-spheres BERG method was used to model conductive head volume using the Brainstorm software package (http://neuroimage.usc.edu/brainstorm). The same forward models were used to analyze both the pretraining and post-training data. The inverse solution was calculated on a trial-by-trial basis using an empirical Bayesian approach as implemented in SPM (version 5). To compute the current evoked by TMS in different cortical areas, individual cortical surfaces were attributed to different BAs using an automatic anatomical classification method that maps the individual cortical surface to the region-of-interest (ROI) masks provided by the WFUPickAtlas tool (http://ansir.wfubmc.edu).
TMS/EEG: whole-brain analysis.
The effect of TMS on the EEG was characterized by two synthetic indices: significant current density (SCD) and significant current scatter (SCS) (Casali et al., 2010). SCD is the sum of the absolute amplitude of all statistically significant TMS-evoked currents observed over a given time interval and/or cortical region. SCS is the sum of the geodesic distances between the stimulated brain region and any significant current source over a given time interval and cortical volume. Thus, SCS measures the spatial spread of TMS-evoked currents to distal brain regions. These measures have demonstrated good test-retest reliability (Casarotto et al., 2010). To provide an overall assessment of the effects of training on the TMS-evoked response, we quantified pretraining versus post-training changes in global SCD and SCS (which is, by nature, a global measure).
Data for each measure were averaged over a time window from 10 to 500 ms after stimulation. Follow-up analyses were also performed using specific, shorter time intervals, and will be detailed in Results. For both measures, data were collapsed over cued-visual-field because this factor was not of primary theoretical interest. Training effects were measured using a three-way ANOVA with Group (experimental or control), Session (pretraining or post-training), and Load (load 2 or 4) as factors and Subject as a repeated measure.
TMS/EEG: effective connectivity analysis.
Effective connectivity refers to the degree to which two brain areas causally influence one another. The present study addressed the effective connectivity between particular brain areas, while the brain was engaged in the location VSTM task, and how this connectivity changed with training. The TMS-evoked response yields a direct measure of state-specific, effective connectivity by virtue of the fact that TMS can be delivered to a known cortical area at a known time, and the consequent response measured at later time points, both at that particular area and at brain areas distal to it. In the present study, TMS was delivered, and its EEG-response measured, during the delay period of the location VSTM task, described above. To index effective connectivity, SCD was measured at the site of TMS and at several regions of parietal and frontal cortex that have shown significant differences in SCD during location VSTM versus fixation (Johnson et al., 2012). Because effective connectivity between SPL and these regions varied as a function of behavioral state, this effect on connectivity reflects changes in dynamic coupling between these brain regions, rather than structural connections between them.
ROIs were determined a priori from Johnson et al. (2012) and included 12 areas: BAs 39, 40, 7, and 5 in parietal cortex and 6, 8, 9, and 46 in frontal cortex, primary motor cortex (BA 4), as well as calcarine and extracalcarine BAs 17, 18, and 19, the latter also including caudal intraparietal sulcus. Frontal polar cortex (BA 10) was used to control for nonspecific effects of TMS because this area shows a large evoked response during passive fixation as well as during the delay of a short-term memory task, but crucially, does not differentiate between the two cognitive states (Johnson et al., 2012).
Because TMS was delivered only to the left hemisphere, an initial ANOVA was performed to evaluate the possibility of lateralized differences in SCD: Group (experimental or control) × Session (pretraining or post-training) × Load (load 2 or 4) × Hemisphere (left or right), with Subject as a repeated measure. When this analysis produced no evidence for an interaction with the factor of Hemisphere, we proceeded with the theoretically motivated omnibus ANOVA that collapsed across the factor of hemisphere and assessed the factors of Group, Session, Load, and ROI (12 levels) with Subject as a repeated measure.
EEG only tasks
Color-in-location VSTM.
This task is commonly used to assess VSTM (Vogel and Machizawa, 2004). Each trial involved a cue directing attention to one hemifield, followed by a memory array, followed by a delay period, and finally a probe that either did or did not match (p = 0.5) one of the stimuli (both color and location) in the cued hemifield (intertrial interval, 350–450 ms; Fig. 1b). Memory load was varied randomly between 2, 4, and 6 items (200 trials per load and hemifield; 1200 trials total). Targets were squares presented within a rectangular region on either side of the screen that was ∼4.3° (width) × ∼8.6° (height) of visual angle, subtended ∼3.3° from central fixation, at a viewing distance of 70 cm. Seven standard colors were used: red, green, white, black, yellow, blue, and purple. The locations of the colors were assigned randomly, and no two colors were allowed to repeat within a hemifield, although up to a single color could repeat between hemifields. VSTM capacity (K) was computed using the formula K = S(H − F) where K is memory capacity, S is the set size (2, 4, or 6), H is the hit rate, and F is the false alarm rate (Pashler, 1988; Cowan, 2001). The K estimate for each subject used in the analyses was the highest K derived from any of the set sizes. We chose to use the highest K because it captures what an individual's maximum capacity could be in optimal testing conditions. Supracapacity set sizes (e.g., load 6 for this cohort) tended to yield a lower K estimate than this optimal set size. Although the reason for this is not well established, it may have to do with individual differences in fluid intelligence and encoding strategies (Cusack et al., 2009).
Visual search.
Participants indicated whether or not an upright, red “C” (same target across trials) appeared in the cued hemifield (p = 0.5; intertrial interval, 350–450 ms). Distractor stimuli were red or blue “C's” rotated to 90°, 180°, or 270° of canonical orientation (similar to the Landolt C, Fig. 1c). There were 140 trials per condition, which yielded a total of 1120 trials. Mean reaction time (RT) for target-present, correct trials yielded a measure of search efficiency. Target present trials were excluded from the EEG data analyses because the time of search completion could have occurred anytime during the search period. Stimuli were presented within a rectangular region on either side of the screen that was ∼4.3° (width) × ∼8.6° (height) of visual angle. It was subtended ∼3.3° from central fixation, at a viewing distance of 70 cm. The display loads varied between 8 or 16 items with 50% red items within one display. Participants were encouraged to respond as quickly as possible. Data from the 16-item search are not reported in this study.
EEG only: EEG recording and analysis.
EEG was recorded with a 256-channel EEG amplifier (Electrical Geodesic), sampled at 500 Hz, and referenced to Cz. Electrode impedances were <50 kΩ. Offline, data were processed according to the methods of Vogel and Machizawa (2004). Data were downsampled to 250 Hz and referenced to the average of both mastoid electrodes. Horizontal and vertical eye movements were determined from standard channels positioned about the eyes. Trials contaminated with blinks (>60 μV deviations) were excluded. Participants with a >50% rejection rate were dropped from the EEG data analysis. The mean rejection rate was 19% (range, 7–50%) for the color-in-location VSTM task. Participants with a >70% rejection rate were dropped from the search data analysis, with higher rates resulting from exclusion of trials for which the subject responded before 950 ms. Data from 60 standard electrode locations (international 10-10 sites) were used in the analysis. Data were bandpass filtered from 0.1 to 30 Hz. All data were processed using MATLAB (MathWorks, R2010b) and the EEGLAB toolbox. For the color-in-location VSTM task, the EEG data from one subject was dropped because of data corruption. For two experimental and two control subjects, data from <1200 trials were processed for either pretraining or post-training (range, 470–1048 trials) because of data corruption; however, out of those trials, <33% (range 12–33%) were rejected because of blink artifacts. Thus, after processing, four participants were dropped from the analysis (three control and one experimental) because of excessive blink and eye movement artifact, and one was dropped because of amplifier drift (control subject). Of the remaining participants, one control subject's EEG data (specifically the mean value of both lateralized ERPs) were >2 SD from mean, and so this subject was excluded as an outlier. This left 12 experimental and 10 control group participants. For the visual search task, the same subjects' data were excluded for the same reasons, leaving 7 experimental and 8 control group participants. Finally, CDA and CSA waveforms were derived from normalization of the contralateral waveform (relative to target) by the ipsilateral waveform, for VSTM loads 2, 4, or 6 and the 8-item search conditions.
Psychometric tasks
The battery included five tasks, as follows:
Delay-distraction (DD) task (Fig. 1d). This task was a variant of the location VSTM task (Fig. 1a) used during TMS/EEG but also included additional distraction during the delay period. All trials had a VSTM load of four items. Subjects were instructed to remember the locations of the memoranda and ignore the irrelevant (not-to-be-remembered) blue squares presented in the cued and uncued hemifields during the delay. Distraction was presented on 50% of the trials. Each distractor's duration was 200 ms with a jittered interstimlus interval of 50–100 ms. The delay was 2000 ms. There were 240 trials total (presented in sub-blocks of 60 trials).
Target-epoch distraction (TD) task (Fig. 1e). This task was a second variant of the location VSTM task, but in this case, the task included additional distraction during encoding. Trials consisted of a VSTM load of either two or four items, similar to the location VSTM task described above, and included additional trials with a VSTM load of two items and two distractors randomly interspersed among the serially presented, relevant memory targets, all during the encoding period. There were 120 trials per condition (6 sub-blocks). The delay period (2000 ms) had no distraction. These three variants were selected because they operationalize two theoretical factors (capacity and filtering) hypothesized to account for individual differences in WM and attention (Machizawa and Driver, 2011). TMS was not delivered during these variants.
Other psychometric tasks included (3) Operation Span (Unsworth et al., 2005), (4) Color-naming Stroop interference task (Stroop, 1935) with 75% congruent and 25% incongruent trials and a total of 36 trials, and (5) Raven's Advanced Progressive Matrices (RAPM) (Raven et al., 2003). For RAPM, 24 subjects were tested using a procedure adapted from the standard format where odd-numbered problems (18 test and 6 practice matrices) were administered during the pretraining session, and the even-numbered problems (18 test and 6 practice matrices) were administered during the post-training session. Participants were given 2.5 min to complete the practice set and 10 min to complete the test set, similar to that reported previously (Jaeggi et al., 2008). The other six subjects (3 experimental and 3 control) were given the full examination pretraining and post-training. The scores across subjects were standardized for comparison.
For all tasks, outlier subjects were delineated as those whose performance during either pretraining or post-training sessions was >2 SD below the mean.
Results
Pretraining behavioral measures
Before training, mean color-in-location VSTM capacity (K) was 2.16 (range, 0.80–3.36), with individual differences predicting individual differences in pretraining CDA amplitude (r(20) = −0.62, p = 0.002, two-sided), as well as individual differences in visual search efficiency (r(21) = −0.44, p = 0.03, two-sided). After pretraining testing, subjects were randomly assigned to the experimental (i.e., WM training) or active control (i.e., Tetris training) group. The groups did not differ in any pretraining behavioral measures: one-way ANOVA modeling fixed (Group) and random (Subject) effects (see Tables 1, 4, 5, 6). Additionally, the K values for each set size were not different between groups pretraining (unpaired t, p > 0.1).
Table 1.
Training-related change in behavioral performance on location VSTM task
| Experimental |
Control |
F valuesa |
|||||||
|---|---|---|---|---|---|---|---|---|---|
| Pretraining | Post-training | Pretraining | Post-training | Group (df 1,23) | Session (df 1,23) | Load (df 1,23) | Group × Session (df 1,23) | Group × Session × Load (df 1,23) | |
| Load 2 ACC | 0.78 (0.07) | 0.80 (0.06) | 0.75 (0.09) | 0.78 (0.07) | 1.25 | 6.78* | 296.33** | 0.50 | 4.74* |
| Load 4 ACC | 0.66 (0.08) | 0.71 (0.07) | 0.65 (0.07) | 0.66 (0.09) | 0.19 | 9.21** | 34.91** | 2.13 | 0.17 |
| Load 2 RT (ms) | 803.54 (166.67) | 708.47 (86.40) | 797.98 (108.34) | 760.20 (80.38) | |||||
| Load 4 RT (ms) | 845.10 (150.46) | 752.48 (100.29) | 825.12 (125.02) | 797.13 (113.53) | |||||
Data are mean (SD). ACC, Accuracy (%); df, degrees of freedom.
aANOVA modeling fixed and random effects. Subjects taken as a random effect nested in group.
*p ≤ 0.05;
**p ≤ 0.01.
Table 4.
Training-related change in performance on EEG-only tasks
| Experimental group |
Control group |
F values (df, df)a |
|||||
|---|---|---|---|---|---|---|---|
| Pretraining | Post-training | Pretraining | Post-training | Group | Session | Group × Session | |
| K estimate | 2.28 (0.55) | 2.54 (0.48) | 2.05 (0.59) | 2.18 (0.65) | 1.23 (1, 24) | 3.87 (1, 24) | 0.59 (1, 24) |
| Search RTb (ms) | 836.22 (112.78) | 704.93 (67.74) | 859.99 (141.58) | 763.39 (144.67) | 0.16 (1, 18) | 5.32* (1, 18) | 0.44 (1, 18) |
Data are mean (SD), unless otherwise indicated. RT, Reaction time; df, Degrees of freedom.
aANOVA modeling fixed and random effects. Subject taken as a random effect nested in Group.
bDerived from correct, target-present, 8-item search trials.
*p ≤ 0.01.
Table 5.
Training-related change in performance on psychometric tasks
| Experimental |
Control |
F valuesa |
|||||||
|---|---|---|---|---|---|---|---|---|---|
| Pretraining | Post-training | Pretraining | Post-training | Group | Session | Load | Group × Session | Group × Session × Load | |
| Delay-distraction task performance | |||||||||
| (df, df) | (1, 25) | (1, 25) | (1, 25) | (1, 25) | (1, 25) | ||||
| Load 4 ACC | 0.68 (0.08) | 0.72 (0.07) | 0.66 (0.08) | 0.67 (0.09) | 1.09 | 4.12* | 4.38* | 0.05 | 2.74 |
| Load 4 + distractors ACC | 0.67 (0.08) | 0.68 (0.07) | 0.64 (0.08) | 0.67 (0.08) | |||||
| Load 4 RT | 829.34 (135.27) | 742.68 (82.55) | 856.39 (117.20) | 797.96 (111.88) | 1.56 | 17.46** | 2.02 | 1.17 | 0.75 |
| Load 4 + distractors RT | 843.65 (129.94) | 736.96 (93.67) | 868.68 (98.75) | 813.20 (95.70) | |||||
| Target epoch-distraction task performance | |||||||||
| (df, df) | (1,25) | (1,25) | (2,50) | (1,25) | (2,50) | ||||
| Load 2 ACC | 0.82 (0.06) | 0.85 (0.05) | 0.78 (0.10) | 0.82 (0.10) | 2.40 | 7.66** | 131.30** | 0.26 | 0.05 |
| Load 4 ACC | 0.69 (0.09) | 0.70 (0.07) | 0.64 (0.08) | 0.68 (0.09) | |||||
| Load 2 + 2 distractors ACC | 0.78 (0.07) | 0.82 (0.06) | 0.73 (0.12) | 0.78 (0.07) | |||||
| Load 2 RT | 763.27 (137.47) | 679.80 (78.54) | 793.85 (64.74) | 721.50 (93.29) | 1.06 | 16.44** | 9.84** | 1.03 | 0.67 |
| Load 4 RT | 806.59 (129.97) | 721.04 (75.78) | 804.78 (90.45) | 760.20 (91.17) | |||||
| Load 2 + 2 distractors RT | 759.10 (138.82) | 674.47 (77.93) | 769.07 (44.29) | 733.84 (71.27) | |||||
Data are given as mean (SD). ACC, Accuracy (% correct); df, degrees of freedom.
aANOVA modeling fixed and random effects. Subject taken as a random effect nested in Group.
*p ≤ 0.05;
**p ≤ 0.01.
Table 6.
Training-related change in performance on psychometric tasks
| Experimental group |
Control group |
F (df, df)a |
|||||
|---|---|---|---|---|---|---|---|
| Pretraining | Post-training | Pretraining | Post-training | Group | Session | Group × Session | |
| Operation span score | 49.92 (11.59) | 52.17 (12.51) | 48.08 (14.99) | 55.46 (16.77) | 0.04 (1, 24) | 2.92 (1, 24) | 0.55 (1, 24) |
| Stroop task RT | 126.81 (51.98) | 134.18 (70.86) | 233.40 (164.66) | 165.74 (123.08) | 1.38 (1, 16) | 2.08 (1, 16) | 2.89 (1, 16) |
| RAPM (raw score) | |||||||
| Full examination (n = 3 per group) | 29.0 (2.65) | 31.0 (1.73) | 28.33 (3.79) | 30.33 (4.51) | |||
| Half examination (n = 10 per group) | 11.8 (1.75) | 10.7 (2.41) | 10.58 (1.24) | 9.50 (2.02) | 0.04 (1, 24) | 2.91 (1, 24) | 0.04 (1, 24) |
Data are mean (SD). df, Degrees of freedom.
aANOVA modeling fixed and random effects. Subject taken as a random effect nested in Group.
Training performance
Participants completed a mean of 24.2 (SD 1.0) training sessions. Both groups showed training gains (Fig. 2). The experimental group's training performance was fit to a power function (mean adjusted R2 = 0.81), the rate parameter yielding a measure of training-related improvement (Newell and Rosenbloom, 1980). The power function fit was poorer for the control group (mean adjusted R2 = 0.49), and so a linear fit was used to estimate control training improvement (mean adjusted R2 = 0.76).
Figure 2.
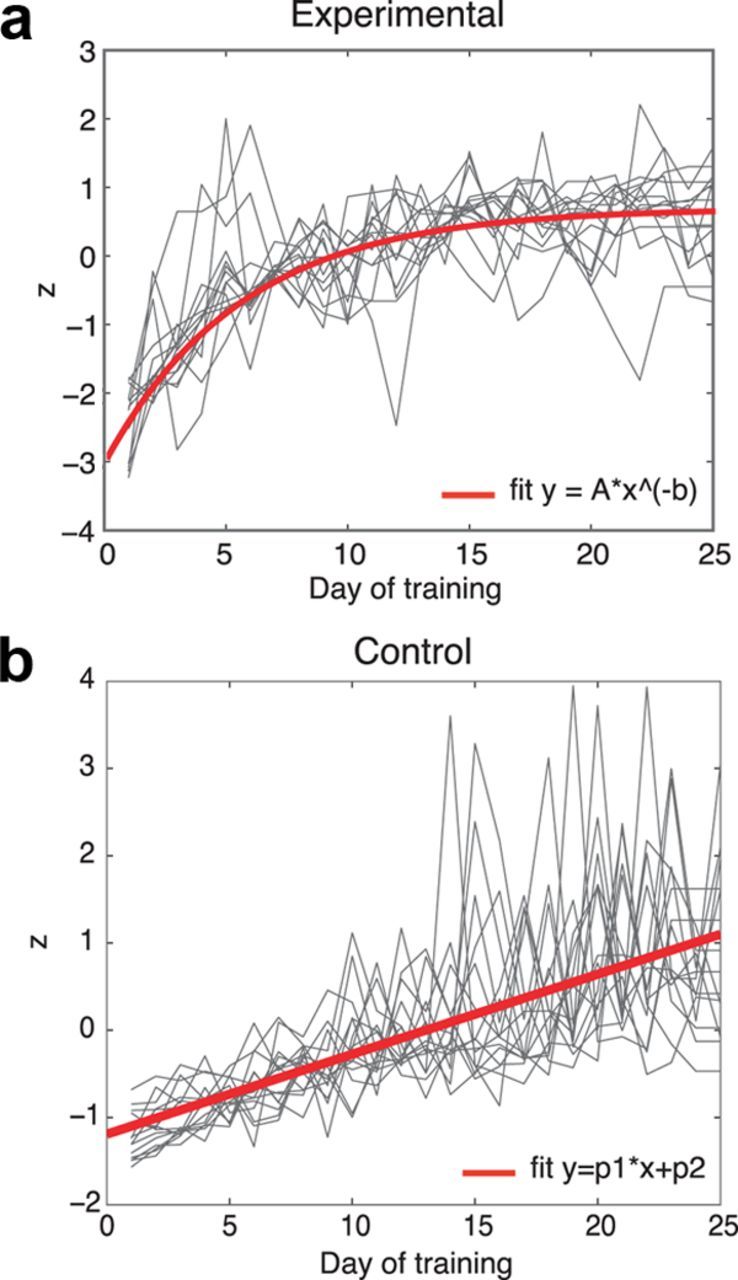
Training performance. Both groups improved on respective training tasks. Red represents mean training data fit; gray, individual daily task performance. a, Gains for dual n-back task (experimental task; N = 14). Data were fit to a power function. b, Gains for Tetris (control task; N = 15). Data were fit to a linear function.
Effects of training on effective connectivity
Behavior
WM training significantly improved VSTM performance on the location VSTM task compared with the active control task. Experimental group accuracy improved more on load 4 trials (vs load 2) than the control group accuracy (Group × Session × Load interaction, p = 0.04; Table 1). Pairwise comparisons indicated the experimental group showed a significant improvement particularly on load 4 trials (t(11) = −2.90, p = 0.01, two-sided), but not load 2 trials (t(11) = −0.98, p = 0.35, two-sided). The control group did not show significant improvement within load 4 (t(13) = −0.75, p = 0.47, two-sided), but trending improvement within load 2 (t(13) = −2.04, p = 0.06, two-sided). There was no significant effect of TMS on behavior between groups and/or between sessions (no significant TMS × Session or TMS × Group interaction). There was a statistical effect of TMS that was consistent across groups and sessions (significant TMS × Load × Cued visual field interaction, F(1,21) = 7.08, p = 0.01) in that TMS enhanced the performance on left visual field, load 2 trials; however, this effect was not significant upon further pairwise testing.
TMS/EEG
The initial ANOVA examining possible effects of hemisphere in the training data yielded no significant Group × Session × Load × Hemisphere interaction (F(1,20) = 0; not significant), and thus we proceeded with the ANOVA comparing the effects of group, session, load, and ROI. All subsequent analyses collapsed across the factor of Hemisphere.
Before training, the two groups did not differ on measures of global SCD or SCS (Table 2). This was mirrored at the level of individual BAs with the exception that pretraining SCD differed between groups at BA 18 (F(1,20) = 4.26, p = 0.052), and marginally so at BAs 17 and 19 (F(1,20) = 4.11, p = 0.056 and F(1,20) = 3.67, p = 0.07, respectively), and so these regions were excluded from further analyses. In the pretraining session, both groups showed increases as a function of memory load: in global SCD, SCS, and in ROI-based measures of SCD in prefrontal cortex (PFC; BAs 8, 9, and 46), caudal frontal cortex (BAs 4 and 6), inferior parietal lobule (BA 39 and 40), and superior parietal cortex (BA 5; Table 2). Because load varied randomly from trial to trial, the phenomenon of increased SCD and SCS as a function of load necessarily reflected a dynamic, trial-specific alteration in the efficacy of the propagation of the TMS-evoked signal.
Table 2.
Omnibus two-way ANOVAs (Group × VSTM Load) assessing pretraining effects on global SCD and SCS and local SCD (F values)a
| Group | Load | Group × Load | |
|---|---|---|---|
| SCD | 0.466 | 22.413** | 1.476 |
| SCS | 0.010 | 18.197** | 0.703 |
| BA4 | 0.029 | 14.064** | 0.318 |
| BA5 | 0.056 | 5.277* | 0.740 |
| BA6 | 0.045 | 6.811* | 0.427 |
| BA7 | 1.235 | 2.712 | 0.621 |
| BA8 | 0.183 | 7.309* | 1.945 |
| BA9 | 0.123 | 12.277** | 0.311 |
| BA17 | 4.110 | 3.408 | 0.452 |
| BA18 | 4.259* | 6.460* | 0.385 |
| BA19 | 3.664 | 3.995 | 0.485 |
| BA39 | 2.554 | 4.345* | 0.003 |
| BA40 | 0.612 | 19.471** | 1.328 |
| BA46 | 0.292 | 11.985** | 0.233 |
| Control region | |||
| BA10 | 0.226 | 3.925 | 0.000 |
aSubject was taken as a repeated measure nested in group.
*p ≤ 0.05;
**p ≤ 0.01.
The omnibus ANOVA assessing the effects of training, with the factors of group, session, load, and ROI (with subject as a repeated measure), revealed a main effect of ROI (F(1,220) = 18.79, p < 0.0001), two-way interactions of Session × ROI (F(10,200) = 4.19, p < 0.0001) and Load × ROI (F(10,200) = 2.63, p = 0.005), and a trend toward a three-way interaction of Group × Session × Load (F(1,220) = 3.45, p < 0.08). To assess the effects of training on effective connectivity between SPL and other VSTM-related ROIs, we next performed an ANOVA at each ROI. A main effect of session would indicate a training-related change in effective connectivity for both groups (i.e., experimental and control). An interaction of Group × Session would suggest an effect of training on both conditions of the location VSTM task, whereas an interaction of Group × Session × Load would indicate that training had a differential effect on effective connectivity at one of the two loads. (For these analyses, F values and degrees of freedom are reported in Tables 2 and 3.)
Table 3.
Omnibus three-way ANOVAs (Group × Session × VSTM Load) assessing transfer of training effects on global SCD and SCS and local SCD (F values)a
| Group | Session | Load | Group × Session | Group × Session × Load | |
|---|---|---|---|---|---|
| SCD | 0.004 | 1.068 | 3.179 | 2.235 | 3.116 |
| SCS | 0.052 | 1.564 | 5.195* | 0.103 | 2.930 |
| BA4 | 0.018 | 3.435 | 6.186* | 0.134 | 4.349* |
| BA5 | 0.000 | 1.793 | 4.594* | 0.151 | 1.379 |
| BA6 | 0.049 | 4.567* | 3.222 | 0.009 | 2.476 |
| BA7 | 0.112 | 0.096 | 1.473 | 2.482 | 0.398 |
| BA8 | 0.216 | 3.082 | 2.270 | 0.041 | 7.474* |
| BA9 | 0.187 | 6.389* | 1.749 | 0.094 | 4.964* |
| BA39 | 0.640 | 1.230 | 2.684 | 4.686* | 0.260 |
| BA40 | 0.058 | 0.455 | 8.611** | 2.164 | 1.080 |
| BA46 | 0.146 | 9.386** | 1.855 | 0.018 | 1.227 |
| Control region | |||||
| BA10 | 0.037 | 4.113 | 3.195 | 0.817 | 0.078 |
aSubject was taken as a repeated measure nested in group.
*p ≤ 0.05;
**p ≤ 0.01.
Common test-retest patterns across groups
Main effects of session in frontal ROIs (BAs 6, 9, and 46) indicated that both groups showed pretraining to post-training increases in these regions (Table 3). No such effect was seen in the frontal control area (BA 10).
WM training-specific effects
Overall increase in effective connectivity
In parietal BA 39, a Group × Session interaction (p = 0.043) resulted from the fact that SCD was markedly lower at both loads post-training versus pretraining for the control group but increased post-training versus pretraining for both loads for the experimental group (Fig. 3e; Table 3). Follow-up, pairwise comparisons indicated that the effect in BA 39 was the result of an increase in experimental SCD across loads (for load 2, t(11) = −2.48, p = 0.02; and for load 4, t(11) = −2.09, p = 0.04), and a decrease across loads in the control SCD (for load 2, t(11) = 2.77, p = 0.009; and for load 4, t(11) = 3.12, p = 0.003). No such effect was seen in the control area (BA 10).
Figure 3.
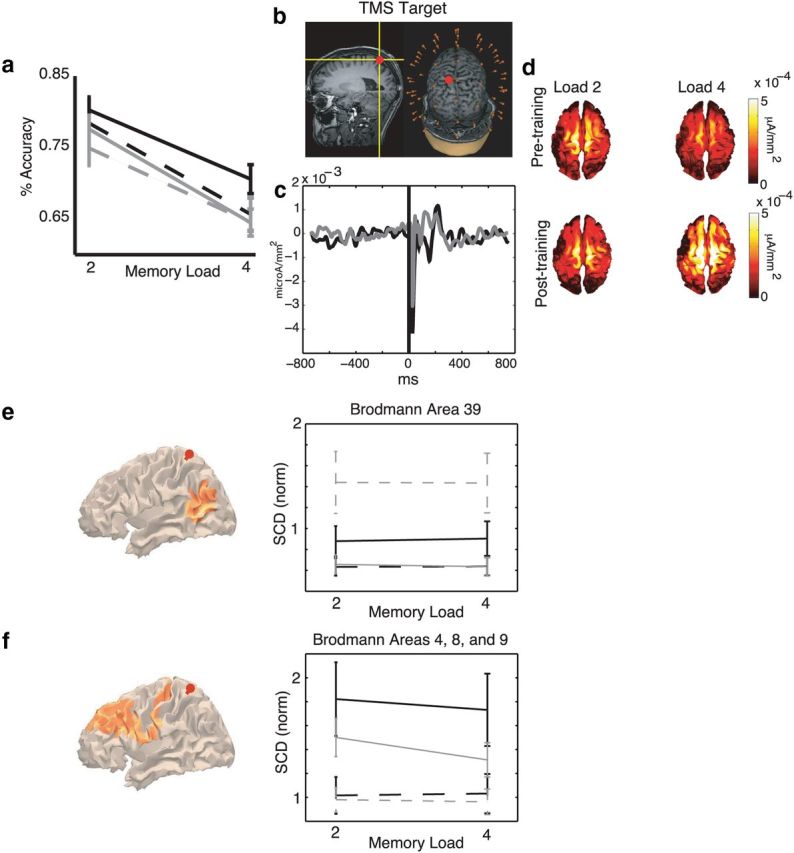
WM training effects on behavior and task-related effective connectivity. a, Behavioral performance on location VSTM task (Table 1). Experimental (black; N = 12); control (gray; N = 14). Hyphenated lines indicate pretraining, and solid lines indicate post-training. Error bars indicate ± SEM. b, TMS was targeted to left SPL of each subject using MRI-guided stereotaxy (red dot). c, The pretraining TMS-evoked response is shown for left SPL, data collapsed across task conditions; experimental (black); control (gray). d, SCD plotted on the cortical mesh of a representative experimental subject, derived from averaging SCD >10–500 ms after TMS. SCD plotted as a function of load and session. e, Orange on brain images represents regions showing WM training-specific changes (Group × Session interaction, p < 0.05) in delay period effective connectivity (SCD) with the left SPL (red pin is the site of TMS). Data plots show SCD (normalized by pretraining SCD over both groups) averaged over both hemispheres and brain regions shown in orange. Experimental (black, N = 12); control (gray, N = 10); pretraining (dashed), post-training (solid); error bars indicate ± SEM. f, Brain regions showing a Group × Session × Load interaction effect (in orange, p < 0.05), and associated data plot; same conventions as in e.
Load-specific increases in effective connectivity
In three frontal areas (BAs 4, 8, and 9), interactions of Group × Session × Load reflected the fact that the selective increase of effective connectivity was specific to load 4 (BA 4, p = 0.050; BA 8, p = 0.013; and BA 9, p = 0.038; Fig. 3f; Table 3). Follow-up, pairwise comparisons indicated that these areas showed a significant increase in SCD in the experimental group at load 4 and load 2 (for BA 4, load 2, t(11) = −3.31, p = 0.001; and load 4, t(11) = −3.13, p = 0.002; for BA 8, load 2, t(11) = −2.47, p = 0.017; and load 4, t(11) = −3.01, p = 0.004; and for BA 9, load 2, t(11) = −4.01, p = 0.0002; and load 4: t(11) = −3.76, p = 0.0004). Control group pairwise comparisons were also generally significant between sessions, but less so for load 4 versus load 2 (for BA 4, load 2, t(11) = −2.32, p = 0.026; and load 4, t(11) = −1.30, p = 0.201; for BA 8, load 2, t(11) = −3.17, p = 0.002; and load 4, t(11) = −1.39, p = 0.170; and for BA 9, load 2, t(11) = −4.08, p = 0.0002; and load 4, t(11) = −2.16, p = 0.037). No such effect was seen in the control area (BA 10).
Effective connectivity versus excitability
Confirmation that the effects reported here were attributable to changes in effective connectivity, and not merely cortical excitability, comes from examination of their time course. In the context of simultaneous TMS/EEG, Huber et al. (2013) have operationalized increases in cortical excitability as an increase in the magnitude of the TMS-evoked response observed immediately (i.e., within the first 0–10 ms) after TMS and directly under the coil. Increased effective connectivity, on the other hand, would be expected to manifest as stronger TMS-evoked effects at distal sites from about 10 to 400 ms after TMS, when (and where) the effects of the pulse reaches these sites. In our data, there was a significant Group × Session × Load interaction in global SCD from 100 to 150 ms (F(1,20) = 4.99, p = 0.037) and marginally significant interaction effects from 150 to 200 ms (F(1,20) = 3.75, p = 0.067). Importantly, there was no such interaction from 0 to 20 ms (F(1,20) = 0, not significant).
There was no significant correlation between training-related changes in effective connectivity and performance improvement on the location VSTM task that differed between groups. Additionally, there was no significant correlation between training gain and change in SCD across ROIs.
Effects of training on ERP measures of VSTM and selective attention
Behavior
Color-in-location VSTM.
We observed a pattern of statistically improved performance for the experimental group, not for the control group, but no statistical difference between the two (i.e., no interaction of Group × Session). This was accompanied, however, by significant, and striking, differences between conditions in the ERP data. To summarize the behavioral findings, WM training increased K within the experimental group (t(12) = −1.99, p = 0.03, one-sided), but not the control group (t(14) = −0.98, p = 0.17); no significant Group × Session interaction (Fig. 4a). Further, the magnitude of the training gain predicted the change in VSTM capacity for the experimental (r(12) = 0.65, p = 0.01, two-sided) but not the control (r(13) = 0.30, p = 0.27, two-sided) group, although, again, there was no significant difference in correlations between groups (Figs. 2, 4b).
Figure 4.

Pretraining and post-training color-in-location VSTM task results. a, Performance (K estimate) on delayed recognition of color-in-location VSTM improved within the experimental group (black; N = 13) but not the control group (gray; N = 15). Error bars indicate ± SEM. b, Significant correlation between change in K and training gain within the experimental group (black; N = 13; black regression line; p < 0.05). No such effect was found within the control (gray; N = 15) group.
Visual search.
As with the color-in-location VSTM task, transfer of WM training was also observed with an ERP correlate of visual search. At the level of behavior, both experimental and control training improved search efficiency (Table 4).
ERP
CDA
Pretraining CDA amplitude (individually testing loads 2, 4, and 6 CDA amplitudes) did not differ significantly between groups for the load 2 (F(1,18) = 0.67, p = 0.42) and load 6 (F(1,18) = 1.63, p = 0.22) conditions but did for load 4 (F(1,18) = 3.74, p = 0.07) condition. The interpretation of these data will be discussed further along. WM training transferred to VSTM as a reduction of the CDA amplitude (Fig. 5a,b; random effects ANOVA: main effect of load F(1,18) = 6.82, p = 0.02; group × session interaction F(1,18) = 12.92, p = 0.002; group × session × load interaction F(1,18) = 6.92, p = 0.02), with these effects driven by a pretraining to post-training decrease in the load 4 CDA amplitude within the experimental group (t(9) = −3.88, p = 0.003, two-sided), trending effect within the control group (t(8) = 1.82, p = 0.10, two-sided). There was no significant effect of training on the load 6 CDA amplitude, nor were there significant correlations between change in K and change in CDA or gain and change in CDA within either group.
Figure 5.
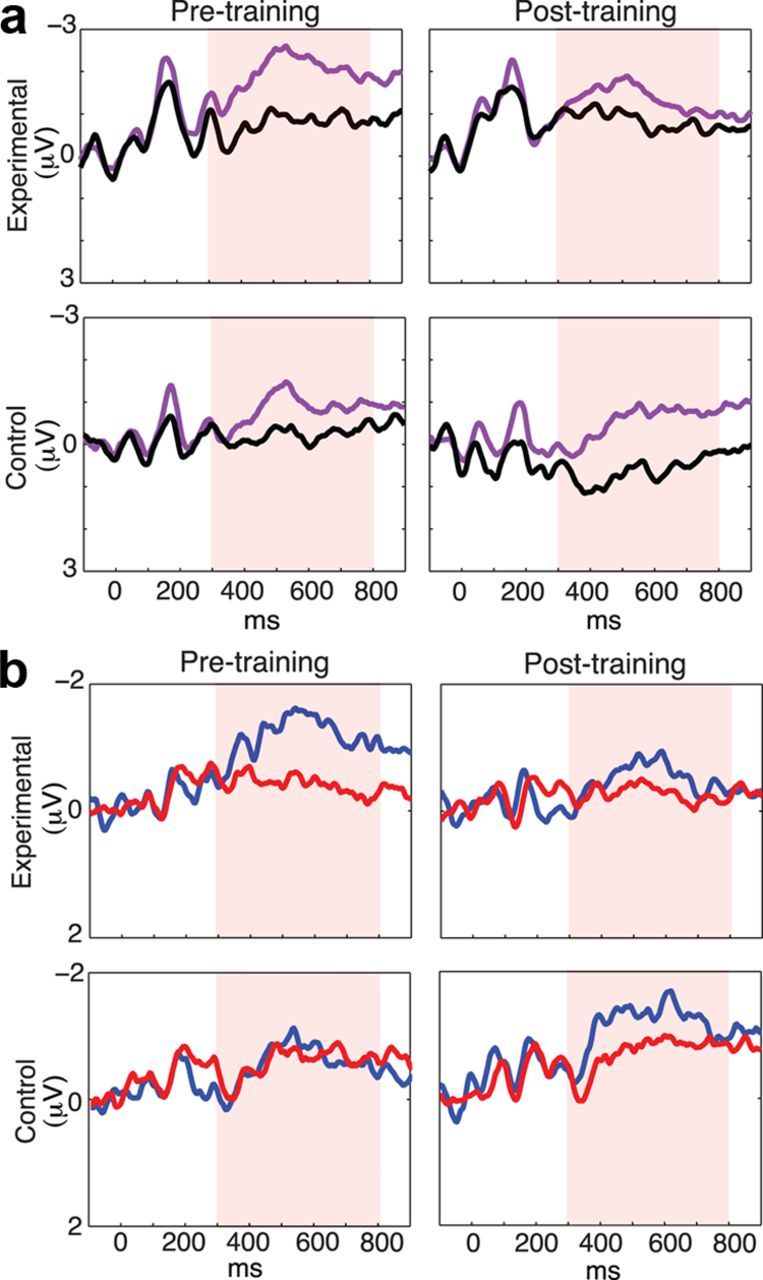
WM training transfer to CDA from color-in-location VSTM task. In all figures, stimulus presentation at 0 ms, negative voltage plotted up. a, Lateralized traces from waveforms contralateral versus ipsilateral to cued stimuli, load 4, averaged over P3/4, P5/6, and P7/8 channels. Purple represents contralateral waveforms; black, ipsilateral waveforms. b, Difference waves (contralateral − ipsilateral) for the experimental and control groups for pretraining and post-training. Blue represents load 4; red, load 2.
To strengthen our interpretation of the CDA effects, we considered two alternative factors that can attenuate the CDA: slow horizontal drift of the eyes toward the to-be-attended visual field and increased variance in overall levels of attention. The former possibility was ruled out with analyses of traces from channels near the eyes. The latter was ruled out by assessing the N2pc ERP component, derived from 200 to 275 ms after stimulus, which yielded no significant Group × Session × Load effect (F(1,18) = 3.53, p = 0.08). A third factor known to produce attenuation of the CDA is an increased reliance, across trials, on long-term memory for the search target (Carlisle et al., 2011). This is unlikely for the present data, however, because memoranda in our tasks varied trial by trial. Note that the CDA accompanying search in Carlisle et al. (2011) was derived from a delay separating target and search array, unlike the present study, in which the CSA was derived from the EEG signal during search.
CSA
Pretraining measures of the ERP correlate of visual search, the CSA, did not differ between groups (t(13) = 0.16, p = 0.88). Neural transfer effects, however, in the form of a training-related decrease in the CSA, were specific to the experimental group: on target-absent trials, experimental versus control training produced a decrease in the CSA amplitude (Group × Session interaction, F(1,12) = 4.84, p = 0.05; Fig. 6a,b). Follow-up pairwise comparisons showed a trending difference in pretraining versus post-training CSA amplitude for the experimental group (t(6) = −2.27, p = 0.06, two-sided), and no effect for the control group CSA (t(7) = 0.53, p = 0.61, two-sided). Individual differences in this effect were predicted by the analogous effect in the VSTM-derived CDA (Fig. 6c). Specifically, for channel P7/P8, there was a significant correlation between change in CSA amplitude for 8-item display and CDA amplitude for load 4 versus load 2 conditions for the experimental (r(5) = 0.80, p = 0.03, two-sided), but not for the control (r(6) = 0.21, p=0.62, two-sided), group; no significant difference between correlations. (The same qualitative pattern was seen when the correlation was computed with load 4 CDA only.) There was no significant correlation between training gain and training-related change in CSA amplitude.
Figure 6.
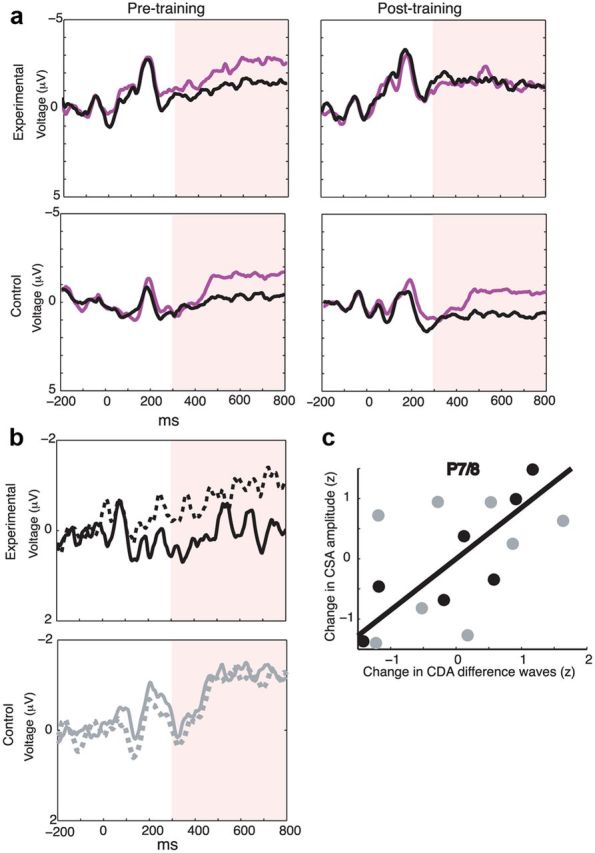
WM training transfer to CSA from visual search. a, Contralateral and ipsilateral waveforms for the 8-item search condition. Average of same electrodes as Figure 5. Purple represents contralateral waveforms; black, ipsilateral waveforms. b, Significant reduction in CSA amplitude for 8-item, target-absent condition for experimental (black), but not control (gray) group. Post-training versus pretraining comparison done within 300–800 ms window (same as CDA comparison; Fig. 5). Hyphenated lines indicate pretraining; solid lines, post-training. c, Correlation between change in CSA amplitude for 8-item display and CDA amplitude for load 4 versus load 2 conditions for the experimental group (black; black regression line) and the control group (gray). Data from channel P7/P8.
Effects of training on psychometric tasks
Both groups improved, in terms of accuracy and RT, on the DD and TD variants of the location VSTM task (Fig. 1d,e; Table 5). Notably, there was also an absence of WM training transfer to tests of complex WM span (Operation Span), fluid intelligence (RAPM), and control of response conflict (Stroop task) (Table 6).
Discussion
The aim of the present study was to investigate the neural bases of WM training effects, and of their transfer to untrained tasks. We trained an experimental group of subjects on an adaptive, visuospatial n-back task that has been shown to improve performance on other WM tasks, as well as on tests of fluid intelligence (Jaeggi et al., 2008) and of reading comprehension (Chein and Morrison, 2010). Concurrently, we trained a control group on an adaptive, visuospatial task with no WM component (Tetris). n-back task performance engages frontoparietal brain areas (Owen et al., 2005), and training on updating tasks has been shown to decrease functional MRI activation in frontoparietal brain areas (Dahlin et al., 2008). Training on spatial span tasks has shown increases in functional MRI activation in frontoparietal areas (Olesen et al., 2004). Thus, we hypothesized that adaptive n-back training would influence performance on untrained tasks via changes in task-related effective connectivity in these frontoparietal circuits, and between them and extrastriate regions involved with visuospatial stimulus processing. We estimated changes in effective connectivity with EEG measures of the response to single pulses of TMS, delivered to SPL, during the delay period of a VSTM task. We also investigated training-related effects on an established ERP marker of VSTM, the CDA.
Our results revealed that intensive training on a WM task improved performance on the most difficult condition of a test of spatial VSTM (on which subjects had not been trained), and that this effect was supported by the strengthening of task-related effective connectivity across frontoparietal and parieto-occipital networks. The precise pattern of effects differed regionally as a function of whether the region in question received primarily feedback or feedforward connections from SPL. The former, which are regions associated with the short-term retention of visuospatial stimulus representations (Postle, 2006), showed across-the-board increases in effective connectivity. The latter, primarily components of the frontoparietal control network, showed this increase only on suprathreshold load 4 trials, the trials for which demands on control were highest. Because training-related changes in SCD were found only during load 4 conditions, which were randomly interleaved with load 2 trials, this effect did not reflect a structural, long-term strengthening of neural circuits. Rather, it reflected a dynamic, trial-specific alteration in the efficacy of the propagation of the TMS-evoked signal (consistent with previous observations) (Johnson et al., 2012). We speculate that trial-specific, dynamic changes in neural coupling, as may be implemented by dynamic changes in oscillatory synchrony (Uhlhaas et al., 2009), could underlie this effect.
Our finding that the WM training-related increase in K was accompanied by a decrease in the magnitude of the CDA within the experimental group was in the opposite direction of our a priori prediction. One possible explanation for this finding is that WM training may have increased the efficiency with which attentional resources can be allocated to VSTM. Although the marginally significant pretraining difference in CDA amplitude between groups at load 4 potentially complicates the interpretation of the effects of training on the CDA, our confidence with our interpretation is bolstered by the fact that the effect of training on the CDA was replicated in the CSA, the data of which were not complicated by the same pretraining difference. Crucially, the CSA is thought to index the same resources as the CDA (Emrich et al., 2009; Luria and Vogel, 2011). Further, individual differences in the effect of WM training on the CDA predicted individual differences of the effect of WM training on the CSA. This relationship did not exist for the control group, although the difference between the experimental versus the control correlation fell short of statistical significance. In support of this efficiency hypothesis, others have suggested that training on an n-back task increases the capacity of the focus of attention, measured behaviorally using RT improvement on a modified n-back task (Verhaeghen et al., 2004) and running span performance (Lilienthal et al., 2012). Other accounts propose the CDA to be a reflection of modulation in underlying oscillations in the α frequency band and that it may therefore be a marker of some more general physiological state (e.g., excitability or inhibition), rather than a marker of memory maintenance per se (van Dijk et al., 2010). Further research will be needed to determine whether the present findings have implications for theories of VSTM capacity limitations (Bays and Husain, 2008; Zhang and Luck, 2008).
The transfer of WM training to the CSA implies that the observed effects of WM training are attributable to neither task-specific strategies (such as chunking, Ericsson et al., 1980) nor changes in the manner in which task-specific stimuli are represented by primary visual and extrastriate cortex, which can be the case with low-level perceptual training (Jehee et al., 2012). The specificity of behavioral transfer of WM training relative to control training was stronger for the color-in-location VSTM task than for visual search. This may reflect the fact that visual search shares common attentional demands with the control training task in addition to with the n-back task. This observation highlights the importance of process analysis in the selection of an active control task (Shipstead et al., 2012). Nonetheless, the neural transfer of WM training to an overtly attentional task is consistent with the idea that these theoretically separate constructs share some common neural mechanisms (Postle et al., 2004, Nobre and Stokes, 2011). Furthermore, training-related far transfer effects may be contingent on the degree to which the training task and transfer task share common neural architectures.
WM training-related behavioral improvement in VSTM paralleled by a reduction in the magnitude of sustained VSTM-related neural activity (the CDA) suggests that training may alter the efficiency with which task-relevant networks process stimulus information, as is thought to be the case with reduction in BOLD activity seen with expert/high ability versus novice/low ability comparisons across cognitive domains (Rypma and D'Esposito, 2000; Bavelier et al., 2011). The underlying neural basis of this efficiency seems to lie at the network level, through increased effective connectivity between task-relevant brain areas. These findings suggest that the extent to which two behaviors share neurocognitive systems and/or processes may predict the extent to which the effects of training on one will transfer to the other.
Footnotes
This work was supported by National Institute of Mental Health Grant MH095428 to B.K. and Grant MH064498–05 to B.R.P. We thank Dr. Jeffrey S. Johnson for comments and guidance regarding the study design.
The authors declare no competing financial interests.
References
- Bavelier D, Achtman RL, Mani M, Föcker J. Neural bases of selective attention in action video game players. Vision Res. 2012;61:132–143. doi: 10.1016/j.visres.2011.08.007. [DOI] [PMC free article] [PubMed] [Google Scholar]
- Bays PM, Husain M. Dynamic shifts of limited working memory resources in human vision. Science. 2008;321:851–854. doi: 10.1126/science.1158023. [DOI] [PMC free article] [PubMed] [Google Scholar]
- Carlisle NB, Arita JT, Pardo D, Woodman GF. Attentional templates in visual working memory. J Neurosci. 2011;31:9315–9322. doi: 10.1523/JNEUROSCI.1097-11.2011. [DOI] [PMC free article] [PubMed] [Google Scholar]
- Casali AG, Casarotto S, Rosanova M, Mariotti M, Massimini M. General indices to characterize the electrical response of the cerebral cortex to TMS. Neuroimage. 2010;49:1459–1468. doi: 10.1016/j.neuroimage.2009.09.026. [DOI] [PubMed] [Google Scholar]
- Casarotto S, Romero Lauro LJ, Bellina V, Casali AG, Rosanova M, Pigorini A, Defendi S, Mariotti M, Massimini M. EEG responses to TMS are sensitive to changes in the perturbation parameters and repeatable over time. PLoS One. 2010;5:e10281. doi: 10.1371/journal.pone.0010281. [DOI] [PMC free article] [PubMed] [Google Scholar]
- Chein JM, Morrison AB. Expanding the mind's workspace: training and transfer effects with a complex working memory span task. Psychonom Bull Rev. 2010;17:193–199. doi: 10.3758/PBR.17.2.193. [DOI] [PubMed] [Google Scholar]
- Corbetta M, Shulman GL. Control of goal-directed and stimulus-driven attention in the brain. Nat Rev Neurol. 2002;3:201–215. doi: 10.1038/nrn755. [DOI] [PubMed] [Google Scholar]
- Cowan N. The magical number 4 in short-term memory: a reconsideration of mental storage capacity. Behav Brain Sci. 2001;24:87–114. doi: 10.1017/s0140525x01003922. discussion 114–185. [DOI] [PubMed] [Google Scholar]
- Cusack R, Lehmann M, Veldsman M, Mitchell DJ. Encoding strategy and not visual working memory capacity correlates with intelligence. Psychonom Bull Rev. 2009;4:641–647. doi: 10.3758/PBR.16.4.641. [DOI] [PMC free article] [PubMed] [Google Scholar]
- Dahlin E, Neely AS, Larsson A, Bäckman L, Nyberg L. Transfer of learning after updating training mediated by the striatum. Science. 2008;320:1510–1512. doi: 10.1126/science.1155466. [DOI] [PubMed] [Google Scholar]
- Delorme A, Makeig S. EEGLAB: an open source toolbox for analysis of single-trial EEG dynamics including independent component analysis. J Neurosci Methods. 2004;134:9–21. doi: 10.1016/j.jneumeth.2003.10.009. [DOI] [PubMed] [Google Scholar]
- Emrich SM, Al-Aidroos N, Pratt J, Ferber S. Visual search elicits the electrophysiological marker of visual working memory. PLoS One. 2009;4:1–9. doi: 10.1371/journal.pone.0008042. [DOI] [PMC free article] [PubMed] [Google Scholar]
- Emrich SM, Al-Aidroos N, Pratt J, Ferber S. Finding memory in search: the effect of visual working memory load on visual search. Q J Exp Psychol. 2010;63:1457–1466. doi: 10.1080/17470218.2010.483768. [DOI] [PubMed] [Google Scholar]
- Ericcson KA, Chase WG, Faloon S. Acquisition of a memory skill. Science. 1980;208:1181–1182. doi: 10.1126/science.7375930. [DOI] [PubMed] [Google Scholar]
- Ferrarelli F, Massimini M, Sarasso S, Casali A, Riedner BA, Angelini G, Tononi G, Pearce RA. Breakdown in cortical effective connectivity during midazolam-induced loss of consciousness. Proc Natl Acad Sci U S A. 2010;107:2681–2686. doi: 10.1073/pnas.0913008107. [DOI] [PMC free article] [PubMed] [Google Scholar]
- Hamidi M, Tononi G, Postle BR. Evaluating the role of prefrontal and parietal cortices in memory-guided response with repetitive transcranial magnetic stimulation. Neuropsychologia. 2009;47:295–302. doi: 10.1016/j.neuropsychologia.2008.08.026. [DOI] [PMC free article] [PubMed] [Google Scholar]
- Huber R, Mäki H, Rosanova M, Casarotto S, Canali P, Casali A, Tononi G, Massimini M. Human cortical excitability increases with time awake. Cereb Cortex. 2013;23:332–338. doi: 10.1093/cercor/bhs014. [DOI] [PMC free article] [PubMed] [Google Scholar]
- Jaeggi SM, Buschkuehl M, Jonides J, Perrig WJ. Improving fluid intelligence with training on working memory. Proc Natl Acad Sci U S A. 2008;105:6829–6833. doi: 10.1073/pnas.0801268105. [DOI] [PMC free article] [PubMed] [Google Scholar]
- Jaeggi SM, Buschkuehl M, Jonides J, Shah P. Short- and long-term benefits of cognitive training. Proc Natl Acad Sci U S A. 2011;108:10081–10086. doi: 10.1073/pnas.1103228108. [DOI] [PMC free article] [PubMed] [Google Scholar]
- Jehee JF, Ling S, Swisher JD, van Bergen RS, Tong F. Perceptual learning selectively refines orientation representations in early visual cortex. J Neurosci. 2012;32:16747–16753. doi: 10.1523/JNEUROSCI.6112-11.2012. [DOI] [PMC free article] [PubMed] [Google Scholar]
- Johnson JS, Kundu B, Casali AG, Postle BR. Task-dependent changes in cortical excitability and effective connectivity: a combined TMS-EEG study. J Neurophysiol. 2012;107:2383–2392. doi: 10.1152/jn.00707.2011. [DOI] [PMC free article] [PubMed] [Google Scholar]
- Koenigs M, Barbey AK, Postle BR, Grafman J. Superior parietal cortex is critical for the manipulation of information in working memory. J Neurosci. 2009;29:14980–14986. doi: 10.1523/JNEUROSCI.3706-09.2009. [DOI] [PMC free article] [PubMed] [Google Scholar]
- Lilienthal L, Tamez E, Shelton JT, Myerson J, Hale S. Dual N-back training increases the capacity of the focus of attention. Psychon Bull Rev. 2013;20:135–141. doi: 10.3758/s13423-012-0335-6. [DOI] [PubMed] [Google Scholar]
- Luck SJ, Vogel EK. The capacity of visual working memory for features and conjunctions. Nature. 1997;390:279–281. doi: 10.1038/36846. [DOI] [PubMed] [Google Scholar]
- Luria R, Vogel EK. Visual search demands dictate reliance on working memory storage. J Neurosci. 2011;31:6199–6207. doi: 10.1523/JNEUROSCI.6453-10.2011. [DOI] [PMC free article] [PubMed] [Google Scholar]
- Machizawa MG, Driver J. Principal component analysis of behavioral individual differences suggests that particular aspects of visual working memory may relate to specific aspects of attention. Neuropsychologia. 2011;49:1518–1526. doi: 10.1016/j.neuropsychologia.2010.11.032. [DOI] [PubMed] [Google Scholar]
- Newell A, Rosenbloom PS. Mechanisms of skill acquisition and the law of practice. In: Anderson JR, editor. Cognitive skills and their acquisition. Hillsdale, NJ: Lawrence Erlbaum; 1980. pp. 1–51. [Google Scholar]
- Nobre AC, Stokes MG. Attention and short-term memory: crossroads. Neuropsychologia. 2011;49:1391–1392. doi: 10.1016/j.neuropsychologia.2011.04.014. [DOI] [PubMed] [Google Scholar]
- Olesen PJ, Westerberg H, Klingberg T. Increased prefrontal and parietal activity after training of working memory. Nat Neurosci. 2004;7:75–79. doi: 10.1038/nn1165. [DOI] [PubMed] [Google Scholar]
- Owen AM, McMillan KM, Laird AR, Bullmore E. N-back working memory paradigm: a meta-analysis of normative functional neuroimaging studies. Hum Brain Mapp. 2005;25:46–59. doi: 10.1002/hbm.20131. [DOI] [PMC free article] [PubMed] [Google Scholar]
- Pashler H. Familiarity and visual change detection. Percept Psychophys. 1988;44:369–378. doi: 10.3758/BF03210419. [DOI] [PubMed] [Google Scholar]
- Postle BR. Working memory as an emergent property of the mind and brain. Neuroscience. 2006;139:23–38. doi: 10.1016/j.neuroscience.2005.06.005. [DOI] [PMC free article] [PubMed] [Google Scholar]
- Postle BR, Awh E, Jonides J, Smith EE, D'Esposito M. The where and how of attention-based rehearsal in spatial working memory. Brain Res Cogn Brian Res. 2004;20:194–205. doi: 10.1016/j.cogbrainres.2004.02.008. [DOI] [PubMed] [Google Scholar]
- Raven J, Court J. Section 1: General overview. San Antonio, TX: Harcourt Assessment; 2003. Manual for Raven's progressive matrices and vocabulary scales. [Google Scholar]
- Rypma B, D'Esposito M. Isolating the neural mechanisms of age-related changes in human working memory. Nat Neurosci. 2000;3:509–515. doi: 10.1038/74889. [DOI] [PubMed] [Google Scholar]
- Shipstead Z, Redick TS, Engle RW. Is working memory training effective? Psychol Bull. 2012;138:628–654. doi: 10.1037/a0027473. [DOI] [PubMed] [Google Scholar]
- Stroop JR. Studies of interference in serial verbal reactions. J Exp Psychol. 1935;18:643–662. doi: 10.1037/h0054651. [DOI] [Google Scholar]
- Takeuchi H, Sekiguchi A, Taki Y, Yokoyama S, Yomogida Y, Komuro N, Yamanouchi T, Suzuki S, Kawashima R. Training of working memory impacts structural connectivity. J Neurosci. 2010;30:3297–3303. doi: 10.1523/JNEUROSCI.4611-09.2010. [DOI] [PMC free article] [PubMed] [Google Scholar]
- Uhlhaas PJ, Pipa G, Lima B, Melloni L, Neuenschwander S, Nokolic D, Singer W. Neural synchrony in cortical networks: history, concept, and current status. Front Integr Neurosci. 2009;3:1–17. doi: 10.3389/neuro.07.017.2009. [DOI] [PMC free article] [PubMed] [Google Scholar]
- Unsworth N, Heitz RP, Schrock JC, Engle RW. An automated version of the operation span task. Behav Res Methods. 2005;37:498–505. doi: 10.3758/BF03192720. [DOI] [PubMed] [Google Scholar]
- van Dijk H, van Der Werf J, Mazaheri A, Medendorp WP, Jensen O. Modulations in oscillatory activity with amplitude asymmetry can produce cognitively relevant event-related responses. Proc Natl Acad Sci U S A. 2010;107:900–905. doi: 10.1073/pnas.0908821107. [DOI] [PMC free article] [PubMed] [Google Scholar]
- Verhaeghen P, Cerella J, Basak C. A working memory workout: how to expand the focus of serial attention from one to four items in 10 hours or less. J Exp Psychol Learn Mem Cogn. 2004;30:1322–1337. doi: 10.1037/0278-7393.30.6.1322. [DOI] [PubMed] [Google Scholar]
- Vogel EK, Machizawa MG. Neural activity predicts individual differences in visual working memory capacity. Nature. 2004;428:748–751. doi: 10.1038/nature02447. [DOI] [PubMed] [Google Scholar]
- Yantis S, Serences JT. Cortical mechanisms of space-based and object-based attentional control. Curr Opin Neurobiol. 2003;13:187–193. doi: 10.1016/S0959-4388(03)00033-3. [DOI] [PubMed] [Google Scholar]
- Zhang W, Luck SJ. Discrete fixed-resolution representations in visual working memory. Nature. 2008;453:233–235. doi: 10.1038/nature06860. [DOI] [PMC free article] [PubMed] [Google Scholar]