Abstract
The photodegradation of parathion, a US EPA Contaminant Candidate List pesticide, in aqueous solutions by UV and UV/H2O2 processes in batch reactors was evaluated. Direct photolysis of parathion both by LP (low pressure) and MP (medium pressure) lamps at pH 7 were very slow with quantum yields of 6.67 ± 0.33 ×10⁻⁴ and 6.00 ± 1.06 ×10⁻⁴ mol E−1, respectively. Hydrogen peroxide enhanced the photodegradation of parathion through the reaction between UV generated hydroxyl radical and parathion with a second-order reaction rate constant of 9.70 ± 0.45×10⁹ M−1 s−1. However, addition of hydrogen peroxide did not result in a linear increase in the degradation rate. An optimum molar ratio between hydrogen peroxide and parathion was determined to be between 300 – 400. Photodegradation of parathion yielded several organic byproducts, of which the paraoxon, 4-nitrophenol, O,O,O-triethyl thiophosphate and O,O diethyl-methyl thiophosphate were quantified and their occurrence during UV/H2O2 processes were discussed. NO2−, PO43−, NO3− and SO42− were the major anionic byproducts of parathion photodegradation and their recover ratio were also discussed. A photodegradation mechanism scheme suggesting three simultaneous pathways was proposed in the study.
Keywords: Parathion, Photolysis, Byproduct, Degradation mechanism
Introduction
Parathion (O,O-diethyl-O-4-nitro-phenyl thiophosphate) has been one of the most widely applied organophosphorus insecticides in agriculture in the past decades, and has been frequently detected in surface water and groundwater at concentrations of ng/L to µg/L levels, with a highest reported concentration of 0.1 mg/L (Doong and Chang, 1998; Kiely et al., 2004). Parathion is of great public health concern because it is associated with acute toxicity to mammals through the inhibition of the enzyme acetylcholinesterase (AChE) in the nervous system with an oral LD50 of 2–30 and 3–5 mg/Kg in rats and dogs, respectively. It has moderate toxicity to aquatic invertebrates with a 96-hr LC50 of 1.43 mg/L (Meister, 1992). Parathion has been classified as an acutely toxic pesticide by US EPA (US EPA, 1999) and listed as ‘extremely hazardous’ by the World Health Organization (WHO). Although parathion has been banned in many developed countries like the USA due to its high toxicity (US EPA, 2000), the use of parathion continues in many other developing countries including China, where the application of parathion is still legal for crops other than vegetables, fruits, teas or herbal medicines (China, 2007).
The fate of parathion in the environment has been intensively investigated in recent years. Parathion is relatively water soluble (24 mg/L at 25°C) (Sakellarides et al., 2003) and has a log Kow (octanol-water partition coefficient) of 3.83 and vapor pressure of 5.32 mPa, which suggests parathion is rather persistent in soil (Meister, 1992). Hydrolysis, microbial degradation and photolysis are the major degradation pathways for parathion in the environment. The hydrolysis of parathion was studied by Gomaa and Faust (1972) who reported that pH plays an important role affecting the degradation rate. The half-life of parathion due to hydrolysis was reported to be between 54 d (pH 9.1) and 555 d (pH 3.1). Other studies also found that parathion is relatively resistant with a half-live of 130 d at pH 7.4 (Freed et al., 1979), or 16% reduction in 40 d (Sharom et al., 1980). However, Rotich et al. (2004) found that hydrolysis is one of the controlling pathways with a short half-life between 2.3 and 4.8 d, and higher hydrolysis rates were observed at higher pH values.
Photodegradation is an important process in the destruction of organic pollutants such as parathion in water and wastewaters. Several researchers have studied parathion photodegradation in different matrices, but their results significantly differed from each other with regard to reaction mechanisms and formation of byproducts (Grunwell and Erickson 1973; Mok et al., 1987; Sakellarides et al., 2003; Santos et al., 2005). The quantum yield at 254nm had been reported to be 6×10⁻⁴ mol E−1 (Mok et al., 1987) while for a medium pressure lamp it was reported between 0.006 and 0.053 mol E−1 (Chen et al., 1998). TiO2 and H2O2 were found to enhance the degradation of parathion. Controversial results regarding the role of humic substance in the photolysis of parathion were also reported by Sakellarides et al., (2003), who illustrated that humic substances significantly altered the degradation kinetics, while Santo et al., (2005), found humic substances had little effect on parathion photodegradation.
Advanced oxidation processes (AOP) have been proposed as an effective treatment method for organic contaminants in water and wastewaters. Among them, UV/H2O2 has shown great potential for the destruction of a wide range of persistent organic chemicals. The UV/H2O2 process comprises direct photolysis, where the target compound is transformed through absorbing UV photons, and indirect photolysis, where the compounds react with OH radical produced via photolysis of H2O2. Whereas the direct photolysis rate is controlled by two factors, i.e., the molar absorption coefficient and the quantum yield, indirect photodegradation rate depends on the formation of oxidant species, i.e. the hydroxyl radical, and radical scavengers in the background water.
In this study, photodegradation of parathion both by direct UV and the UV/H2O2 oxidation process were investigated. The objectives of this study were to: i) elucidate the parathion photodegradation kinetics, and ii) understand the degradation mechanism through the analysis of various byproducts. Both low pressure (LP) lamps, which emit monochromatic UV irradiation at 254nm, and medium pressure (MP) lamps, which emit UV irradiation broadly between 200 and 400 nm, were evaluated.
Experimental Details
Chemicals and reagents
Parathion (C10H17O2PS3, 99.2%), paraoxon (98.5%), 4-nitrophenol (99%), O,O,O-triethyl phosphothiaote (98.5%) and O,O diethyl-methyl-thiophosphate (98%) were purchased from Chem Serv Co. Ltd., and used without further purification; Hydrogen peroxide(30% w/w) was obtained from VWR (USA). HPLC grade acetonitrile and water were obtained from Fisher, NJ, USA. All solutions were prepared with de-ionized water (18M milli-Q system) unless otherwise mentioned. All other reagents were analytical grade and were used without further treatment.
Due to the low water solubility of parathion, a 10 mM stock solution was prepared in methanol and stored in the dark at 4°C. The concentration of the stock solution was checked periodically to ensure there was no detectable change due to evaporation or decay of parathion. To prepare working solutions for experiments, a small amount of stock solution was added to a volumetric flask, within which methanol was gently evaporated out with a nitrogen stream. The flask was filled with either 20 mM phosphate buffer solutions or DI water to the mark. These working solutions were subsequently stirred overnight to allow dissolution of parathion into the waters.
Photolysis experiments
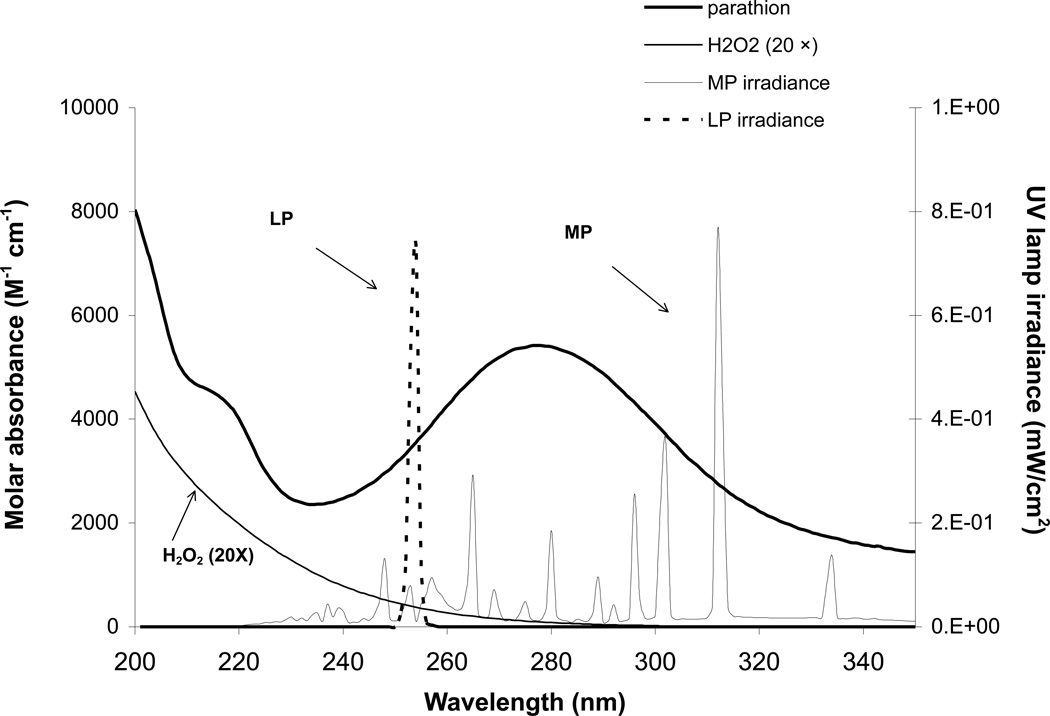
Photodegradation experiments were carried out in two collimated-beam bench reactors previously described (Shemer and Linden, 2006; Wu et al., 2007). The low pressure UV reactor is configured with four low pressure vapor germicidal lamps (ozone-free, General Electric No. G15T8), which essentially emit monochromatic light at 254 nm. The MP reactor consists of a 15W medium pressure mercury lamp (Hanovia Co., Union, NJ) that emits at various wavelengths ranging from 200nm to above 400nm (Fig. 1).
Fig. 1.
Molar absorption spectra of parathion and hydrogen peroxide (20×) (left axis), and UV emission spectra of LP and MP lamps (right axis)
In a typical photolysis experiment, the working solution (120 mL) was placed in a 70 × 50 mm crystallization dish (surface area is 34.2 cm2 and solution depth is 3.51 cm) and exposed to UV irradiation. The solution was continuously homogenized with a stir bar to ensure completely mixed batch conditions. Incident irradiance was determined by a calibrated radiometer (IL1700, SED 240/W, International Light, Peabody, MA) and delivered UV fluence was determined as calculated with a spreadsheet program that includes lamp spectrum, solution absorbance, exposure time and incident irradiance according to Schwarzenbach et al., (2003). At specific delivered UV fluence intervals, a 0.6 mL sample aliquot was taken with a syringe and transferred into HPLC vials. A maximum of 3 mL were removed throughout each exposure experiment, thus minimally affecting the solution volume and depth. Each experiment was performed twice to assess the repeatability of the data. Hydrogen peroxide assisted photodegradation was conducted by adding 5 to 50 mg/L H2O2 from a 30% stock solution right before irradiation. 0.02mg/L catalase was added to samples for quenching the residual hydrogen peroxide. In case of competition kinetics experiments, measured amounts of nitrobenzene were added into the working solutions right before irradiation.
Dark control experiments were conducted under an identical experimental setup without UV exposure. No loss of parathion due to volatilization and/or hydrolysis during the short experimental period was observed.
Analytical methods
Solution absorbance spectra were measured using a UV spectrophotometer- Cary Bio100 (Varian, Inc., Palo Alto, CA). Total organic carbon was measured by a Tekmar Dohrmann Apollo 9000 Total Carbon Analyzer in accordance with Standard Method 5310 A. Residual H2O2 was determined by the I3− method (Klassen et al., 1994).
A Varian Pro Star HPLC (Varian, Inc., Palo Alto, CA) equipped with a polychromatic diode array detector and C18 reverse phase column (4.6 × 150 mm) (Alltech Associates Inc. Deerfield, IL) was used to monitor the concentrations of parathion and nitrobenzene by direct injection (50 µL). Isocratic elution was used with a mobile phase of acetonitrile and water (60/40 v/v) at a flow rate of 1 mL min−1. Under the conditions described above the retention times (RT) were 12.0 and 4.6 minutes for parathion and nitrobenzene, respectively.
In order to identify parathion degradation byproducts, aqueous samples after UV treatment were extracted using solid-phase extraction (SPE). The SPE process was conducted by passing 100 mL of sample through a Varian Abselut Nexus cartridge (C18, 100mg) at flow rate of 2 mL/min. The cartridge was then washed twice with 5 mL of methanol. The methanol extract was collected and concentrated to about 0.5 mL by evaporation with nitrogen and re-dissolved in dichloromethane before being analyzed by gas chromatography/electron impact mass spectrometry (GC/EI-MS). The identification of byproducts was confirmed by comparing retention time as well as mass spectra of available authentic standards and the interpretation of mass spectra of unknowns through NIST mass spectral library searches.
A Shimadzu GC/MS-AQ5050A gas chromatograph-mass spectrometer equipped with a 15 m RTX-5MX column by RESTEK (film thickness: 0.25 µm; i.d. 0.25mm) was used in identification of photolysis byproducts. Helium was used as the carrier gas, with a flow rate of 1.0 mL min−1. The GC oven temperature program was: initial temperature at 70°C, hold for 2min, 15°C min−1 gradient until 190°C, 1.5°Cmin−1 until 220°C, 10min−1 until 290°C, hold for 3min. The electron energy for the EI mass spectrum was 70 eV and the scan range was 50–400 amu.
In order to determine inorganic anions, sample solutions after UV/H2O2 treatment were analyzed using a DX-120 dionex ion chromatograph equipped with an AS 14A column. The mobile phase was a solution of sodium bicarbonate and sodium carbonate with a flow rate of 1 mL/min. With these operating conditions, the retention times for NO2−, NO3−, PO43− and SO42− were 4.78, 6.45, 8.95 and 10.75 min, respectively. Quantification of these ions were made by comparing response peaks to calibration curves obtained from standard solutions.
Results and Discussion
Direct photolysis of parathion
Parathion has a maximum absorbance (λmax) band at 275 nm while it absorbs UV irradiation over wide wavelengths from 200 to 350nm, where both LP and MP lamps have strong emission, indicating parathion can potentially be photolyzed by UV light (left axis, Fig.1). Parathion does not deprotonate at environmental pH values and there is little difference in absorption at different pH values at most wavelengths.
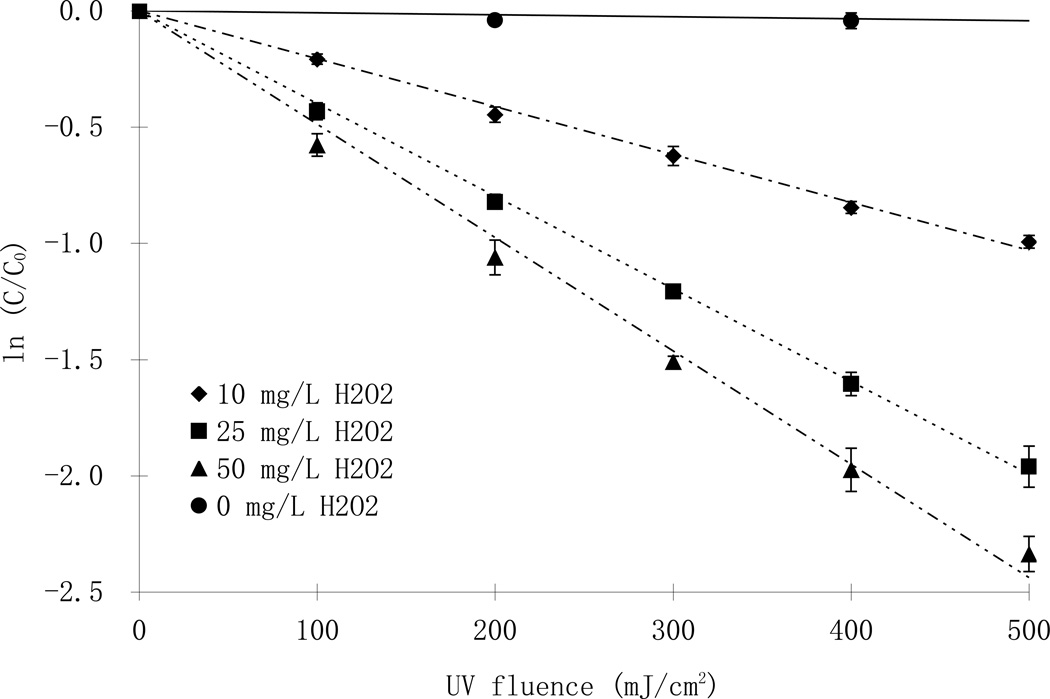
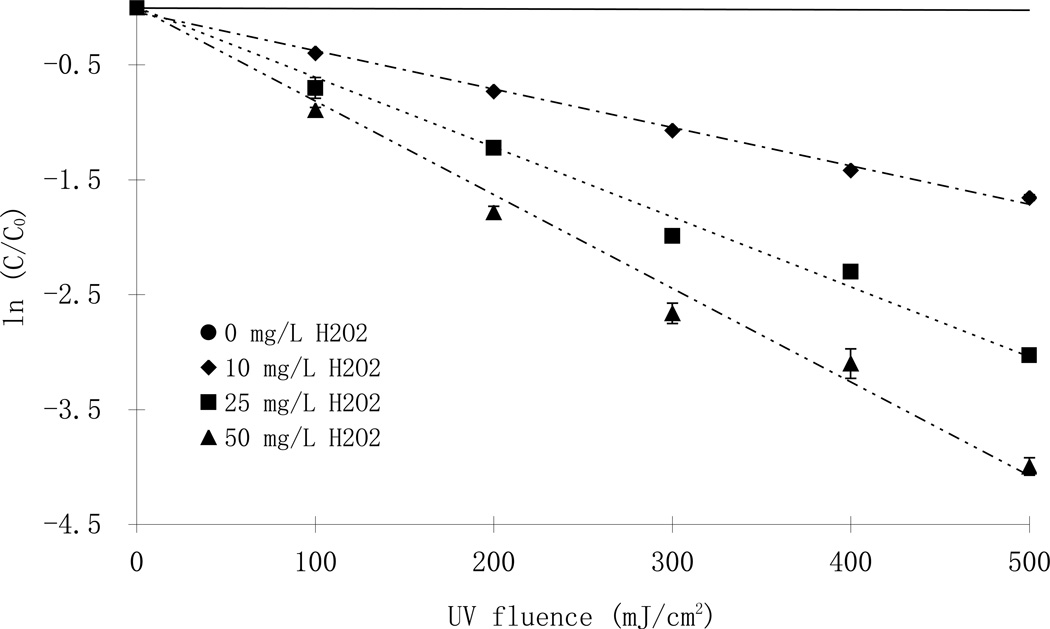
Direct photolysis of parathion followed a pseudo-first order reaction whereby plotting ln([parathion] /[parathion]0) as a function of UV fluence resulted in a linear relationship (solid lines, Fig. 2). The quantum yield was calculated from the rate constants (kd’) using Eq1 and Eq2 (Schwarzenbach et al., 2003):
| (1) |
| (2) |
Where, ϕ is the quantum yield (mol E−1), ks (λ)is the specific rate of light absorption by parathion (E mol−1 s−1), Ep (λ) is the incident photon irradiance (10−3 E cm−2 s−1), ε(λ) is the molar absorption coefficient of parathion (M−1 cm−1), a(λ) is solution absorbance (cm−1), and z is the depth of solution.
Fig. 2.
Phototransformation of parathion with and without hydrogen peroxide at pH 7 using LP (top, [parathion]0= 7.4 µM) and MP lamps (bottom; [parathion]0= 10.9 µ M)
In Eq.1, the summation included all wavelengths between 350 and 200nm used in the fluence calculation for medium pressure lamp while only the wavelength of 254nm was used for the low pressure lamps. The direct photolysis rate constants were evaluated and the quantum yields of parathion calculated at different pH values for both LP and MP UV lamps (Table 1).
Table 1.
Reaction rate constants and quantum yield of parathion using LP and MP lamps
| LP | MP | |||
|---|---|---|---|---|
| Reaction rate constant (×105 cm2/mJ) |
Quantum yield (×104 mol E−1) |
Reaction rate constant (×105 cm2/mJ) |
Quantum yield (×104 mol E−1) |
|
| pH 5 | 1.04 ± 0.14 | 7.14 ± 0.45 | 1.54 ± 0.07 | 5.76 ± 0.47 |
| pH 7 | 0.98 ± 0.14 | 6.67 ± 0.33 | 1.61 ± 0.24 | 6.00 ± 1.06 |
| pH 9 | 1.01 ± 0.20 | 7.24 ± 0.85 | 2.07 ± 1.01 | 6.77 ± 2.38 |
The quantum yields obtained from different light sources were significantly different (p <0.05) at all tested pH conditions, (except at pH 7 due to a high standard deviation in the MP data) indicating a dependence on UV wavelength. Whereas the apparent direct photolysis rate constants were slightly higher under the MP lamps compared to the LP lamps, the quantum yields obtained with the MP lamp, which take into consideration the molar absorbance of parathion at different wavelength as depicted in Eq.1, were smaller than for LP lamps at all pH values. At the same time, the quantum yields observed with the MP lamps showed that direct photolysis was enhanced in the alkaline pH range compared to neutral or acidic conditions. This observation has also been confirmed by Gal et al., (1992). The quantum yields reported here agree well with the values (6 ×10⁻⁴ mol E−1) report by Mok et al., (1987), but are smaller than another report (Chen et al., 1998).
Hydrogen peroxide assisted advanced oxidation
Photodegradation of parathion was greatly enhanced with addition of hydrogen peroxide due to the production of the strong oxidizing species, hydroxyl radical (Eq.3 and Eq.4). Indeed, the reaction between hydroxyl radicals and parathion was the dominant degradation pathway as shown in Fig. 2.
| (3) |
| (4) |
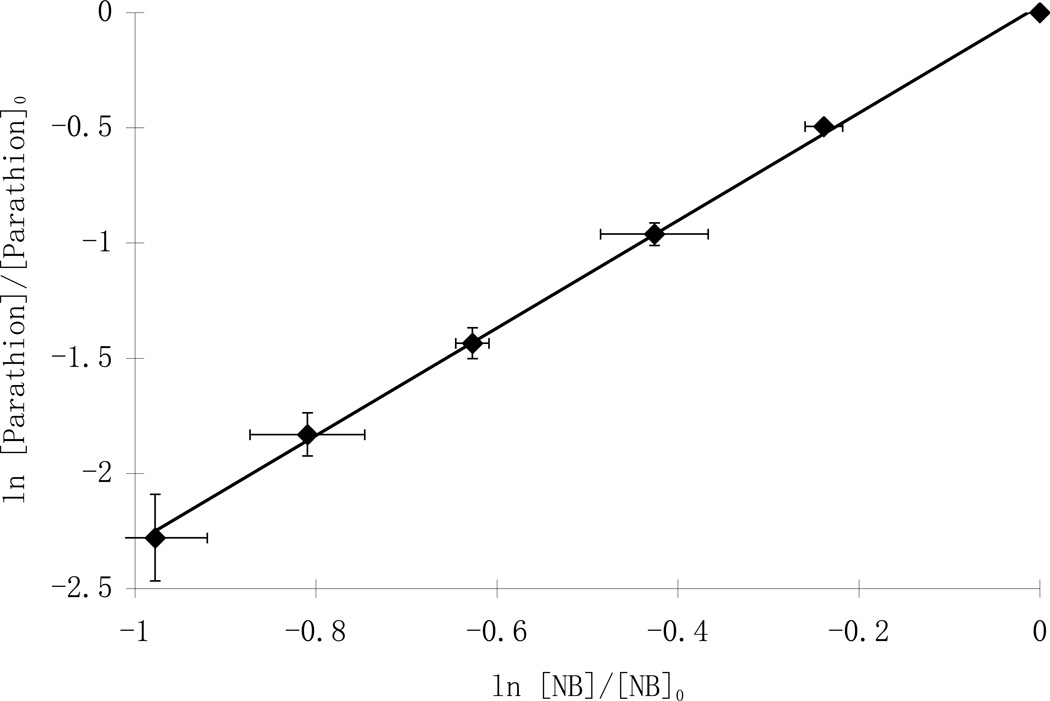
The reaction rate constant between parathion and hydroxyl radical was measured using a competition kinetics approach described in detail elsewhere (Shemer and Linden, 2006; Wu et al., 2007). Briefly, nitrobenzene (kOH = 4.0 × 10⁹ M−1 s−1 ) was chosen as the reference compound because it essentially does not undergo significant direct photolysis, yet is readily oxidized by OH radical, and it is easy to analyze using HPLC. In order to measure the hydroxyl radical rate constant (kparathion), nitrobenzene was added into parathion working solutions at various concentrations from 0.2 to 5 µM and the solutions were treated by the UV/H2O2 process using 25 mg/L of H2O2. Both parathion and nitrobenzene degradation followed pseudo-first order reaction kinetics, with the second-order rate constants of parathion expressed by Eq. 5:
| (5) |
The ratios between ln([parathion]/[parathion]0) and ln([NB]/NB]0) were constant over all experimental conditions (Fig.3). By subtracting the effect of direct photolysis (which was minimal for both parathion and nitrobenzene) the second-order rate constant for parathion was then calculated to be 9.70 ± 0.45 ×10⁹ M−1 s−1. To our knowledge, this is the first report of the hydroxyl radical rate constant for parathion.
Fig. 3.
Relative photolysis rates of parathion and nitrobenzene (NB) with 25 mg/L H2O2 in competition kinetics experiments ([parathion]0=5 µM)
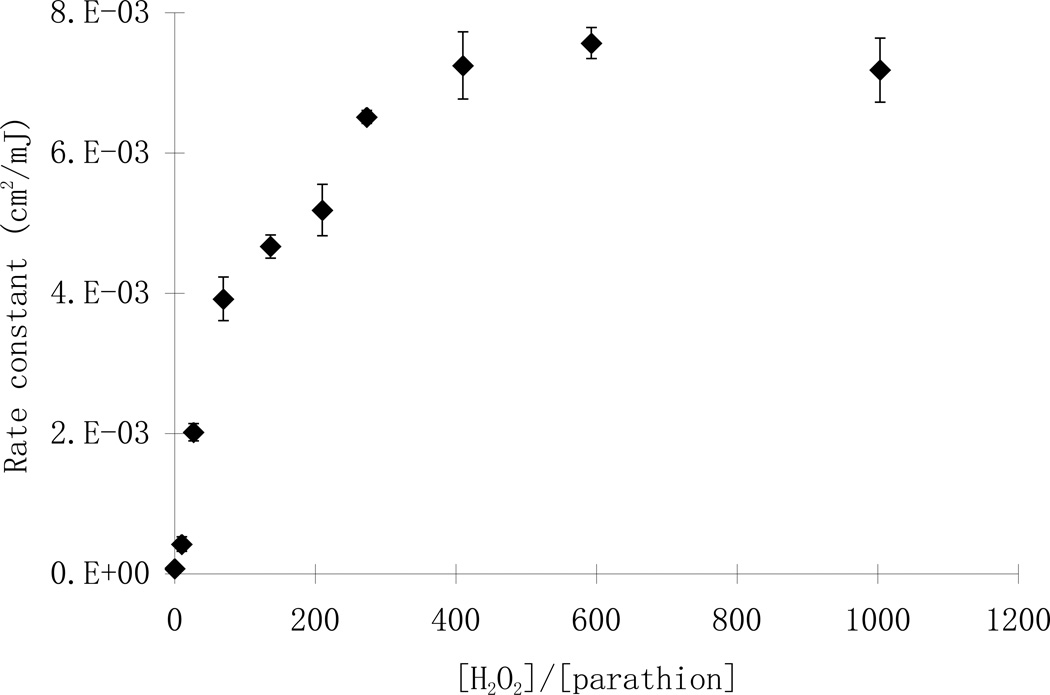
The increasing addition of hydrogen peroxide, however, did not result in a linear increase in the reaction rate constants of parathion. At the same initial parathion concentration, the photodegradation rates initially increased rapidly with increasing addition of hydrogen peroxide from zero to 10 mg/L and from 10 to 25 mg/L. However, an increase of the hydrogen peroxide concentration from 25 to 50 mg/L only resulted in a slight increase in the reaction rate (Fig.2). Such trend was more obvious at higher H2O2/parathion molar ratios (Fig. 4). In a set of experiments with different initial concentrations of parathion and hydrogen peroxide, the reaction rate constants were 1.98 ×10⁻³, 3.92×10⁻³, 5.18 ×10⁻³ cm2/mJ at molar ratios of 27, 70 and 210, respectively. There was little difference between the reaction rate constants at molar ratios of 410 (7.24 ×10⁻³ cm2/mJ) to 591 (7.56 ×10⁻³ cm2/mJ) up to 1003 (7.18 ×10⁻³ cm2/mJ). The optimal H2O2/parathion molar ratio was thus between 300–400 in this study (Fig. 4). This result is considerably higher than those reported for other substrates like metolachlor and acetone, of which the optimal ratios were found to be less than 200 (Stephan et al, 1996; Wu et al., 2007). Three points may contribute to the difference: first, the molar absorption of the substrates were different and that resulted in differences in the light available for hydrogen peroxide photolysis; Second, the direct photolysis plays an important role such that substrates with high quantum yields are less affected by the dose of hydrogen peroxide. Indeed, photolysis of NDMA (n-nitrosodimethylamine), which has a quantum yield of 0.3 mol E−1, did not change significantly with the addition of hydrogen peroxide (Sharpless and Linden, 2003); Third, the reaction rate constants presented in this paper were fluence based rather than time based. According to the Lambert-Beer law, longer exposure time was required for experiments with higher hydrogen peroxide doses in order to achieve the same UV fluence because of the light absorbance of added hydrogen peroxide. Therefore, the time based reaction rate constants would be higher at lower hydrogen peroxide doses and result in a lower optimal ratio.
Fig. 4.
Parathion reaction rates at different molar ratios of H2O2 to parathion
Two competing effects may contribute to the relationship between the molar ratio of H2O2/parathion and the resulting rate constants. First, a higher concentration of hydrogen peroxide results in a higher steady state hydroxyl radical concentration (Eq.3) and thus increases the availability of hydroxyl radical to degrade parathion. Second, hydrogen peroxide also acts as a hydroxyl radical scavenger producing a much less reactive • HO2 radical as shown by Eq. 6 and Eq. 7. This scavenging effect becomes significant at higher hydrogen peroxide concentrations and thus less hydroxyl radical is available for degrading parathion. The combination of such effects results in an optimal H2O2/parathion ratio at which the highest reaction rate constant was reached. Similar trends have also been observed for the UV/H2O2 process of metolachlor, acetone and nitro-aromatics (Stefan et al., 1996; Einschlag et al., 2002; Wu et al., 2007).
| (6) |
| (7) |
In a few experiments with DI water, the pH of the parathion solution decreased 0.5 to 3 units after the UV/H2O2 treatment (data not shown) indicating the formation of smaller molecular organic acids in the process. However, depression of pH would not be expected in natural waters with parathion at environmentally relevant concentrations.
Scenarios in natural waters
In natural water systems, presence of natural organic matter (NOM), carbonate radicals and other species complicate the photodegradation process. Particularly, the NOM and carbonate species can act as hydroxyl radical scavengers altering the kinetics of UV/H2O2 treatment of parathion. The effects of these scavenging effects on parathion degradation were studied in a natural water matrix.
The steady-state concentration of hydroxyl radical can be expressed by the ratio between its production rate and scavenging rate:
| (8) |
Where [•OH]ss is the steady-state concentration of OH radicals, RP,OH is the production rate of OH radicals, RS,OH is the scavenging rate of OH radicals. M−1 s−1 and kNOM = 2.5×10 −4 mg/L s−1 (Hoigne and Bader, 1979; Buxton et al., 1988).
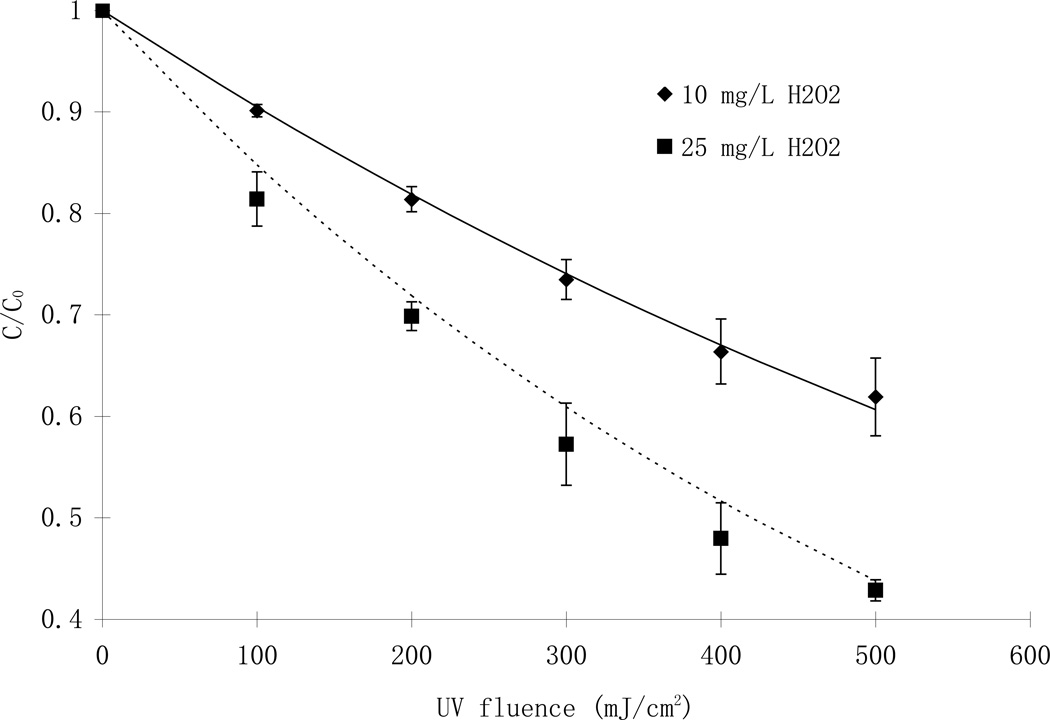
The advanced oxidation destruction of parathion in natural waters collected from the Eno River in Durham, NC, USA was studied and the data are presented in Fig 5. The overall reaction rate constants were lower than in buffered laboratory water, primarily due to the existence of NOM. The predicted concentration of parathion was determined for the two hydroxyl radical concentrations tested (10 and 25 mg/L) and also followed pseudo-first-order reaction kinetics, correlating well with the experimental results (r2 > 0.99).
Fig. 5.
Comparison of predicted (line) and experimental (symbols) destruction of parathion in Eno River water at various concentrations of hydrogen peroxide. (LP, Eno River water, [NOM]= 8.1 mg/L, alkalinity = 16. mg/L as CaCO3, [parathion]0= 7.6 µM)
Formation of organic intermediates
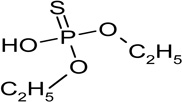
One major objective of this study was to establish a photodegradation reaction mechanism scheme based on the identification of intermediate species and byproducts. The application of GC/EI-MS made it possible to determine some of the photodegradation byproducts by using authentic standards and an identification library by NIST. Photodegradation of parathion yielded several major byproducts by both LP and MP lamp treatments as confirmed by GC/EI-MS analysis (Table 2).
Table 2.
Structure and mass spectra of byproducts
| Name and retention time (min) | Proposed structure | Spectral data (m/z) |
|---|---|---|
| O,O-diethyl phosphate (RT=5.25) |
 |
154 (M+), 127, 109, 95, 79 |
| O,O-diethyl thiophosphate (RT=6.01) |
 |
170 (M+), 141, 113, 95, 81 |
| O,O-diethyl-methyl thiophosphate (RT=6.55) |
 |
184 (M+), 156, 129, 107, 95, 79 |
| O,O,O-triethyl thiophosphate (RT=7.12) |
 |
198 (M+), 170, 121, 115, 97, 81, 65 |
| 1-methoxy-4-benzene (RT9.44) |
 |
153 (M+), 107, 123, 92, 77 |
| 4-nitro-phenol (RT=10.58) |  |
139(M+), 109, 93, 81, 65 |
| O,O-diethyl-phenyl thiophosphate (RT=11.5) |
 |
246 (M+), 218, 190, 141, 110, 94 |
| Paraoxon (RT=16.45) |  |
275 (M+), 247, 232, 149, 139, 109, 99, 81 |
| Parathion (RT=16.85) |  |
291 (M+), 275, 235, 218, 96 |
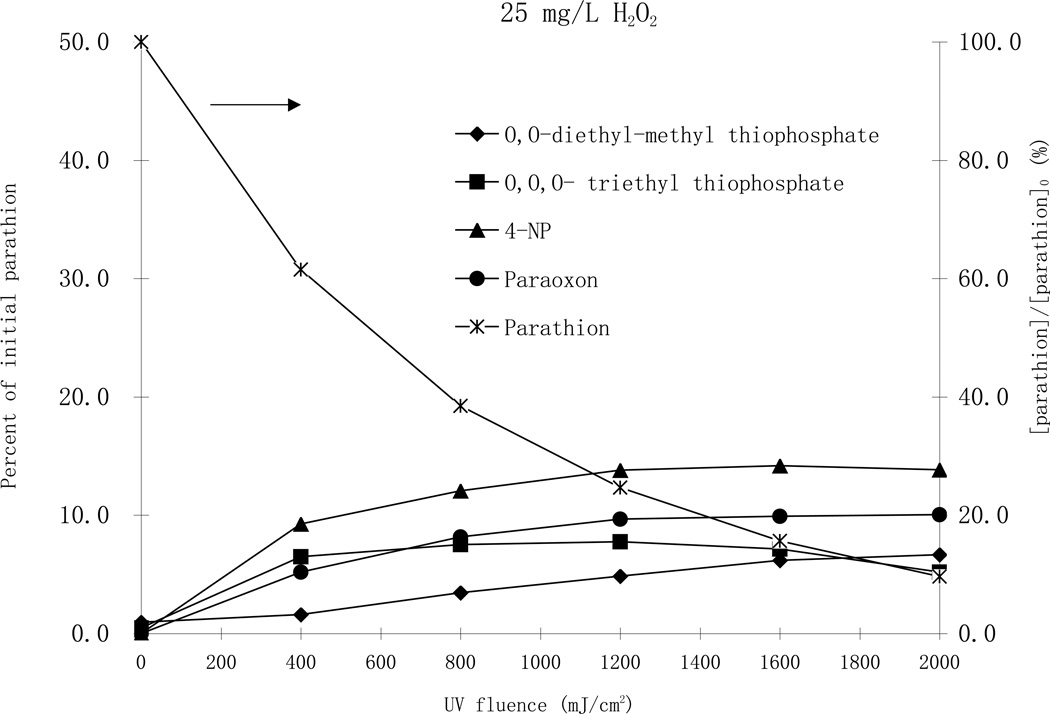
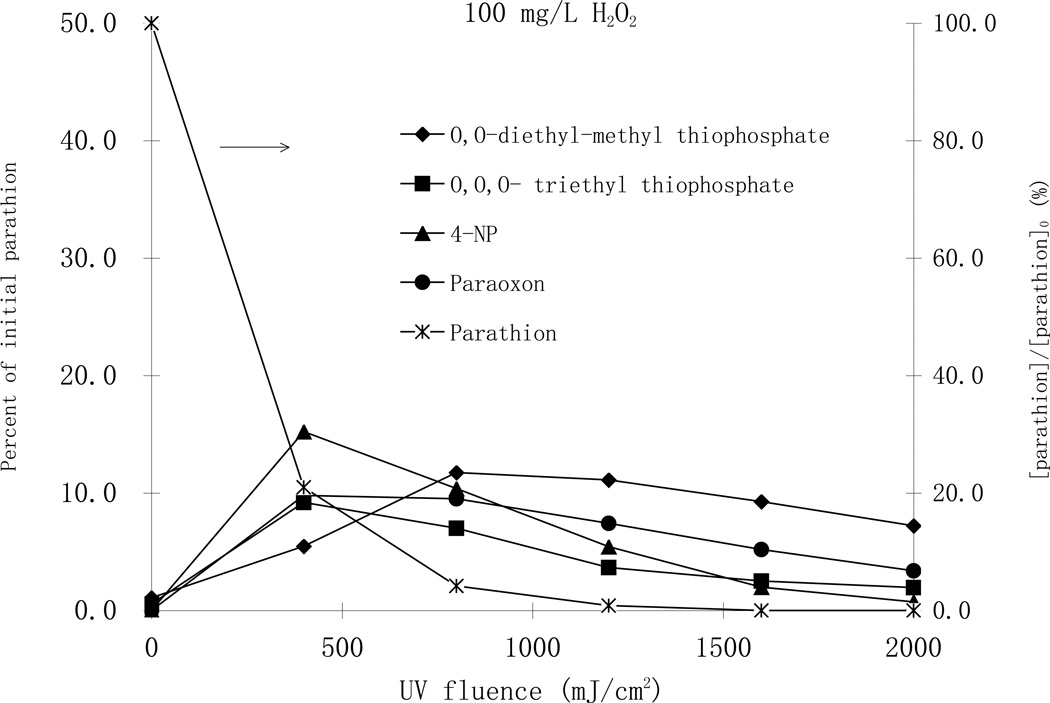
From these identified byproducts, quantification was made for 4-nitrophenol, paraoxon, O,O-diethyl-methyl thiophosphate and O,O,O-triethyl thiophosphate using HPLC analysis coupled with available authentic standards. Experiments were conducted using high enough initial parathion concentrations such that products were quantifiable, and various hydrogen peroxide concentrations (Fig.6)
Fig. 6.
Degradation of parathion and formation of byproducts by MP UV treatment with 25 mg/L H2O2 (top), and with 100 mg/L H2O2 (bottom). [parathion]0= 25 µM.
Monitoring the organic byproducts of photodegradation of parathion by the UV/H2O2 process at pH 7 over different initial hydrogen peroxide concentrations (25 and 100 mg/L), it was determined that paraoxon, the oxon analog of parathion through the substitution of sulfur by oxygen in the P=S bond, was one of the major byproducts with the highest concentration, accounting for 13 percent of decayed parathion in both H2O2 cases (Fig. 6). Paraoxon is of concern because it is the activated moiety of parathion, and results in a much stronger inhibition of cholinesterase activity than the parathion (Tian et al., 2007). Formation and destruction of paraoxon is an essential point in evaluating the effectiveness of toxicity reduction during the parathion AOP treatment. In the same reaction mixture, 4-nitrophenol was the most abundant organic byproduct with the highest concentration accounting for 18 and 20 percent of the parent parathion for the cases of 25 and 100 mg/L H2O2, respectively (Fig. 6). It was deduced that parathion was first oxidized to paraoxon, which was subsequently oxidized to 4-nitrophenol. Nonetheless, another pathway that produces 4-nitrophenol likely also exists because the concentration of 4-nitrophenol was higher than paraoxon at all UV fluence levels. O,O diethyl-methyl thiophosphate and O,O,O- triethyl thiophosphate were two other major byproducts that accounted for about 10 percent of parathion loss. The highest concentrations of all byproducts were almost the same for both H2O2 cases, indicating similar degradation pathways. The highest concentration of O,O,O-triethyl thiophosphate was observed at a UV fluence of 1000 mJ/cm2 while that of 4- nitrophenol and paraoxon were observed at a UV fluence of 1500 mJ/cm2. With the addition of 100 mg/L H2O2 all the maximum concentrations of O,O,O-triethyl thiophosphate, 4-nitrophenol and paraoxon were observed at a much lower UV fluence of about 500 mJ/cm2. The highest concentration of O,O diethyl-methyl thiophosphate, however, appeared at higher UV fluences, suggesting its formation was through a secondary reaction mechanism. As shown in Fig 6, all byproducts were eventually further degraded to other smaller intermediates.
Formation of ionic byproducts
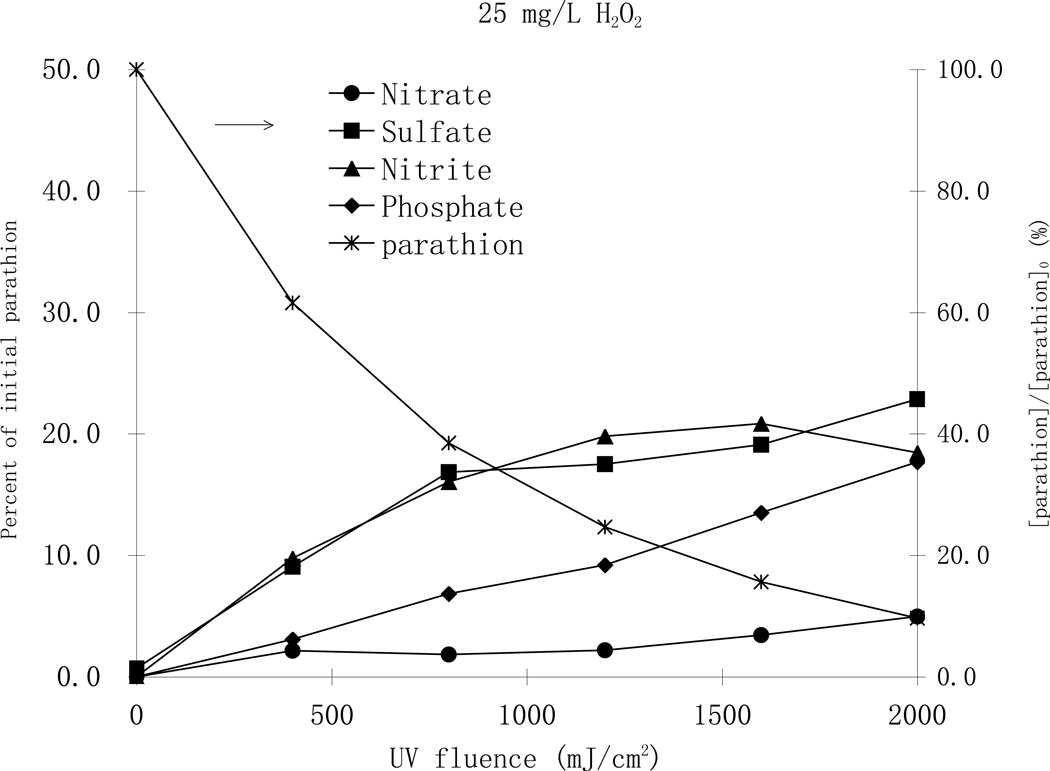
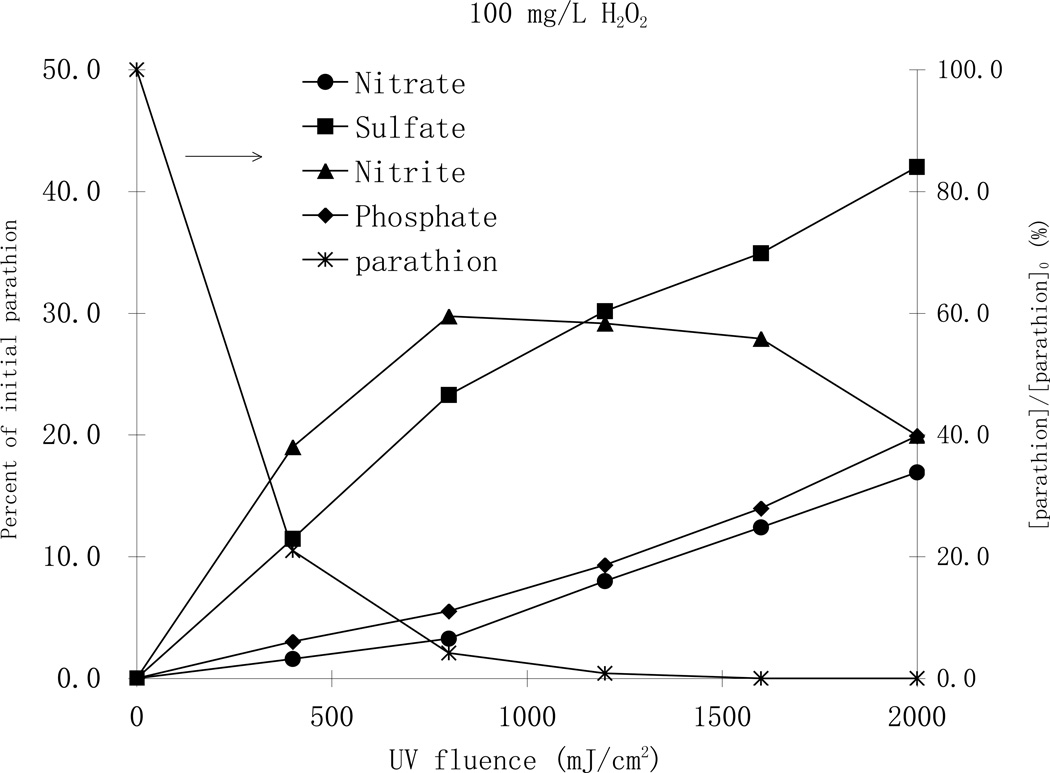
Parathion is a thiophosphate pesticide that contains nitrogen, sulfur and phosphorus such that the formation of inorganic ionic degradation byproducts during the photodegradation process is expected. The formation of inorganic anions such as NO2−, PO43−, NO3− and SO42− during the phototransformation process was monitored during photodegradation of parathion by ion chromatography (Fig. 7).
Fig. 7.
Formation of ionic byproducts during MP UV photodegradation of parathion a with a) 25 mg/L H2O2 (top), and b) 100 mg/L H2O2 (bottom), [parathion]0= 25 µM
As shown in Fig. 7, it was confirmed that the rapid oxidation of parathion to paraoxon with formation of SO42− is one of the first steps in the reaction pathway. The concentration of SO42− increased steadily with increasing UV fluence in both H2O2 cases and the highest concentration accounted for 42 percent of the theoretical recovery. Other anions were also formed from the start of the photodegradation process. NO2− and NO3− appeared at the same time and the concentration of NO2− was always greater than NO3−. The concentrations of NO2− increased initially and then decreased, while the concentration of NO3− increased steadily. That trend continued even after all parathion was degraded at higher UV fluence levels. This fact indicates that oxidation is the primary pathway for the phototransformation process and a fraction of the produced NO2− was subsequently oxidized to NO3−. Similar phenomena have also been reported in the TiO2 photocatalysis of parathion (Zoh and Stenstrom, 2002; Zoh et al., 2005). No NH4+ was observed in either process, which can be attributed to the oxidative environment of the treatments. The total recovery of nitrogen (NO2− and NO3−) accounted for 23 and 37 percent of the parathion parent compound, in the case of 25 and 100 mg/L H2O2, respectively, and it was in good correlation to the formation of SO42−. PO43− was also observed at all UV fluence levels in both H2O2, cases with very small concentrations at the beginning, indicating the thiophosphate group is relatively resistant to oxidation. Concentrations of PO43− increased steadily during the oxidation process suggesting the slow but eventual decomposition of the thiophosphate group.
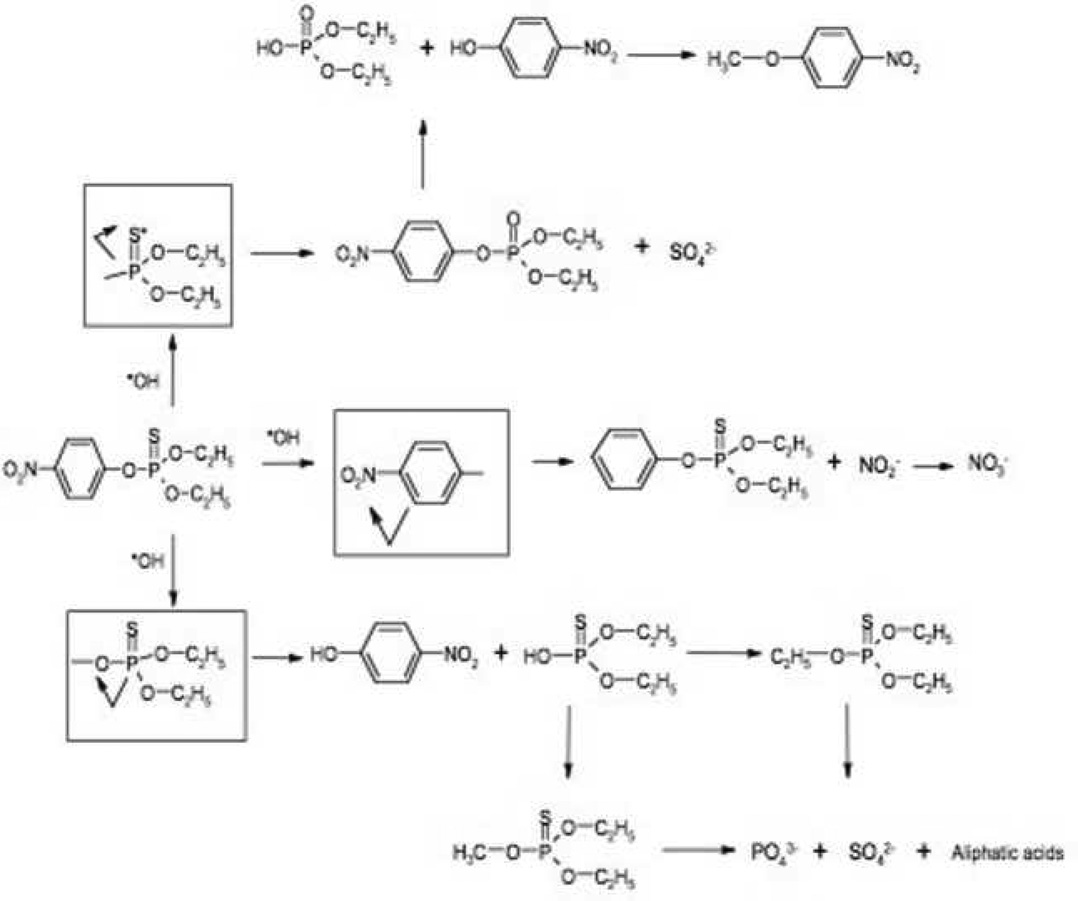
Parathion photodegradation mechanism
To develop a plausible degradation pathway for parathion, several observations should be considered: (1) the appearance of sulfate, nitrate, nitrite and phosphate at the onset of the reaction; (2) the relatively balanced yield of organic byproducts; and (3) the reduction of byproduct concentrations during the course of photodegradation. A proposed degradation scheme that explains all these facts indicates that the photodegradation of parathion may simultaneously occur over three different pathways as illustrated in Figure 8: (1) the oxidative attack by hydroxyl radical on the P=S bond, which results in the formation of paraoxon; (2) on the P-O bond that connects the thiophosphate group to the aromatic ring and results in the formation of corresponding nitro-phenol byproducts; and (3) on the nitro-phenyl bond that resulted in the formation of O,O-diethyl-phenyl thiophosphate. The formation of O,O-diethyl-methyl thiophosphate and O,O,O-triethyl thiophosphate could occur through methylation and ethylation of O,O-diethyl thiophosphate. The sources of methyl and ethyl groups could come from the small molecular organic acids or alcohol functional groups (Moctezuma et al., 2007). In a study of TiO2 assisted photodegradation of methyl-parathion, similar results were observed indicating that O,O,O trimethyl thiophosphate was detected and assumed to be produced by the same mechanism (Evgenidou et al., 2007). It was noticed that 4-nitrophenol and SO42− can be produced through two pathways while O,O diethyl-methyl thiophosphate, O,O,O- triethyl thiophosphate, PO43− and NO3− were produced through secondary reactions.
Fig. 8.
Suggested parathion photodegradation decay pathways
Conclusions
The direct UV photolysis of parathion, a highly toxic organophosphorus pesticide still partially in use, exhibited a slow pH independent degradation. The first -order reaction rate constants and quantum yields were significantly different between MP and LP UV sources, indicating strong wavelength dependence on the reaction kinetics. Addition of hydrogen peroxide enhanced the photolysis of parathion due to the reaction between parathion and hydroxyl radicals with a second-order rate constant measured as 9.70 ± 0.45×10⁹ M−1 s−1.
The UV fluence required for water disinfection, typically between 40 and 200 mJ/cm2, is insufficient for the direct destruction of parathion, but UV/H2O2 AOP treatment has a much higher efficiency for removing parathion. Depending upon water quality and treatment requirements, the dosages of hydrogen peroxide typically vary from 2 to 10 mg/L (Kavanaugh et al., 2004). Because the concentrations of pesticides in natural waters are very low (ng/L to µg/L levels), the addition of 2 to 10 mg/L of hydrogen peroxide may exceed the optimal ratio of parathion. Under such optimal conditions, the required UV dose to reach 90% removal of parathion is less than 300 mJ/cm2. The presence of natural organic matter and bicarbonate ions had a negative impact on the UV/H2O2 treatment due to scavenging effects, which was also confirmed in natural river water samples.
The UV/H2O2 treatment of parathion yielded several inorganic anions, i.e. NO2−, PO43−, NO3− and SO42−. The occurrence of these anions in the course of the UV treatment indicated the oxidative environment in the solutions and the sequence of cleavage of related bonds. Several organic byproducts were identified by GC/EI-MS analysis, of which 4-nitrophenol, paraoxon, O,O-diethyl-methyl thiophosphate and O,O,O-triethyl thiophosphate were quantified over the range of treatments tested. The combined byproduct information led to a proposed parathion degradation scheme that included three simultaneous pathways.
Acknowledgements
Funding for this project was provided by the Duke University Basic Research Center through the Superfund Basic Research Program, grant number P42 ES-010356. The authors thank Dr. Peter Ruiz-Haas for his reviews and assistance during the research.
Footnotes
Publisher's Disclaimer: This is a PDF file of an unedited manuscript that has been accepted for publication. As a service to our customers we are providing this early version of the manuscript. The manuscript will undergo copyediting, typesetting, and review of the resulting proof before it is published in its final citable form. Please note that during the production process errors may be discovered which could affect the content, and all legal disclaimers that apply to the journal pertain.
References
- Buxton GV, Greenstock CL, Helman WP, Ross AB. Critical review of rate constants for reactions of hydrated electrons, hydrogen-atoms and hydroxyl radicals (.OH/.O) in aqueous-solution. J. Phys. Chem. Ref. Data. 1988;17:513–886. [Google Scholar]
- Chen TF, Doong R, Lei WG. Photocatalytic degradation of parathion in aqueous TiO2 dispersion: the effect of hydrogen peroxide and light intensity. Water. Scence and. Technology. 1998;37(8):187–194. [Google Scholar]
- China, Agriculture Ministry. NO. 199 Announcement of the Ministry of Agriculture. China: 2007. http://www.agri.gov.cn/ztzl/zlaqf/flfg/t20070919_893058.htm. [Google Scholar]
- Doong RA, Chang WH. Photodegradation of parathion in titanium dioxide and zero valent iron solutions in the presence of hydrogen peroxide. J. Photochem. Photobiol. A: Chem. 1998;116(3):221–228. [Google Scholar]
- Einschlag F, Lopez J, Carlos L, Capparelli A, Braun AM, Oliveros E. Evaluation of the efficiency of photodegradation of nitroaromatics applying the UV/H2O2 technique. Environ. Sci. Technol. 2002;36(18):3936–3944. doi: 10.1021/es0103039. [DOI] [PubMed] [Google Scholar]
- Evgenidou E, Konstantinou I, Fytianos K, Poulios I, Albanis T. Photocatalytic oxidation of methyl parathion over TiO2 and ZnO suspensions. Catalysis Today. 2007;124(3–4):156–162. [Google Scholar]
- Freed VH, Chiou CT, Schmedding DS. Degradation of selected organophosphate pesticides in water and soil. J. Agric. Food Chem. 1979;27(4):706–708. [Google Scholar]
- Gal E, Aires P, Chamarro E, Esplugas S. Photochemical degradation of parathion in aqueous solutions. Water Research. 1992;26(7):911–915. [Google Scholar]
- Grunwell JR, Erickson RH. Photolysis of parathion (O,O-Diethyl-O-(4-nitrophenyl)thiophosphate ). New products. J. Agric. Food Chem. 1973;21(5):929–931. doi: 10.1021/jf60189a003. [DOI] [PubMed] [Google Scholar]
- Hoigne J, Bader H. Ozonation of water:” Oxidation-competition values” of different types of waters used in Switzerland. Ozone Sci. Eng. 1979;1:357–372. [Google Scholar]
- Kavanaugh M, Chowdhury Z, Kommineni S, Liang S, Min J, Croue JP, Corin N, Amy G, Simon E, Cooper W, Tornatore P, Nickelsen M. Removal of MTBE with advanced oxidation processes. AWWA Research Foundation; 2004. [Google Scholar]
- Kiely T, Donaldson D, Grube A. Pesticides industry sales and usage, 2000 and 2001 market estimates. USA EPA; 2004. http://www.epa.gov/oppbead1/pestsales/01pestsales/market_estimates2001.pdf. [Google Scholar]
- Klassen N, Marchington D, McGowan HC. H2O2 determination by the I3 method and KMnO4 titration. Anal. Chem. 1994;66(18):2921–2925. [Google Scholar]
- Meister RT. Farm chemicals handbook ’92. Willoughby, OH: Meister Publishing Company; 1992. [Google Scholar]
- Moctezuma E, Leyva E, Palestino G, de Lasa H. Photocatalytic degradation of methyl parathion: reaction pathways and intermediate reaction products. J. Photochemistry and Photobiology A: Chemistry. 2007;186(1):71–84. [Google Scholar]
- Mok CY, Marriott P, Ong KL, Yeo GN. Photodegradation of parathion. Bull. Environ. Contam. Toxicol. 1987;38(5):820–826. doi: 10.1007/BF01616707. [DOI] [PubMed] [Google Scholar]
- Rotich HK, Zhang ZY, Zhao YS, Li JH. The adsorption behavior of three organophosphorus pesticides in peat and soil samples and their degradation in aqueous solutions at different temperatures and pH values. Intern. J. Environ. Anal. Chem. 2004;84(4):289–301. [Google Scholar]
- Sakellarides TM, Siskos MG, Albanis TA. Photodegradation of selected organophosphorus insecticides under sunlight in different natural waters and soils. Inter. J. Environ. Anal. Chem. 2003;83(1):33–50. [Google Scholar]
- Santos FF, Martin-Neto L, Airoldi FPS, Rezende MOO. Photochemical behavior of parathion in the presence of humic acids from different origins. Journal of Environmental Science and health, Part B. 2005;40(5):721–730. doi: 10.1080/03601230500189246. [DOI] [PubMed] [Google Scholar]
- Schwarzenbach RP, Gschwend P, Imboden DM. Environmental Organic chemistry. 2nd. New York: Wiley-Interscience, John Wiley and Sons; 2003. [Google Scholar]
- Sharpless CM, Linden KG. Experimental and model comparison of low- and medium-pressure Hg lamps for the direct and H2O2 assisted UV photodegradation of n-nitrosodimethylamine in simulated drinking water. Environ. Sci. Technol. 2003;37(9):1933–1940. doi: 10.1021/es025814p. [DOI] [PubMed] [Google Scholar]
- Shemer H, Linden KG. Degradation and byproduct formation of diazinon in water during UV and UV/H2O2 treatment. J. Hazardous Materials. 2006;B136(3):553–559. doi: 10.1016/j.jhazmat.2005.12.028. [DOI] [PubMed] [Google Scholar]
- Stefan MI, Hoy AR, Bolton JR. Kinetics and mechanism of the degradation and mineralization of acetone in dilute aqueous solution sensitized by the UV photolysis and hydrogen peroxide. Environ. Sci. Technol. 1996;30(7):2382–2390. [Google Scholar]
- Tian F, Wu X, Pan H, Jiang H, Kuo YL, Marini AM. Inhibition of protein kinase C protects against paraoxon-mediated neuronal cell death. Neurotoxicology. 2007;28(4):843–849. doi: 10.1016/j.neuro.2007.04.001. [DOI] [PubMed] [Google Scholar]
- US. Environmental Protection Agency. Integrated Risk Information System (IRIS) on Parathion._National Center for Environmental Assessment. Washington, DC: Office of Research and Development; 1999. [Google Scholar]
- US. Environmental Protection Agency. EPA R.E.D Facts: ethyl-parathion. 2000 http://www.epa.gov/oppsrrd1/REDs/factsheets/0155fct.pdf.
- Wu CL, Shemer H, Linden KG. Photodegradation of metolachlor applying UV and UV/H2O2. J. Agric. Food Chem. 2007;55(10):4059–4065. doi: 10.1021/jf0635762. [DOI] [PubMed] [Google Scholar]
- Zoh KD, Kim TS, Kim JG, Choi KH. Degradation of parathion and the reduction of acute toxicity in TiO2 photocatalysis. Water Science & Technology. 2005;52(8):45–52. [PubMed] [Google Scholar]
- Zoh KD, Stenstrom MK. Fenton oxidation of hexahydro-1,3,5-trinitro-1,3,5-triazne (RDX) and octahydro-1,3,5,7-tetranitro-1,3,5,7-tetrazocine (HMX) Water Research. 2002;36(5):1331–1341. doi: 10.1016/s0043-1354(01)00285-8. [DOI] [PubMed] [Google Scholar]


