Abstract
Aim and Background:
Due to the relatively high prevalence of binocular vision anomalies, a regular examination including tests for assessment and determination of these anomalies is necessary. The aim of this study was to assess the relationship between near point of convergence (NPC) and near binocular vision symptoms and finding of an NPC cutoff point for symptoms in university students.
Materials and Methods:
In this cross-sectional study, 124 students of different majors of Zahedan University of Medical Sciences were randomly selected. If they met the inclusion criteria, they were divided into two groups (symptomatic and asymptomatic) according to the convergence insufficiency symptom survey questionnaire. For NPC measurement, a small isolated letter E of approximately 20/30 size on a metal rod was used. After data collection, data were analyzed in SPSS.17 software (SPSS for Windows, SPSS Inc., Chicago, IL) using descriptive and analytical statistics, including Mann–Whitney U test and receiver operating characteristic (ROC) curve.
Results:
The mean NPC findings in the symptomatic and asymptomatic groups were 11.7 ± 5.0 and 8.4 ± 3.4 cm, respectively, with a significant difference between the two groups (P < 0.001). The ROC curve suggests an NPC cutoff point of 9.5 cm for the presence of symptoms with the testing procedures used in this study.
Conclusion:
The determination of NPC is helpful in the differentiation of symptomatic from asymptomatic subjects.
Keywords: Binocular vision, near point of convergence, visual symptoms
Binocular vision anomalies are among the most common visual disorders, and they may be associated with symptoms such as headache, asthenopia, pain in the eye, occasional diplopia, intermittent blurred vision, and swimming of print during reading.[1] About 20% of patients who come to optometry clinics will have binocular vision anomalies or decompensated heterophoria.[2] Due to the high prevalence of binocular vision anomalies, a regular vision examination is advisable for identification of these disorders. Convergence function is evaluated with clinical tests to determine whether the visual system can provide the patient's vergence needs at near. The evaluation of the convergence system is an important part of binocular vision testing. The NPC is one of the most commonly used tests in eye examination[3,4] and often is used as a vision screening test.[5] It is also an important finding in the diagnosis of convergence insufficiency (CI).[6] A more remote NPC than normal is one of the important signs in the diagnosis of CI.[7,8]
During the NPC test, a suitable target is brought slowly toward the eyes along the median line until the patient reports diplopia and/or the examiner observes that one eye has turned outward.[9] According to von Noorden's criterion, the NPC should be at a distance of 8–10 cm or less from the eyes in normal conditions, and a more remote NPC will be associated with symptoms.[10] Shippman et al.[11] reported an evaluation of the NPC in patients with normal binocular vision and with CI. The mean NPC findings were 5.0 cm (range, 1–15 cm) for those with normal binocular vision and 7.9 cm (range, 1–20 cm) in those with CI, but the type of target used was not reported.[11] The purpose of this study was to provide further assessment of the relationship between NPC and binocular vision symptoms.
Materials and Methods
In this cross-sectional study, students of Zahedan University of Medical Sciences were randomly selected from the list of students. 124 students who met inclusion criteria were entered into the study. Before starting this study, permission was obtained from the ethics committee of the University of Medical Sciences. The participants were introduced to the project and their informed consent was obtained before participation. Inclusion criteria were visual acuity at least 20/30 or better in each eye at 6 m and 40 cm with or without correction, absence of strabismus at 6 m and 40 cm with cover test, and no history of ocular trauma or ocular disease.[12]
Refractive errors were determined by retinoscopy (Heine ß-200 retinoscope). Cycloplegic retinoscopy was performed with cyclopentolate 1% if any of the following were found: esophoria, especially decompensated phoria according to slow or jerky recovery movement on cover test; unstable objective or subjective refraction; or large discrepancy between objective and subjective results.[9] The results of retinoscopy were refined by subjective refraction using trial case and cross cylinder (for checking of cylinder axis and power) and then dissociated red-green balance test was performed. After this, we used plate 4 of the TNO test to rule out suppression.
The near heterophoria was determined using the alternate prism cover test method with best correction in a trial frame. Subjects fixated on an accommodative target, a small isolated letter “E” of approximately (6/9) size from reduced Snellen chart, on a metal rod at eye level at 40 cm. As the alternate cover test was performed, the prism power was adjusted until there was no recovery movement in either eye. For confirmation of the neutral point, the prism power was increased until a reversal movement was seen. The prism power was then reduced until no movement was seen.
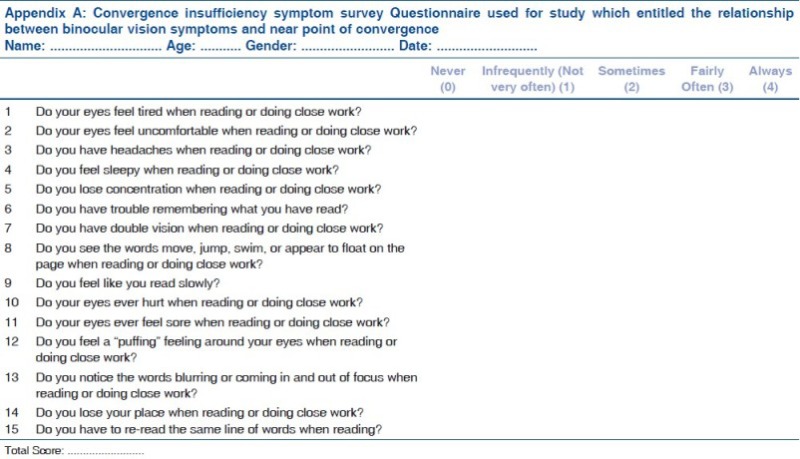
The subjects were divided into two groups (symptomatic and asymptomatic) according to convergence insufficiency symptom survey (CISS) questionnaire. The CISS questionnaire is a valid and reliable questionnaire which consists of 15 questions designed to determine symptoms associated with near work, quantitatively. It can be used for evaluation of symptoms in school-age children (8–13 years) and also for adults (19–30 years). When used in adults, a score ≥21 distinguishes symptomatic from asymptomatic subjects.[8] Hence, subjects with a survey score 21 or greater were considered to be symptomatic. See Appendix
For determination of NPC, a small isolated letter “E” of approximately 20/30 size from a reduced Snellen chart was moved along a metal rod [Fig. 1] in the subject's midline. The target was moved gradually from 40 cm toward the bridge of the nose of the subject at a rate of approximately 3–5 cm/s.[13] The subjects were instructed to keep the target single during the test and report when it appeared double (break point). The distance between break point to the plane of the lateral canthus was measured with a millimeter ruler. In cases in which subjects did not report diplopia, the examiner measured the distance at which one eye lost its fixation on the target. For each subject the NPC was measured once after giving adequate instructions to them.[5]
Figure 1.
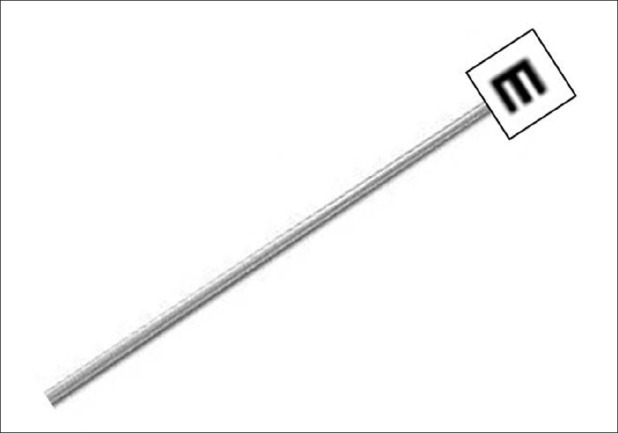
Used target for determination of near point of convergence (our self-production)
One examiner asked the subjects the questions about presence of symptoms and another examiner measured the NPC. All testings were performed with full room illumination which should be at least 12–20 footcandles (130–215 lux).[4]
After data collection, data were analyzed using SPSS.17 software (SPSS for Windows, SPSS Inc., Chicago, IL) with descriptive and analytical [Mann–Whitney U test and receiver operating characteristic (ROC) curve] statistics. A ROC curve is a graphical technique in which the sensitivity values are plotted on the Y-axis, and the X-axis is 1 minus the specificity. Hence, a ROC curve is a way to illustrate the sensitivity and specificity of a clinical test for different cut points, thus permitting the determination of a best differential diagnostic cut point. For example in the ongoing study, for values above this specified cut point, we say the subjects will be more likely to be symptomatic and for values below it, they will be more likely to be asymptomatic. In all tests, the significance level was considered to be 0.05.
Results
Of the 124 students under study, 75 (60.4%) were female and 49 (39.6%) male. The mean ages in all subjects and separately in females and males were 21.1 ± 2.1, 22.1 ± 3.2, and 21.8 ± 2.1 years, respectively. Asymptomatic and symptomatic subjects numbered 82 subjects (66.1%) and 42 subjects (33.9%). The mean score of CISS for the symptomatic and asymptomatic group was 35.8 ± 10.2 and 13.3 ± 6.5. The Mann–Whitney U test showed a considerable difference in the mean score between the two groups (P < 0.001).
Among females, symptomatic and asymptomatic subjects numbered 28 subjects (37.3%) and 47 subjects (62.7%), and in males 14 subjects (28.5%) and 35 subjects (71.5%), respectively.
The mean refractive errors in the two eyes of subjects are shown in Table 1.
Table 1.
Mean and SD sphere, cylinder, and axis of astigmatism and spherical equivalent in two groups
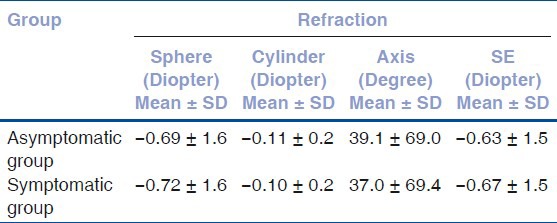
The Mann–Whitney U test did not show a significant difference in the mean of sphere, cylinder, axis of astigmatism, and spherical equivalent between the two groups (P > 0.05).
The means and standard deviations for near heterophoria were as follows: all subjects (−4.2 ± 3.1), symptomatic subjects (−5.6 ± 3.1), and asymptomatic subjects (−3.5 ± 2.9) prism diopters. The negative sign indicates exophoria. The Mann–Whitney U test showed significant difference in the mean of near deviation between the two groups (P = 0.01).
The mean NPC was 9.5 ± 4.5 cm in all subjects and was 11.7 ± 5.0 and 8.4 ± 4 cm in the symptomatic and asymptomatic groups, respectively. The statistical indices for NPC are displayed in Table 2.
Table 2.
Summary statistics for near point of convergence in all subjects and separately in symptomatic and asymptomatic ones

The Mann–Whitney U test showed a significant difference in the NPC means between symptomatic and asymptomatic subjects statistically (P < 0.001).
Fig. 2 can aid in the visualization of NPC difference between two groups. Fig. 2 shows the NPC is higher in symptomatic subjects than in asymptomatic subjects, and the variance of NPC to be greater in the symptomatic group than in the asymptomatic group.
Figure 2.
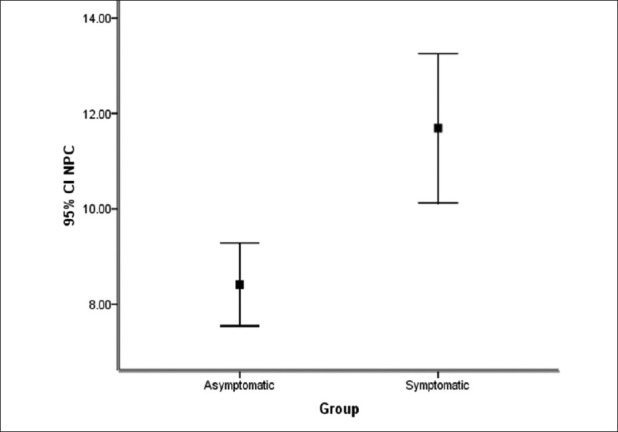
Near point of convergence in the symptomatic and asymptomatic groups. Error bars indicate 95% confidence interval
For determination of the near point of convergence which showed the best sensitivity and specificity for separating symptomatic from asymptomatic subjects, we used the ROC curve [Fig. 3].
Figure 3.
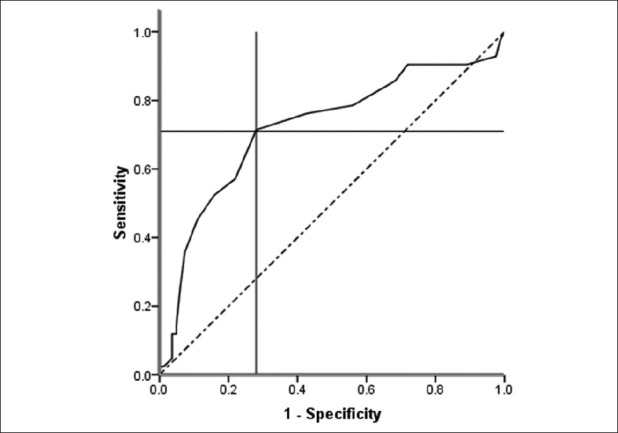
The receiver operating characteristic for determination of the near point of convergence cut-off point
Based on the ROC curve analysis and determination of the sensitivity and specificity values, the cutoff point of the near point of convergence which yielded the maximum value of the sum of sensitivity and specificity was 9.5 cm.
At a cutoff point of 9.5 cm, the sensitivity was 71.4% and the specificity was 72.0%. In other words, of the symptomatic subjects, 71.4% had an NPC greater than 9.5 cm and 72.0% of the asymptomatic subjects had an NPC of a subject less than 9.5 cm.
Discussion
The findings of this study demonstrate a statistically significant difference in NPC between symptomatic and asymptomatic subjects. If there is a remote NPC, maintenance of clear, single, comfortable, and efficient binocular vision at the desired working distance can be difficult and the subject may be symptomatic during near point activities.
In this study, we found that the mean NPC was 8.4 cm. Several other studies have examined the NPC in children. Hayes et al. determined near point of convergence with push-up method by use of an accommodative target in kindergarten, third grade, and sixth grade children and reported the values of 3.3, 4.1, and 4.3 cm, respectively.[14] Rouse et al.[12] and Borsting et al.[7] measured NPC with the push-up method in 8- to 13-year-old subjects and reported average values of 2.7 and 3.0 cm, respectively. The value reported by Chen et al. in the age range of 1–18 years was 1.9 cm.[15] We used center of rotation (lateral canthus) instead of the spectacle plane or the bridge of the nose as in previous studies. Maples et al. mentioned that the mean of NPC break in elementary school children for differential diagnosis of symptomatic from asymptomatic is 5.0 cm or less.[16] Jiménez et al.[17] reported a mean NPC break in children of 5.2 cm with a penlight. Those studies found lower values for NPC than in this study. They moved the target in free space rather than using a carrier rod for the target.
Studies that have used a carrier rod, such as an RAF rule, for NPC measurement have generally had higher NPC measurements than when target was moved in free space. The study results from Adler et al.[18] appear to confirm that the difference can largely be explained by the movement of the target on a carrier rod rather than in free space. They found a more remote NPC with the RAF rule than with targets in free space.
In the results presented here, the NPC was more remote in the symptomatic group. ROC analysis suggested that an NPC farther than 9.5 cm with the testing procedures used in this study (particularly with a carrier rod to hold the letter target) was more likely to be associated with symptoms. It may be useful to have similar studies done in other age groups or locations, or in subjects with heavy near work demands such as computer users.
Conclusions
Mean NPC findings were different in the symptomatic and asymptomatic groups. Evaluation of NPC is important in persons with high near task demands.
Acknowledgements
We thank the students who participated as subjects in this study.
Footnotes
Source of Support: Nil
Conflict of Interest: None declared.
References
- 1.Bailey R. Assessing the predictive ability of the test-positive findings of an elementary school vision screening. Optom Vis Sci. 1998;75:682–91. doi: 10.1097/00006324-199809000-00024. [DOI] [PubMed] [Google Scholar]
- 2.Karania R, Evans BJ. The Mallett fixation disparity test: Influence of test instructions and relationship with symptoms. Ophthalmic Physiol Opt. 2006;26:507–22. doi: 10.1111/j.1475-1313.2006.00385.x. [DOI] [PubMed] [Google Scholar]
- 3.Carlson NB, Kurtz D. 3rd ed. New York: McGraw-Hill; 2004. Clinical Procedures for Ocular Examination; p. 50. [Google Scholar]
- 4.Grosvenor T. 5th ed. Boston: Butterworth-Heinemann; 2007. Primary Care Optometry; p. 120. [Google Scholar]
- 5.Scheiman M, Gallaway M, Frantz KA, Peters RJ, Hatch S, Cuff M, et al. Near point of convergence: Test procedure, target selection, and normative data. Optom Vis Sci. 2003;80:214–25. doi: 10.1097/00006324-200303000-00011. [DOI] [PubMed] [Google Scholar]
- 6.Rouse MW, Hyman L, Hussein M, Solan H. Frequency of convergence insufficiency in optometry clinic settings. Optom Vis Sci. 1998;75:88–96. doi: 10.1097/00006324-199802000-00012. [DOI] [PubMed] [Google Scholar]
- 7.Borsting E, Rouse MW, De Land PN. Prospective comparison of convergence insufficiency and normal binocular children on CIRS symptom surveys. Optom Vis Sci. 1999;76:221–8. doi: 10.1097/00006324-199904000-00025. [DOI] [PubMed] [Google Scholar]
- 8.Scheiman M, Wick B. 3th ed. Philadelphia: Lippincott Williams & Wilkins; 2008. Clinical Management of Binocular Vision: Heterophoric, Accommodative and Eye Movement Disorders; pp. 3–52. (121-3). [Google Scholar]
- 9.Evans B. 5th ed. Boston: Butterworth- Heinemann; 2007. Pickwell's Binocular Vision Anomalies; pp. 24–91. [Google Scholar]
- 10.Von Noorden G, Campos EC. 6th ed. St. Louis: Mosby; 2002. Binocular Vision and Ocular Motility: Theory and Management of Strabismus; pp. 312–20. [Google Scholar]
- 11.Shippman S, Infantino J, Cimbol D, Cohen KR, Weseley AC. Convergence insufficiency with normal parameters. J Pediatr Ophthalmol Strabismus. 1983;20:158–61. doi: 10.3928/0191-3913-19830701-08. [DOI] [PubMed] [Google Scholar]
- 12.Rouse MW, Borsting E, Deland PN Convergence Insufficiency and Reading Study (CIRS) Group. Reliability of binocular vision measurements used in the classification of convergence insufficiency. Optom Vis Sci. 2002;79:254–64. doi: 10.1097/00006324-200204000-00012. [DOI] [PubMed] [Google Scholar]
- 13.Griffin JR, Grisham JD. 4th ed. Boston: Butterworth-Heinemann; 2002. Binocular Anomalies: Diagnosis and Vision Therapy; pp. 45–50. [Google Scholar]
- 14.Hayes GJ, Cohen BE, Rouse MW, De Land PN. Normative values for the near point of convergence of elementary school children. Optom Vis Sci. 1998;75:506–12. doi: 10.1097/00006324-199807000-00019. [DOI] [PubMed] [Google Scholar]
- 15.Chen AH, O’Leary DJ, Howell ER. Near visual function in young children. Part I: Near point of convergence. Part II: Amplitude of accommodation. Part III: Near heterophoria. Ophthalmic Physiol Opt. 2000;20:185–98. [PubMed] [Google Scholar]
- 16.Maples WC, Hoenes R. Near point of convergence norms measured in elementary school children. Optom Vis Sci. 2007;84:224–8. doi: 10.1097/OPX.0b013e3180339f44. [DOI] [PubMed] [Google Scholar]
- 17.Jiménez R, Pérez MA, García JA, González MD. Statistical normal values of visual parameters that characterize binocular function in children. Ophthalmic Physiol Opt. 2004;24:528–42. doi: 10.1111/j.1475-1313.2004.00234.x. [DOI] [PubMed] [Google Scholar]
- 18.Adler PM, Cregg M, Viollier AJ, Woodhouse JM. Influence of target type and RAF rule on the measurement of near point of convergence. Ophthal Physiol Opt. 2007;27:22–30. doi: 10.1111/j.1475-1313.2006.00418.x. [DOI] [PubMed] [Google Scholar]


