Abstract
Interstitial diffuse optical tomography (DOT) has been used to characterize spatial distribution of optical properties for prostate photodynamic therapy (PDT) dosimetry. We have developed an interstitial DOT method using cylindrical diffuse fibers (CDFs) as light sources, so that the same light sources can be used for both DOT measurement and PDT treatment. In this novel interstitial CDF-DOT method, absolute light fluence per source strength (in unit of 1/cm2) is used to separate absorption and scattering coefficients. A mathematical phantom and a solid prostate phantom including anomalies with known optical properties were used, respectively, to test the feasibility of reconstructing optical properties using interstitial CDF-DOT. Three dimension spatial distributions of the optical properties were reconstructed for both scenarios. Our studies show that absorption coefficient can be reliably extrapolated while there are some cross talks between absorption and scattering properties. Even with the suboptimal reduced scattering coefficients, the reconstructed light fluence rate agreed with the measured values to within ±10%, thus the proposed CDF-DOT allows greatly improved light dosimetry calculation for interstitial PDT.
Keywords: Diffuse optical tomography, Photodynamic therapy, Cylindrical diffusing fiber
1. Introduction
Interstitial photodynamic therapy (PDT) has been used as a treatment modality for prostate cancer (Weersink et al., 2005; Verigos et al., 2006; Windahl et al., 1990; Svanberg et al., 2010; Trachtenberg et al., 2008; Trachtenberg et al., 2007; Du et al., 2006; Patel et al., 2008). During treatment, light sources are inserted into prostate using geometrical template and catheters under image guidance, usually transrectal ultrasound (TRUS), in a fashion similar to the prostate permanent implant treatment. For PDT treatments, current research efforts concentrate on optimizing the light distribution to deliver a uniform and accurate light fluence (Davidson et al., 2009; Axelsson et al., 2009; Altschuler et al., 2005; Johansson et al., 2002; Johansson et al., 2006; Li et al., 2008; Soto Thompson et al., 2005; Zhu et al., 2005b). Spatial distributions of tissue optical properties, namely absorption and reduced scattering coefficients, essentially determine the light distribution, which ultimately affects the PDT efficacy. Therefore, it is of great importance to obtain the spatial distribution of optical properties for interstitial prostate PDT treatment.
Point measurements of optical properties have been obtained in human prostate ex vivo and in vivo (Dickey et al., 2001; Zhu et al., 2005a; Zhu et al., 2003). Although one can obtain spatial distribution of optical properties using the point-by-point method (Dimofte et al., 2005), reconstruction methods to solve the inverse diffusion problem such as those used for the diffuse optical tomography (DOT) (Li et al., 2007; Jiang et al., 2008; Xu et al., 2008; Wang and Zhu, 2009) can greatly improve the spatial resolution and ensure smoothness of the resulting optical properties distribution. Most existing prostate DOT techniques were performed using point-like light sources, which may not be the same as the treatment light source (Li et al., 2007; Jiang et al., 2008; Xu et al., 2008; Wang and Zhu, 2009). Cylindrical diffusing fibers (CDFs) are often used for interstitial prostate PDT (Profio and Doiron, 1987; Sandell and Zhu, 2011), it provides more uniform light fluence distribution when there are highly absorbable media, such as blood, around the light source (Du et al., 2006; Dickey et al., 2004; Weersink et al., 2005; Zhu et al., 2005b). In this paper, we propose an interstitial CDF-DOT method to reconstruct optical properties for prostate PDT using the existing treatment CDFs as light sources. The feasibility of this method is examined using both mathematical and solid prostate phantoms. The ability of using the same CDFs for both optical property measurements and PDT treatments can not only drastically reduce the PDT procedure time but also improve the accuracy of light fluence rate prediction during PDT for the same CDFs.
2. Methods
2.1 Interstitial DOT using CDFs as light sources
The physical model embedded in the interstitial DOT method is based on steady-state light diffusion equation:
| (1) |
where μa (r⃑) (cm-1) is the absorption coefficient distribution, Φ (mW/cm2) is the light fluence rate, D(r⃑) = 1/3μs′(r⃑) (cm) is the diffusion coefficient distribution, and S is the source term. Under the condition that a finite length CDF is embedded in a semi-infinite homogeneous medium, the solution for the light fluence rate Φ at point r⃑ can be expressed by
| (2) |
where μs′ (cm-1) is the reduced scattering coefficient, and (cm-1) is the effective attenuation coefficient. The integration is over the CDF length, and l is the length of the CDF. In our study, the CDFs are considered cylindrically symmetrical. The fluence rate per source strength along the radial axis with respect to the center of the CDF can be described as
| (3) |
where h represents the distance to the point of interest along the radial axis given the center of the CDF as origin.
To recover the heterogeneous optical properties, the calculated light fluence rates are compared with measured light fluence rates and the differences are minimized to extrapolate the distribution of optical properties iteratively. Finite element method (FEM) has been used to build the mesh in 3D geometry using COMSOL (COMSOL AB, SE-111 40, Stockholm, Sweden), and NIRFAST v4 beta has been used to solve the inverse problem for the interstitial DOT (Wang and Zhu, 2009; Dehghani et al., 2009). The 3D mode of the code is used throughout this study. Briefly, with initial values of the optical property distribution, the Jacobian matrix is calculated using an adjoint method (Arridge and Schweiger, 1995) as
| (4) |
where M and N are the numbers of measured absolute light fluence rate data and mesh nodes, respectively. The Jacobian sensitivity matrix can be written as
| (5) |
| (6) |
where Φ(r⃑j,r⃑k) is the direct solution at mesh point r⃑k for source position r⃑j,Φ(r⃑j,r⃑i) is the direct solution at detector position r⃑i for source position r⃑j, and G(r⃑k,r⃑i) is the adjoint solution at mesh point r⃑k for detector position r⃑i. In this adjoint method, an inner product of the field distribution near each mesh vertices in the reconstruction mesh is calculated for building the Jacobian, which made the calculation more efficient. Projection error, which is the summation of the absolute difference square between natural logarithm of calculated light fluence rate and measurements, is used as the quantity to terminate the calculation iterations when a criterion is matched. The termination criteria are either less than 2% change of the projection error or negative optical properties value generated during the iterative calculation.
2.2 Mathematical phantom
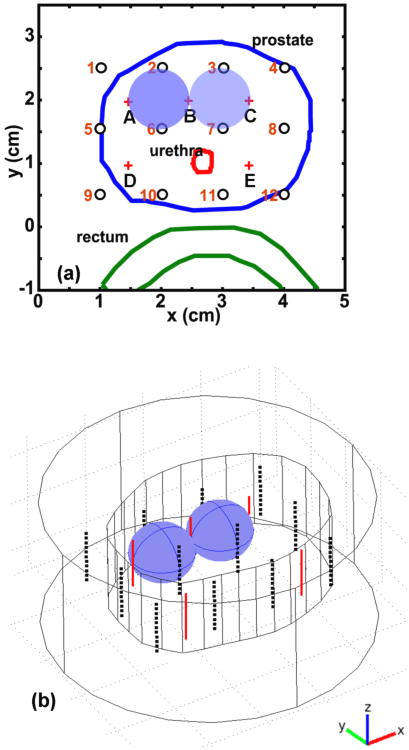
A 3D mathematical phantom has been used to verify the interstitial CDF-DOT method. The prostate phantom contours derived from ultrasound image for a real patient is used as the outline of the mathematical phantom, and an extension of 1 cm is used to generate the z (axial axis) dimension of the phantom, as shown in Figure 1b. To simulate the heterogeneity of the prostate, two anomaly blobs are inserted into the phantom with different optical properties. Figure 1 shows the two anomalies of optical properties with spherical shape and radius of 0.5 cm. An outer medium is placed surrounding the phantom. The optical properties of the background (outer medium and phantom) are set as μs′ = 14 cm-1 and μa = 0.3 cm-1 . For the left anomaly, the μs′ and μa are 14 cm-1 and 0.6 cm-1 respectively, while for the right anomaly μs′ is 28 cm-1 and μa is 0.3 cm-1. The CDF positions are described by red plus signs A-E in Figure 1a and by red solid lines in 3D in Figure 1b. The light detector positions are described by black circles 1-12 in 2D in Figure 1a and by black dots in 3D in Figure 1b. Eleven samples are used for each detector along the z direction, which makes a total number of 132 detector positions used in this study. Only the close CDF-detector pairs (such as A1 and C7 shown in Figure 1a) were used for the reconstruction. The reason is twofold. First, the CDF-detector pairs with further distance (such as pairs A12 and D3) have light fluence rate per source strength close to 0 that is not contributing much to the reconstruction. Second, the NIRFAST that we used in this study may not be able to maintain accuracy for a distance larger than a threshold, such as 2 cm, as discussed in Section 3.1. Thus, total 20 CDF-detector pairs (220 point measurements) were used for the DOT reconstruction. The mesh of the mathematical phantoms contains 199938 elements and 35766 nodes, among which 1298 nodes have been modified to create the anomalies. During the study, a forward calculation was performed to generate the light fluence rate per source strength at each detection location. A random noise 1% was added into the simulated light fluence rate per source strength data. The noisy data were then used for the DOT reconstruction.
Figure 1.
Demonstration of the mathematical phantom. (a) 2D positions of the mathematical phantom contour (blue line), CDFs (red plus signs), and detectors (black circles). (b) 3D positions of mathematical phantom contour (inner irregular shape), outer media (outer cylinder), CDFs (red lines), and detector positions (black dots).
2.3 Experimental solid prostate phantom
A solid phantom embedded with known heterogeneous optical properties was also used to test the feasibility of the interstitial DOT. The solid prostate phantom was prepared by adding carbon black (mean particle size ∼8nm, Raven 5000 Ultra II, Columbian Chemistry Company) ink and Titanium Dioxide (TiO2) (mean particle size ≤44 μm, T-8141, Sigma) into room-temperature-vulcanizing (RTV) solutions with different concentrations for desired optical properties (Pogue and Patterson, 2006). After adding the ink and TiO2, the solution was cured after 24-72 hours under room temperature in molds with designed shapes. Optical and mechanical properties of the phantom are stable for months (Pogue and Patterson, 2006). The base solid phantom has optical properties of μs′ = 15 cm-1 and μa= 0.3 cm-1. After the base solid phantom was cured, 3 anomalies with different optical properties but using the same material were separately prepared and inserted to the base phantom. Their approximate positions are demonstrated in Figure 2b and c. The anomalies have optical properties of μs′= 15 cm-1 and μa= 0.9 cm-1 for anomaly a, μs′= 15 cm-1 and μa= 0.9 cm-1 for anomaly b, and μs′= 15 cm-1 and μa= 0.3 cm-1 for anomaly c. The optical properties of the anomalies as well as the background were designed to test the sensitivity of the interstitial DOT method, and characterized by an established technique using point-like light sources (Dimofte et al., 2005). Ultrasound images were taken from the prostate phantom for every 0.5 cm along the CDF inserting z direction. Contours of the phantom extracted from ultrasound images (as shown in Figure 2a) were used to construct the geometric model for the prostate phantom, as shown in Figure 2c. In the FEM model for the solid prostate phantom, the number of elements is 107046, and the number of nodes is 18471.
Figure 2.
Demonstration of the solid prostate phantom. (a) 2D ultrasound image of solid prostate phantom, including the depicted contour. (b) 2D positions of prostate phantom contour, CDFs (red), and detectors (green). The inserts a, b, and c represent anomalies of optical properties for solid prostate phantom. (c) 3D geometry of solid prostate phantom, locations of CDFs (red), detectors (blue) and anomalies (blue solid).
During the experiments, 12 CDFs were used as light sources with varying lengths among 2, 3, and 4 cm, as shown by “+” and red lines in Figures 2b and 2c, respectively. A 15 W, 732 nm diode laser (Model 730, Diomed, Ltd., Cambridge, United Kingdom) was used to power the CDFs. They were inserted into the prostate phantom through transparent plastic catheters (Flexi-needle, Best medical International, Springfield, VA). A total of 5 transparent catheters were used as detector channels to record the light fluence rate by isotropic detectors (Rare Earth Medical, West Yarmouth, MA), as shown by “o” and dashed blue lines in Figures 2b and 2c, respectively. The catheters were aligned to the prostate phantom by a TRUS template that provided spacing of 0.5cm in cross-section x-y directions, and inserted into the prostate phantom in parallel. During the measurements, CDFs were turned on one by one. When one CDF was on, all 5 isotropic detectors were used to measure the light fluence rate along the CDF using a computer-controlled translation stage. The recorded light fluence rate was then down sampled to 21 points over the scan length of 6 cm at 3 mm intervals for a better processing efficiency. As in the mathematical phantom reconstruction, close CDF-detector pairs (20 pairs and 420 measurements) were used for the DOT reconstruction.
The light fluence rate profile from the isotropic detector scan was used to derive a starting position of the CDF by centering the CDF length manually in MATLAB (The MathWorks, Inc., Natick, MA). The starting positions of the CDFs were then used to construct the 3D geometric model in COMSOL.
3. Results
3.1 NIRFAST validation
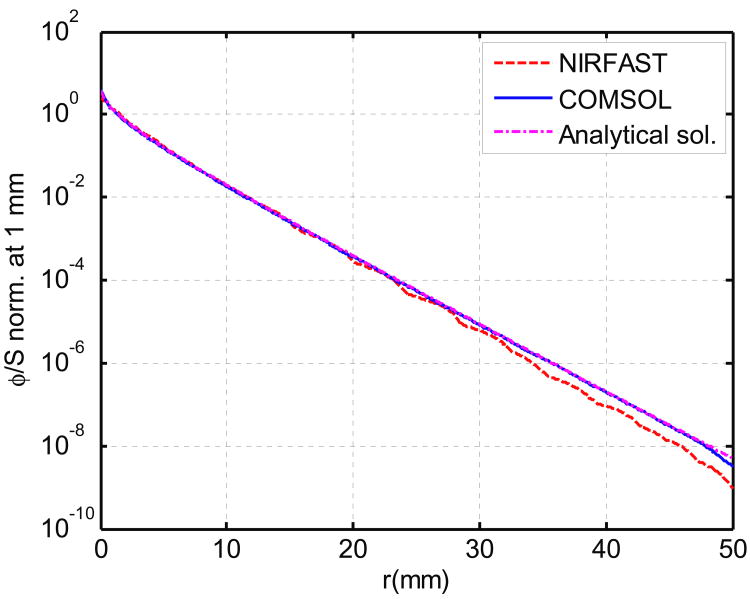
As described above, during the process of reconstructing the optical properties using interstitial CDF-DOT, the forward calculation for light fluence rate is performed by NIRFAST. To validate the accuracy of forward calculation in NIRFAST, forward calculation was performed by both COMSOL and NIRFAST in a simple geometry with a 5 cm long CDF placed in the center of the cylinder with a diameter of 5 cm. Analytical solution according to this geometry is also calculated using Equation 3. Calculated light fluence rate per source strength along the radial axis with respect to the center of the CDF and normalized at 1 mm from all three methods are shown in Figure 3. A mesh with 68076 elements was used for the geometry for calculation in both FEM methods. First, the light fluence rate per source strength calculated from COMSOL is consistent with the analytical solution. Second, the light fluence rate per source strength calculated by NIRFAST is consistent with the other two methods up to 2 cm from the center of CDF. Therefore, if we consider a prostate (or prostate phantom) geometry in the dimension of 3 cm diameter and 5 cm length, and the spacing between CDF-detectors pair is approximately 0.7 cm apart, the NIRFAST can provide reasonable accuracy for the forward calculation.
Figure 3.
Forward calculation of light fluence rate per source strength by analytical solution (magenta dotted curve), NIRFAST (red dashed curve) and COMSOL (blue curve). The results are normalized at 1 mm. The FEM model contains 68076 elements.
3.2 Results from mathematical phantom
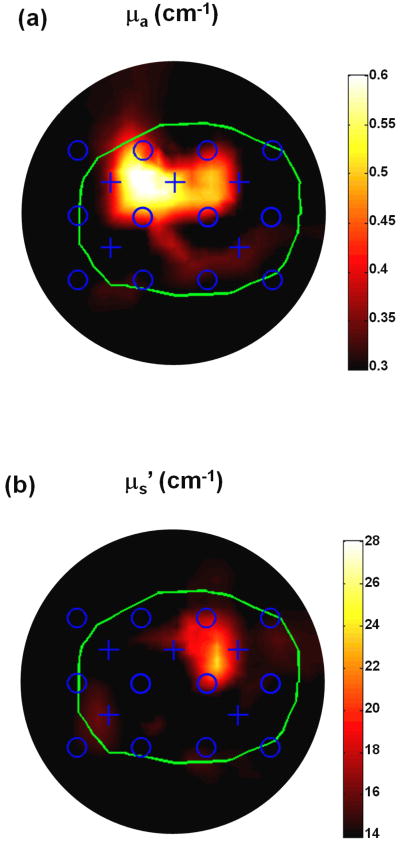
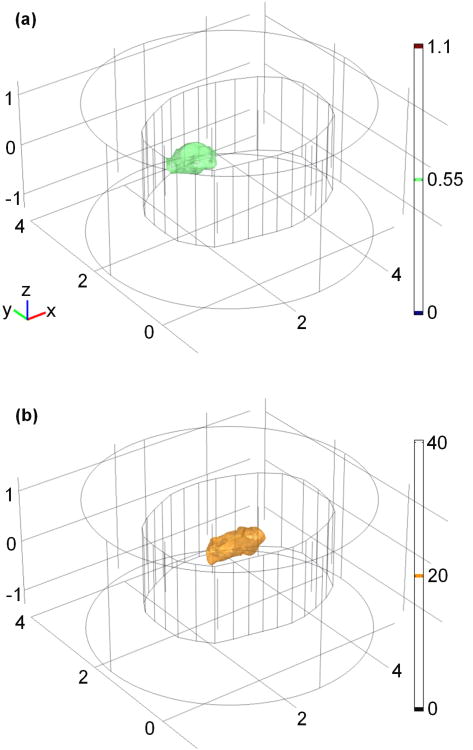
The reconstructed 2D optical property distributions of the mathematical phantom by the DOT method are shown in Figure 4. The reconstructed μa and μs′ spatial distributions at the plane crossing the center of linear sources (z = 0) are shown in the Figure 4a and 4b, respectively. The 2D geometric positions of the reconstructed anomalies correspond well with their actual positions as shown in Figure 1a. A total number of 17 iterations were calculated before termination, and the corresponding computational time is ∼19 minutes on an Intel Dual Core 2.4 GHz and 2GB of RAM desktop computer. The reconstructed optical property distribution is also shown in 3D (Figure 5), in which Figure 5a shows the isosurface for μa = 0.55 cm-1 and Figure 5b shows the isosurface for μs′ = 20 cm-1.
Figure 4.
2D reconstructed optical property distributions by the interstitial DOT.
Figure 5.
Reconstructed (a) μa and (b) μs′ illustration in 3D for the mathematical phantom. Unit for the scale bar is cm-1.
The extrapolated optical properties from the DOT reconstruction results for the mathematical phantom are listed in table 1 quantitatively. True μa and μs′ represent the optical properties used for forward calculation for background and anomalies. Extrap. μa and μs′ represent the mean value of absorption coefficients and reduced scattering coefficient of a 0.6 cm × 0.6 cm cubic of nodes in regions of interest. The region for background is 2.7≤x≤3.3, 0.7≤y≤1.3, and -0.3≤z≤0.3. The region for left anomaly is 1.7≤x≤2.3, 1.7≤y≤2.3, and -0.3≤z≤0.3. The region for right anomaly is 2.9≤x≤3.3, 1.5≤y≤2.1, and -0.3≤z≤0.3. The standard deviations of the optical properties are also shown.
Table 1.
Quantitative results of extrapolate optical properties compared with known values from both mathematical phantom and solid prostate phantom. True μa and μs′ represent the optical properties used for forward calculation (mathematical phantom) or pre-calibrated values (solid phantom) for background and anomalies. Extrap. μa and μs′ represent the mean value of absorption coefficients and reduced scattering coefficient of a 0.6 cm × 0.6 cm cubic of nodes in regions of interest.
| Phantoms | Regions | Trueμa (cm-1) | Extrap.μa (cm-1) | Trueμs′ (cm-1) | Extrap.μs′ (cm-1) |
|---|---|---|---|---|---|
| Math phantom | Background | 0.3 | 0.29±0.05 | 14 | 12.70±1.24 |
| Left anomaly | 0.6 | 0.58±0.02 | 14 | 13.85±0.93 | |
| Right anomaly | 0.3 | 0.38±0.07 | 28 | 20.57±3.34 | |
|
| |||||
| Solid phantom | Background | 0.3 | 0.29±0.01 | 15 | 14.99±0.07 |
| Anomaly a | 0.9 | 1.11±0.58 | 15 | 16.11±13.77 | |
| Anomaly b | 0.9 | 0.97±0.27 | 15 | 13.67±2.47 | |
| Anomaly c | 0.3 | 0.21±0.07 | 15 | 17.57±9.72 | |
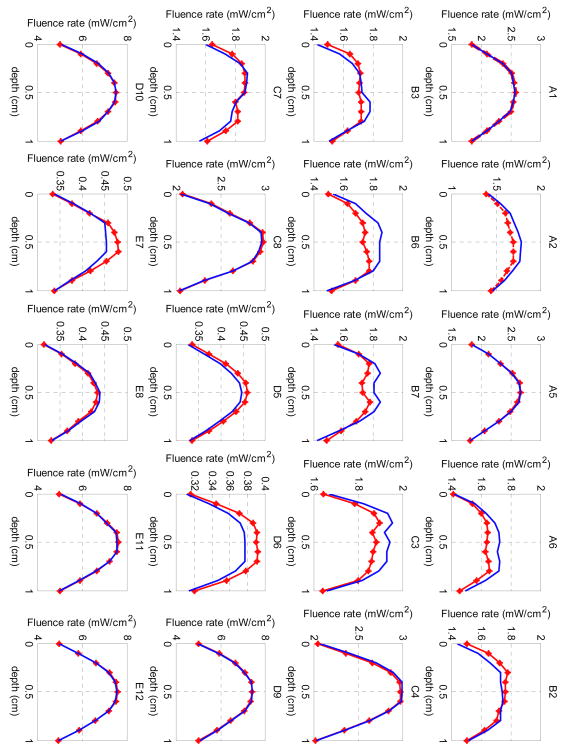
The final projection error from the last iteration of the DOT reconstruction was 0.9. The agreement between the reconstructed and measured fluence rate is shown in Figure 6. The measured data from the NIRFAST forward calculation with 1% random noise are plotted as dotted red lines, while the light fluence rate calculated from the reconstruction is plotted as blue curves. The notations of each source-detection pair correspond to the positions in Figure 1a. The x-axis shows the depth with 11 detection positions.
Figure 6.
Comparison between measured (dotted red lines) and reconstructed (blue lines) light fluence rate per source strength for the mathematical phantom. Each title of the subplot denotes one source-detection pair as shown in Figure 1a.
3.3 Results from solid prostate phantom
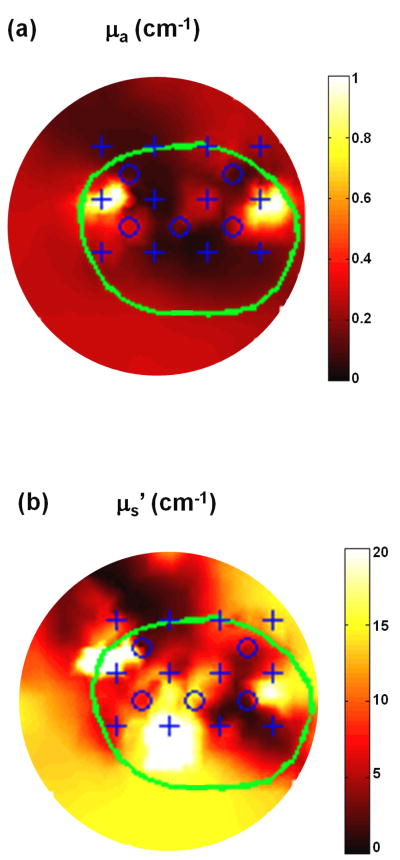
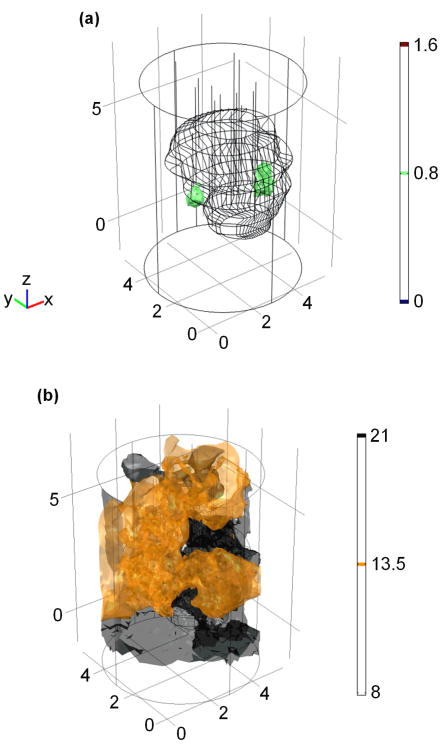
Figure 7a and b show the reconstructed 2D optical property μa and μs′ distribution of the solid prostate phantom by the interstitial DOT method respectively. The depth of the 2D plane is at z = 2 cm. The 2D geometric positions of the reconstructed anomalies correspond well with their actual positions as shown in Figure 2b. A total number of 22 iterations were calculated before termination, and the corresponding computational time is ∼58 minutes on the same computer. The reconstructed optical property distribution is also shown in 3D in Figure 8, where the isosurface shows μa = 0.8 cm-1 (Figure 8a) and μs′ = 13.5 cm-1 (Figure 8b).
Figure 7.
2D reconstructed optical property μa (a) and μs′ (b) distribution for solid prostate phantom. The depth of the 2D plane is at z = 2 cm.
Figure 8.
Reconstructed (a) μa and (b)μs′ illustration in 3D for the solid prostate phantom. Unit for the scale bar is cm-1.
The extrapolated optical properties from the DOT reconstruction results for the solid prostate phantom are also listed in table 1 quantitatively. True μa and μs′ represent the pre characterized optical properties used for fabricating background and anomalies of the phantom. Extrap μa and μs′ represent the mean value of absorption coefficients and reduced scattering coefficient of a 0.6 cm × 0.6 cm cubic of nodes in regions of interest. The region for background is 2.7≤x≤3.3, -0.3≤y≤0.3, and 1.7≤z≤2.3. The region for anomaly a is 1.3≤x≤1.9, 2.7≤y≤3.3, and 1.7≤z≤2.3. The region for anomaly b is 4.4≤x≤5.0, 2.5≤y≤3.1, and 1.7≤z≤2.3. The region for anomaly c is 1.7≤x≤2.3, 1.7≤y≤2.3, and 1.7≤z≤2.3. The standard deviations of the optical properties are also shown.
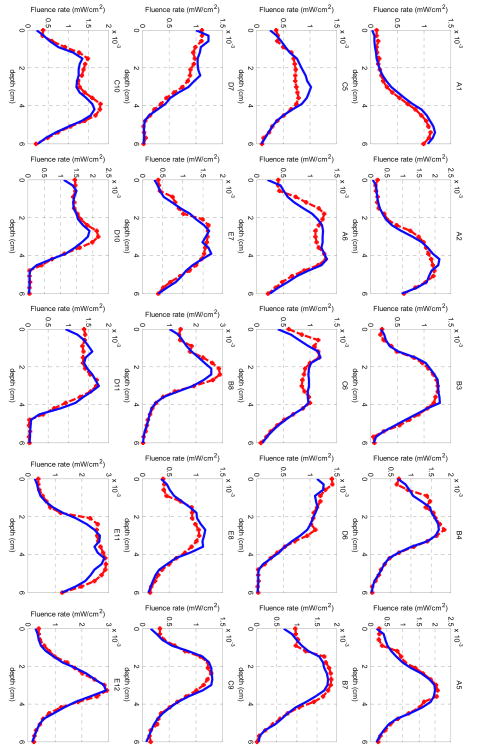
From the interstitial DOT reconstruction on the solid prostate phantom, the final projection error χ2 was 6.2. The measured fluence rate data are plotted as dotted red lines in Figure 9, while the light fluence rate calculated from the last iteration from the reconstruction is plotted as blue curves in the same figure. The x-axis shows the depths in the unit of cm, and each source-detector pair contains 21 data points. The notations of each source-detection pair correspond to the positions in Figure 2b.
Figure 9.
Comparison between measured (dotted red lines) and reconstructed (blue lines) light fluence rate for the DOT reconstruction on the solid prostate phantom. Each title of the subplot denotes one source-detection pair as shown in Figure 2b.
4. Discussion
4.1 Impact from mesh size
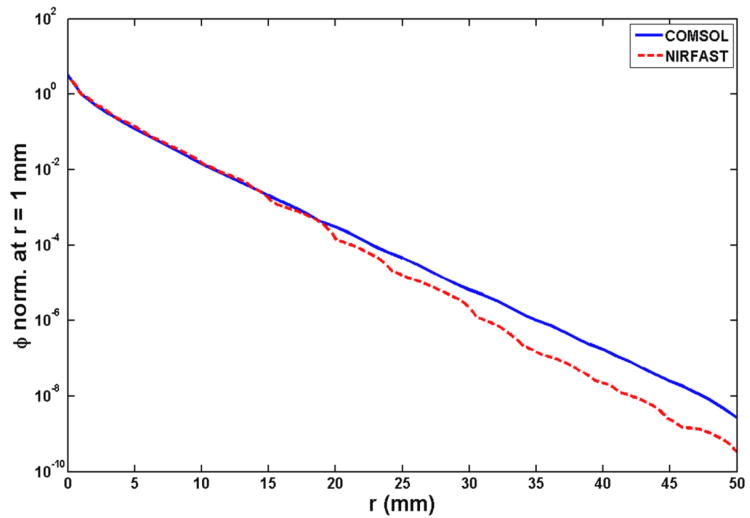
As mentioned in Section 3.1, NIRFAST calculation was validated by comparing with the analytical solution and the COMSOL forward calculation, given the condition that the light detection distance is within 2 cm from the CDF. Another factor affecting the accuracy of forward calculation in NIRFAST is the mesh size in the FEM model. Insufficient number of elements in the FEM model could introduce inaccuracy in forward calculation in NIRFAST. For instance, a forward calculation was carried out using the same geometry as mentioned in Section 3.1, but with only 17688 elements comparing with 68076 elements in the original forward calculation. The calculated light fluence rate per source strength along the radial axis and normalized at 1 mm using both NIRFAST and COMSOL is shown in Figure 10 for 17688 elements. Compared with the original forward calculation shown in Figure 3, the NIRFAST calculation with fewer elements is consistent with COMSOL results for only up to 1.5 cm. Therefore, a sufficient mesh size is needed for the interstitial prostate DOT method.
Figure 10.
Forward calculation of light fluence rate per source strength by NIRFAST (red dashed line) and COMSOL (blue) for 17688 elements in the FEM model. The results are normalized at 1 mm.
On the other hand, finer meshes in the FEM model will increase the processing time without improving the accuracy. This trade-off has been discussed (Musgrove et al., 2007) and can be optimized by evaluating the Jacobian sensitivity against computational resources. Current processing time for the interstitial prostate DOT is in the magnitude of 1 hour on a low-end computer. The current computational limitations could be solved as computing power continues to improve. Hardware acceleration such as using graphic processing unit would also be helpful to decrease the computation time for the interstitial DOT method (Schweiger, 2011).
4.2 DOT reconstruction accuracy
The quantitative interstitial DOT reconstruction results are summarized in table 1. For both mathematical phantom and solid phantom, the largest variation between extrapolated μa and the true μa is 30%, which is found in the anomaly c of the solid phantom reconstruction results. The largest standard deviation for μa is 52%, which is found in the anomaly a of the solid phantom reconstruction results. The largest variation between extrapolated μs′ and the true μs′ is 26%, which is found in the right anomaly of the mathematical phantom reconstruction results. The largest standard deviation for μs′ is 85%, which is found in the anomaly a of the solid phantom reconstruction results. Thus, the reconstruction results from the solid phantom are not as accurate as the results from the mathematical phantom. This mainly is caused by more uncertainties introduced during the measurement procedure of the interstitial DOT.
The μs′ of the background from the solid phantom reconstruction results is right at the pre-calibrated value, but only restricted to the region selected. However, this quantity does not reflect the general μs′ reconstruction, which has a much larger variation and can be discerned from Figure 7b and Figure 8b.
4.3 Impact of CDF retraction position
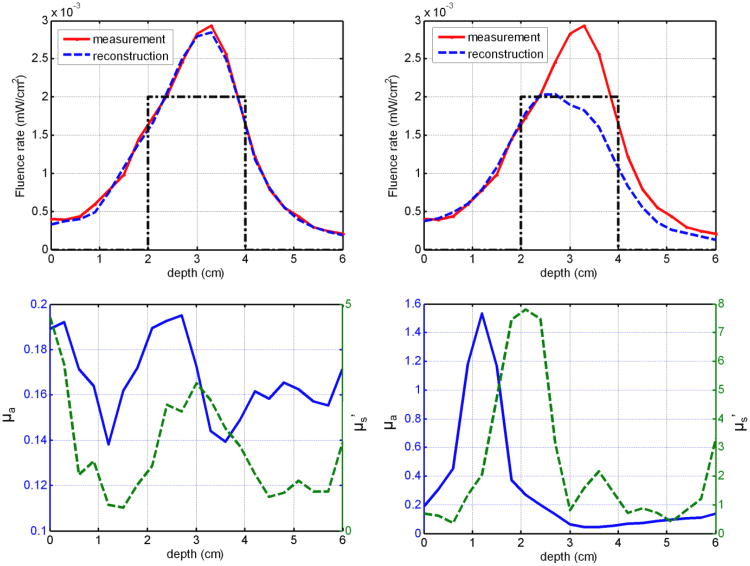
During the interstitial prostate DOT reconstruction, the relative position of the CDFs towards the prostate phantom is of great importance. The positions of the CDFs along axial direction that is parallel to the catheters were determined by the treatment plan. During the experiments, the CDFs were inserted into the prostate phantom through transparent catheters according to the treatment plan. However, errors could exist during the manual insertion, and the position error could make a significant difference in the DOT reconstruction. For example, one source-detector data pair, E12 as shown in Figure 9, was used to reconstruct the optical properties with correct and shifted CDF positions. Figure 11a shows the correct CDF depth position (dotted black line), measured fluence rate data (red line), and the reconstructed light fluence rate (dashed blue line). The reconstructed optical properties at (x = 4.25 cm and y = 2.25 cm as in Figure 2b) are shown in Figure 11c for the correct CDF position. If the CDF depth position was shifted for 1 cm as shown in Figure 11b, the reconstructed optical properties differ greatly from the correct reconstruction as shown in Figure 11d. As a consequence, the reconstructed light fluence rate profile was not able to fit the measured data. This example shows the significance of getting the correct axial position for each CDF.
Figure 11.
Reconstruction uncertainty caused by CDF depth position. (a) Measured (red line) and reconstructed (dashed blue line) light fluence rate profile for source-detection pair E12 under correct CDF position (black line). (b) Measured (red line) and reconstructed (dashed blue line) light fluence rate profile for source-detection pair E12 under shifted CDF position (dotted black line). (c) Reconstructed absorption coefficient (blue line) and reduced scattering coefficient (dashed green line) based on the correct CDF depth positions along position x = 4.25 cm and y = 2.25 cm as shown in Figure 2b. (d) Reconstructed absorption coefficient (blue line) and reduced scattering coefficient (dashed green line) based on the shifted CDF depth along the same positions as (c).
Since treatment plan itself may not be enough to obtain the correct CDF position for DOT reconstruction, a customized program in MATLAB was used to further refine the CDF depth positions for the DOT reconstruction. In this program, the length of the CDF was adjusted and centered to the detected light fluence profile manually.
4.4 Reconstruction accuracy for far CDF-detector pairs
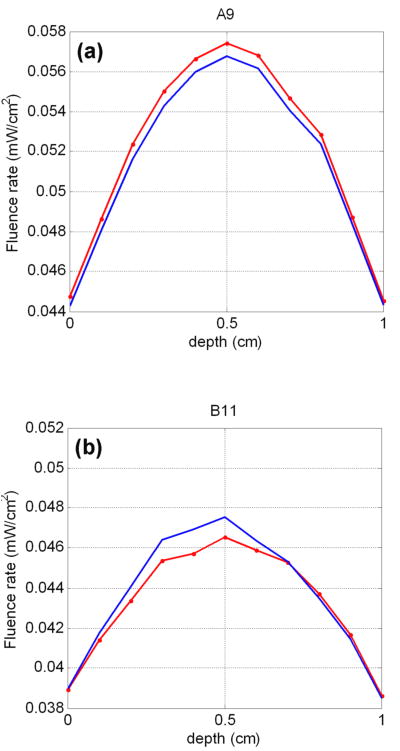
As mentioned in the methods part, only close CDF-detector pairs were used for the CDF-DOT reconstruction. However, since they are used as constrains for DOT, the reconstructed optical properties would naturally create light fluence similar to the measurements between close CDF-detector pairs. On the other hand, reconstructed light fluence from far CDF-detector pairs, comparing with measured light fluence (for solid phantom, but difficult to measure) or calculated light fluence (for a mathematical phantom) may provide some more insight on the accuracy of the reconstructed optical properties. For this purpose, we compared the forward-calculated with the reconstructed light fluence for far pairs A9 and B11 in Figure 12 for the mathematical phantom DOT reconstruction. The results show that the far pairs, although not used as constrains in the reconstruction, also have close measurements (calculated) and reconstructed light fluence, which further validated the accuracy of the CDF-DOT reconstruction results.
Figure 12.
Comparison between measured (dotted red lines) and reconstructed (blue lines) light fluence rate on far CDF-detector pairs for the DOT reconstruction on the mathematical phantom. A9 and B11 denote the CDF-detection pairs as shown in Figure 1a.
4.5 Light fluence dosimetry advantage for CDF-DOT
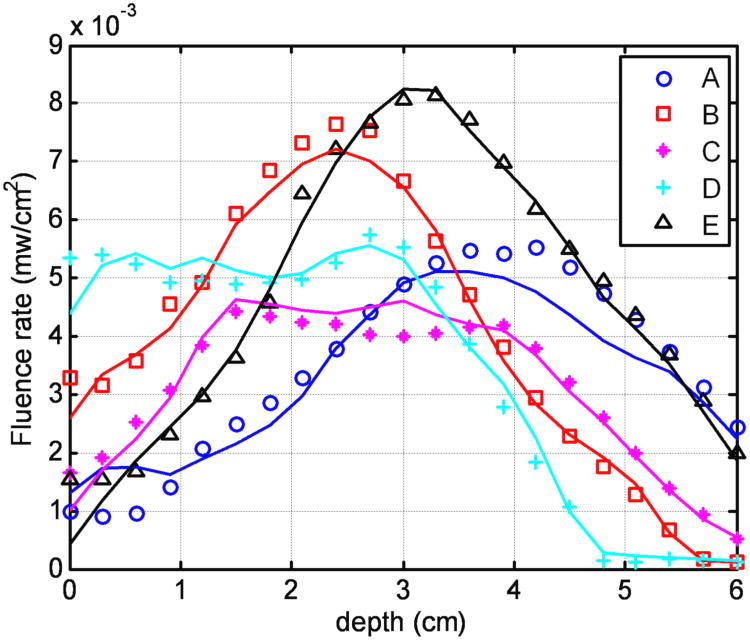
Other than CDF retraction position inaccuracies, other errors are also present, such as insertion positioning error of the CDF and nonuniform light strength distributions of CDF. The catheters inserted into the prostate phantom may not be perfectly parallel to each other according to the treatment plan. Therefore the actual separation among the catheters at the distal tips may not be the same as the separations from the geometrical template. These uncertainties were automatically compensated in the DOT reconstruction. The reason is that even if the reconstructed optical property is different from the true optical property distribution because of these uncertainties, the spatial light fluence rate distribution calculated from the reconstructed optical properties still can successfully match the measured light fluence rate distribution during PDT. Thus the dramatically improve the accuracy of light fluence calculation so long as the same CDFs are used for both DOT measurement and PDT light delivery. Figure 13 shows excellent agreement between the measured and reconstructed light fluence rate profile for each detector scan (A to E) using the DOT reconstructed optical properties, with an error of ±10% for light fluence rate in a heterogeneous prostate phantom.
Figure 13.
Comparison between measured (symbols) and calculated (lines) light fluence rate based on DOT optical properties at each detector locations (A-E) according to Figure 2b. Each curve for one detector is the sum of the light fluence accumulated from the four adjacent channels.
4.6 Comparison with CDF fitting results
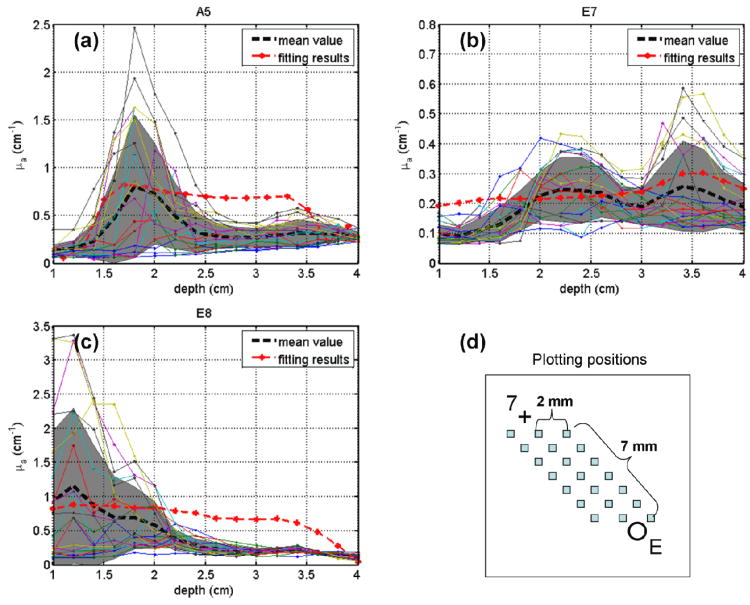
A fitting program has been developed to extract optical properties from measured light profiles for a pair of CDF and detector catheter (Dimofte et al., 2012). The extrapolated absorption coefficients represent an average of the optical properties over whole region between the CDFs and detectors. Reconstructed absorption coefficients by the interstitial DOT are compared with the CDF fitting results for CDF-detector pairs A5, E7, and E8 as shown in Figure 14 a, b and c. The DOT-reconstructed μa values have similar trend (represented by their mean values (black dashed curves) and standard deviations (gray shadows)) along the depth direction as CDF fitted μa values. As seen in Figure 14d, the DOT-reconstructed optical properties are plotted from 21 points in the region between detector E and CDF 7 by the solid color lines, so that they can be compared with the CDF fitting results (dotted red lines), which also represent the optical properties in the whole region between the CDF 7 and detector E. In this region, there are at least 1×1×15 unknown nodes used in the reconstruction. The differences between the results from the two methods may due to (a) the μs′ is constrained to be homogeneous in the CDF fitting program, which is different in DOT reconstruction and (b) DOT reconstruction method involves more constrains from surrounding CDF-detector pairs (for example, pairs B7 and D7 contributes to the reconstruction of optical properties between pair E7), but CDF fitting considers only one CDF-detector data pair. In a previous study, we have shown that the CDF fitting results agree well with an independent point source fitting results (see Fig. 8 of (Dimofte et al., 2012)) as both assume the optical properties within 0.5×0.5×0.5 cm3 are uniform.
Figure 14.
Comparison of absorption coefficient results over depth between interstitial DOT and CDF fitting program for CDF-detector pairs (a) A5, (b) E7, and (c) E8. Red dotted curves represent CDF fitting results. Dashed black curves and gray shadows represent mean values and standard deviation of absorption coefficient over depth (shown by solid color lines), respectively. (d) The locations where the absorption coefficient values were reconstructed by interstitial DOT for CDF-detector pair E7 as an example.
4.7 Other uncertainties
As shown in Figures 7 and 8, the reduced scattering coefficient was not reconstructed well for the interstitial DOT on solid prostate phantom. The main reason is the cross talk between absorption and scattering optical properties under ill conditions (compared with ideal conditions like for the mathematical phantom), which is normal for DOT models and algorithms (González-Rodríguez and Kim, 2009). This problem can be solved by a spatial prior of the prostate, such as structure contoured on TRUS or MRI images (Li et al., 2007; Jiang et al., 2008; Xu et al., 2008). Also under the ill-conditioned solid prostate phantom case, the projection error from the DOT reconstruction is larger than the one from the mathematical phantom reconstruction. 3D contoured anomaly structures in the solid prostate phantom as a spatial prior of the anomaly positions could also help reduce the projection error. Other methods such as discarding certain data pairs or manual adjustment (Liang et al., 2012) may also be helpful to decrease the projection errors.
5. Conclusion
An interstitial DOT method using CDFs as light sources has been developed to reconstruct heterogeneous optical properties in prostate for PDT treatment planning. Both absorption coefficient and reduced scattering coefficient were reconstructed in a good agreement with the measurements from the mathematical phantom results. In the case of the solid prostate phantom, the absorption coefficient was well reconstructed compared with the known values from the phantom fabrication. Although the cross talk exists between the reconstructed reduced scattering and absorption coefficients, the light fluence rate distributions ultimately determining the PDT efficacy were successfully recovered. The advantage for our methodology is the ability to use the CDFs as the light sources for the DOT measurement as well as PDT treatment, which can potentially save the total operation time for the interstitial prostate PDT, and make the online dosimetry possible.
This study demonstrated the feasibility of reconstructing the spatially-evolved optical properties and light fluence rate distributions for the interstitial prostate PDT using CDFs. With the further improvement in the algorithm and computational speed, the real-time prostate PDT dosimetry can be expected in the near future.
Acknowledgments
The authors would like to thank Dr. Hamid Dehghani for revising NIRFAST code to accommodate finite length CDFs and both Dr. Brian Pogue and Dehghani for providing the NIRFAST software. We thank Jarod C Finlay, Xiaodong Zhou, and Andreea Dimofte for help with the phantom measurements. This work is supported by grants from National Institute of Health (NIH P01 CA 87971 and NIH R01 CA154562).
References
- Altschuler MD, Zhu TC, Li J, Hahn SM. Optimized interstitial PDT prostate treatment planning with the Cimmino feasibility algorithm. Med Phys. 2005;32:3524–36. doi: 10.1118/1.2107047. [DOI] [PMC free article] [PubMed] [Google Scholar]
- Arridge SR, Schweiger M. Photon-measurement density functions. Part 2: Finite-element-method calculations. Appl Opt. 1995;34:8026–37. doi: 10.1364/AO.34.008026. [DOI] [PubMed] [Google Scholar]
- Axelsson J, Swartling J, Andersson-Engels S. In vivo photosensitizer tomography inside the human prostate. Opt Lett. 2009;34:232–4. doi: 10.1364/ol.34.000232. [DOI] [PubMed] [Google Scholar]
- Davidson SRH, Weersink RA, Haider MA, Gertner MR, Bogaards A, Giewercer D, Scherz A, Sherar MD, Elhilali M, Chin JL, Trachtenberg J, Wilson BC. Treatment planning and dose analysis for interstitial photodynamic therapy of prostate cancer. Phys Med Biol. 2009;54:2293. doi: 10.1088/0031-9155/54/8/003. [DOI] [PubMed] [Google Scholar]
- Dehghani H, Eames ME, Yalavarthy PK, Davis SC, Srinivasan S, Carpenter CM, Pogue BW, Paulsen KD. Near infrared optical tomography using NIRFAST: Algorithm for numerical model and image reconstruction. Comm Num Meth Eng. 2009;25:711–32. doi: 10.1002/cnm.1162. [DOI] [PMC free article] [PubMed] [Google Scholar]
- Dickey DJ, Moore RB, Rayner DC, Tulip J. Light dosimetry using the P3 approximation. Phys Med Biol. 2001;46:2359. doi: 10.1088/0031-9155/46/9/306. [DOI] [PubMed] [Google Scholar]
- Dickey DJ, Partridge K, Moore RB, Tulip J. Light dosimetry for multiple cylindrical diffusing sources for use in photodynamic therapy. Phys Med Biol. 2004;49:3197. doi: 10.1088/0031-9155/49/14/013. [DOI] [PubMed] [Google Scholar]
- Dimofte A, Finlay JC, Liang X, Zhu TC. Determination of optical properties in heterogeneous turbid media using a cylindrical diffusing fiber. Phys Med Biol. 2012;57 doi: 10.1088/0031-9155/57/19/6025. [DOI] [PMC free article] [PubMed] [Google Scholar]
- Dimofte A, Jarod CF, Zhu TC. A method for determination of the absorption and scattering properties interstitially in turbid media. Phys Med Biol. 2005;50:2291. doi: 10.1088/0031-9155/50/10/008. [DOI] [PMC free article] [PubMed] [Google Scholar]
- Du KL, Mick R, Busch TM, Zhu TC, Finlay JC, Yu G, Yodh AG, Malkowicz SB, Smith D, Whittington R, Stripp D, Hahn SM. Preliminary results of interstitial motexafin lutetium-mediated PDT for prostate cancer. Las Surg Med. 2006;38:427–34. doi: 10.1002/lsm.20341. [DOI] [PubMed] [Google Scholar]
- González-Rodríguez P, Kim AD. Comparison of light scattering models for diffuse optical tomography. Opt Exp. 2009;17:8756–74. doi: 10.1364/oe.17.008756. [DOI] [PubMed] [Google Scholar]
- Jiang Z, Piao D, Xu G, Ritchey JW, Holyoak GR, Bartels KE, Bunting CF, Slobodov G, Krasinski JS. Trans-rectal ultrasound-coupled near-infrared optical tomography of the prostate, Part II: Experimental demonstration. Opt Exp. 2008;16:17505–20. doi: 10.1364/oe.16.017505. [DOI] [PubMed] [Google Scholar]
- Johansson A, Johansson T, Thompson MS, Bendsoe N, Svanberg K, Svanberg S, Andersson-Engels S. In vivo measurement of parameters of dosimetric importance during interstitial photodynamic therapy of thick skin tumors. J Biomed Opt. 2006;11:034029–10. doi: 10.1117/1.2204027. [DOI] [PubMed] [Google Scholar]
- Johansson T, Soto Thompson M, Stenberg M, Klinteberg Ca, Andersson-Engels S, Svanberg S, Svanberg K. Feasibility Study of a System for Combined Light Dosimetry and Interstitial Photodynamic Treatment of Massive Tumors. Appl Opt. 2002;41:1462–8. doi: 10.1364/ao.41.001462. [DOI] [PubMed] [Google Scholar]
- Li C, Liengsawangwong R, Choi H, Cheung R. Using a priori structural information from magnetic resonance imaging to investigate the feasibility of prostate diffuse optical tomography and spectroscopy: A simulation study. Med Phys. 2007;34:266–74. doi: 10.1118/1.2400614. [DOI] [PubMed] [Google Scholar]
- Li J, Martin DA, Hahn SM, Zhu TC. Optimization of light source parameters in the photodynamic therapy of heterogeneous prostate. Phys Med Biol. 2008;53:4107. doi: 10.1088/0031-9155/53/15/007. [DOI] [PMC free article] [PubMed] [Google Scholar]
- Liang X, Wang KKh, Zhu TC. Characterization of tissue optical properties for prostate PDT using interstitial diffuse optical tomography. Proc SPIE. 2012;8210:82100C. doi: 10.1117/12.908294. [DOI] [PMC free article] [PubMed] [Google Scholar]
- Musgrove C, Bunting CF, Dehghani H, Pogue BW, Piao D. Computational aspects of endoscopic (trans-rectal) near-infrared optical tomography: initial investigations. Proc SPIE. 2007;6434:643409–10. [Google Scholar]
- Patel H, Mick R, Finlay J, Zhu TC, Rickter E, Cengel KA, Malkowicz SB, Hahn SM, Busch TM. Motexafin Lutetium-Photodynamic Therapy of Prostate Cancer: Short-and Long-Term Effects on Prostate-Specific Antigen. Clin Can Res. 2008;14:4869–76. doi: 10.1158/1078-0432.CCR-08-0317. [DOI] [PMC free article] [PubMed] [Google Scholar]
- Pogue BW, Patterson MS. Review of tissue simulating phantoms for optical spectroscopy, imaging and dosimetry. J Biomed Opt. 2006;11:041102-1–16. doi: 10.1117/1.2335429. [DOI] [PubMed] [Google Scholar]
- Profio AE, Doiron DR. Transport of Light in Tissue in Photodynamic Therapy. Photochem Photobiol. 1987;46:591–9. doi: 10.1111/j.1751-1097.1987.tb04819.x. [DOI] [PubMed] [Google Scholar]
- Sandell JL, Zhu TC. A review of in-vivo optical properties of human tissues and its impact on PDT. J Biophot. 2011;4:773–87. doi: 10.1002/jbio.201100062. [DOI] [PMC free article] [PubMed] [Google Scholar]
- Schweiger M. GPU-Accelerated Finite Element Method for Modelling Light Transport in Diffuse Optical Tomography. Int J Biomed Imag. 2011;2011:403892. doi: 10.1155/2011/403892. [DOI] [PMC free article] [PubMed] [Google Scholar]
- Soto Thompson M, Johansson A, Johansson T, Andersson-Engels S, Svanberg S, Bendsoe N, Svanberg K. Clinical system for interstitial photodynamic therapy with combined on-line dosimetry measurements. Appl Opt. 2005;44:4023–31. doi: 10.1364/ao.44.004023. [DOI] [PubMed] [Google Scholar]
- Svanberg K, Bendsoe N, Axelsson J, Andersson-Engels S, Svanberg S. Photodynamic therapy: superficial and interstitial illumination. J Biomed Opt. 2010;15:041502–10. doi: 10.1117/1.3466579. [DOI] [PubMed] [Google Scholar]
- Trachtenberg J, Bogaards A, Weersink RA, Haider MA, Evans A, McCluskey SA, Scherz A, Gertner MR, Yue C, Appu S, Aprikian A, Savard J, Wilson BC, Elhilali M. Vascular Targeted Photodynamic Therapy With Palladium-Bacteriopheophorbide Photosensitizer for Recurrent Prostate Cancer Following Definitive Radiation Therapy: Assessment of Safety and Treatment Response. The Journal of Urology. 2007;178:1974–9. doi: 10.1016/j.juro.2007.07.036. [DOI] [PubMed] [Google Scholar]
- Trachtenberg J, Weersink RA, Davidson SRH, Haider MA, Bogaards A, Gertner MR, Evans A, Scherz A, Savard J, Chin JL, Wilson BC, Elhilali M. Vascular-targeted photodynamic therapy (padoporfin, WST09) for recurrent prostate cancer after failure of external beam radiotherapy: a study of escalating light doses. BJU Int. 2008;102:556–62. doi: 10.1111/j.1464-410X.2008.07753.x. [DOI] [PubMed] [Google Scholar]
- Verigos K, Stripp DCH, Mick R, Zhu TC, Whittington R, Smith D, Finlay ADJ, Busch TM, Tochner ZA, Malkowicz SB, Glatstein E, Hahn SM. Updated Results of a Phase I Trial of Motexafin Lutetium-Mediated Interstitial Photodynamic Therapy in Patients with Locally Recurrent Prostate Cancer. J Environ Pathol Toxicol Oncol. 2006;25:373–87. doi: 10.1615/jenvironpatholtoxicoloncol.v25.i1-2.230. [DOI] [PubMed] [Google Scholar]
- Wang KKH, Zhu TC. Reconstruction of in-vivo optical properties for human prostate using interstitial diffuse optical tomography. Opt Exp. 2009;17:11665–72. doi: 10.1364/oe.17.011665. [DOI] [PMC free article] [PubMed] [Google Scholar]
- Weersink RA, Bogaards A, Gertner M, Davidson SRH, Zhang K, Netchev G, Trachtenberg J, Wilson BC. Techniques for delivery and monitoring of TOOKAD (WST09)-mediated photodynamic therapy of the prostate: Clinical experience and practicalities. J Photochem Photobiol B: Biol. 2005;79:211–22. doi: 10.1016/j.jphotobiol.2005.01.008. [DOI] [PubMed] [Google Scholar]
- Windahl T, Andersson SO, Lofgren L. Photodynamic therapy of localised prostatic cancer. The Lancet. 1990;336:1139. doi: 10.1016/0140-6736(90)92626-s. [DOI] [PubMed] [Google Scholar]
- Xu G, Piao D, Musgrove CH, Bunting CF, Dehghani H. Trans-rectal ultrasound-coupled near-infrared optical tomography of the prostate, Part I: Simulation. Opt Exp. 2008;16:17484–504. doi: 10.1364/oe.16.017484. [DOI] [PubMed] [Google Scholar]
- Zhu TC, Dimofte A, Finlay JC, Stripp D, Busch T, Miles J, Whittington R, Malkowicz SB, Tochner Z, Glatstein E, Hahn SM. Optical Properties of Human Prostate at 732 nm Measured In Vivo During Motexafin Lutetium-mediated Photodynamic Therapy. Photochem Photobiol. 2005a;81:96–105. doi: 10.1562/2004-06-25-RA-216. [DOI] [PMC free article] [PubMed] [Google Scholar]
- Zhu TC, Finlay JC, Hahn SM. Determination of the distribution of light, optical properties, drug concentration, and tissue oxygenation in-vivo in human prostate during motexafin lutetium-mediated photodynamic therapy. J Photochem Photobiol B: Biol. 2005b;79:231–41. doi: 10.1016/j.jphotobiol.2004.09.013. [DOI] [PMC free article] [PubMed] [Google Scholar]
- Zhu TC, Hahn SM, Kapatkin AS, Dimofte A, Rodriguez CE, Vulcan TG, Glatstein E, Hsi RA. In vivo Optical Properties of Normal Canine Prostate at 732 nm Using Motexafin Lutetium–mediated Photodynamic Therapy. Photochem Photobiol. 2003;77:81–8. doi: 10.1562/0031-8655(2003)077<0081:ivopon>2.0.co;2. [DOI] [PubMed] [Google Scholar]


