Abstract
We have acquired 2-D and 3-D microwave tomographic images of the calcaneus bones of two patients to assess correlation of the microwave properties with X-ray density measures. The two volunteers were selected because each had one leg immobilized for at least six weeks during recovery from a lower leg injury. A soft-prior regularization technique was incorporated with the microwave imaging to quantitatively assess the bulk dielectric properties within the bone region. Good correlation was observed between both permittivity and conductivity and the computed tomography-derived density measures. These results represent the first clinical examples of microwave images of the calcaneus and some of the first 3-D tomographic images of any anatomical site in the living human.
Index Terms: Bone, bone density, dielectric properties, fracture risk, microwave imaging, osteoporosis
I. Introduction
Bone disease is a major health problem in the U.S., which can lead to substantial changes in quality of life for the elderly and is quickly becoming one of the more important drivers of increasing national health care costs. Approximately, 50% of women and 25% of men in the U.S. over 50 years old will have an osteoporosis-related bone fracture [1]. The most vulnerable sites for fractures are in the hip, spine, wrist, and ribs. Injuries in the hip and spine can require long-term chronic care at significant expense. In fact, the mortality rate for complications stemming from hip fractures can be as high as 24% [1]. While current methods such as dual-energy X-ray absorptiometry (DXA) provide an important level of screening, clinical care based solely on bone density to determine overall fracture risk has well documented limitations [2], [3]. For instance, in a study of postmenopausal women with insufficiency fractures, almost 60% did not have DXA-confirmed osteoporosis [4].
Hip fractures are already among the most common injuries in postmenopausal women, specifically women of western European descent living in urbanized areas [5]–[7]. As a result, osteoporosis is a major contributor to the health care costs associated with this population and as life expectancy increases so will the prevalence of the disease. The health care cost for osteoporosis-related fractures is estimated to be $18 billion per year in 2002 dollars. As the world’s population ages, osteoporosis may become the single most significant disease which results in a sudden and immediate change to lifestyle similarly to that of a major cardiac event [5], [8]–[14]. The financial burden of osteoporosis is expected to rise significantly given overall health care cost increases and general population aging.
Current methods to detect osteoporosis or assess bone fracture risk include bone mineral density (BMD) exams—primarily DXA [15]. In clinical practice, these exams are performed at the most critical anatomical sites, e.g., the hip, spine, wrist, and ribs. In general, the trabecular bone at these locations has a eightfold higher turnover rate than cortical bone; therefore, age and disease-related bone loss is more apparent at earlier stages in cancellous bone [3], [16]. While this technique provides a measure of the bone mass, it does not offer insight into bone structure or biology which are regarded as important components of bone health [15]. In fact, BMD values overlap for high and low fracture risks [15], [17]. In addition, and of particular concern, X-ray dose in critical locations such as the hip from routine screenings can pose long-term health challenges [15]. Ultrasound has also been investigated as an alternative for bone imaging largely because of its lower health risks relative to X-rays [16], [18]. In these tests, the patient’s heel is placed in a portable bath and illuminated with a low power ultrasound signal in a transmission configuration through the calcaneus bone to recover measures of the speed of sound (SOS) and broadband attenuation in the heel. These properties have been shown to correlate with overall patient fracture risk [17], [19], [20]. While promising, the technique has not been widely accepted in clinical practice. Despite efforts to improve public awareness of the device and the importance of bone health, patients are referred for DXA exams for more definitive clinical assessments.
Active microwave imaging has been of interest in medical applications for some time [21]–[24]. The largest and most sustained effort has probably been in breast cancer imaging where both tomographic [25]–[32] and radar [33]–[35] methods have been applied. Tomographic techniques have been able to reliably detect tumors as small as 1 cm in diameter [36]. However, the sensitivity of microwave imaging to small lesions may not be its primary strength. More recent efforts to monitor response to breast cancer chemotherapy indicate that dielectric property changes occur before shrinkage of the tumor is evident suggesting that they are sensitive to early physiological alterations resulting from therapy. For these reasons, dielectric property monitoring may be well suited to applications in bone imaging [37], [38] because bone physiology changes dramatically during the aging process and disease progression. Recently, Peyman et al. performed an in vitro study of porcine cortical and cancellous bone and showed a definite correlation between bone dielectric properties and age [39], [40]. While corresponding mineral density measurements were not acquired during these experiments, the changes observed were likely associated with the normal demineralization processes of aging [41]–[43]. We have recently performed studies on ex vivo porcine bone samples and demonstrated significant correlation between dielectric properties and bone volume fraction [44]. These investigations set the stage for applying microwave imaging technologies to clinical bone imaging [45]–[47].
In this preliminary study, we used our microwave tomography system to image the heels of two patients who had one leg injured and required reduced weight bearing for several weeks during the healing process. Studies have shown that trabecular-rich bones such as those in the ankle and calcaneus undergo dramatic changes in mineralization levels—decreases as much as 35%— when patients reduce weight bearing for six weeks or more [48]–[50]. Other studies evaluating the effects of gravitation on the human skeletal system have shown average changes of 1–10% from bed rest for 60 days to 17 weeks [51], [52]. In these reports, the highest levels of bone loss occurred in the hip and calcaneus compared to the whole body where much lower values were noted. Because substantial bone density changes occur in the calcaneus during injury recovery, it has become the target of numerous investigations because of its potential to serve as a surrogate for systemic bone changes (it is both weight bearing and contains primarily trabecular bone). The calcaneus is also distal to the central organs, and is relatively easy to access for examinations relative to other vulnerable bone sites. These attractive characteristics of the calcaneus as a bone density monitoring site also hold true for microwave tomography with the additional advantage that the heel region is comparable to the allotted breast size in our microwave imaging system and could easily be examined with minor modifications to this scanner.
In these studies, we imaged both patient heels with computed tomography (CT) and microwave tomography immediately after the patient had a cast (or alternative support) removed to capture changes in the heel of the injured leg. The CT scans were used to register the bone shape, size, and orientation in the microwave illumination tank. We applied an imaging algorithm with softprior regularization which allows us to recover accurately the bulk dielectric properties in selected zones such as the calcaneus [53]. The CT images were also used to quantify density differences between the ipsilateral and contralateral calcanei. In addition, we acquired ultrasound densitometry measures of the heels to compare with the microwave images. Finally, we report both 2-D images of multiple planes along with full 3-D volumetric images of the heels. A small subset of the results shown here (one 2-D microwave image from one subject) were presented in Golnabi et al. [54] as an illustration of microwave heel imaging. To the best of our knowledge, these results represent the first microwave exams of the heel, and more importantly, some of the first clinical 3-D microwave tomographic images of any living human anatomy.
II. Methods
A. Support Fixture and Coregistration
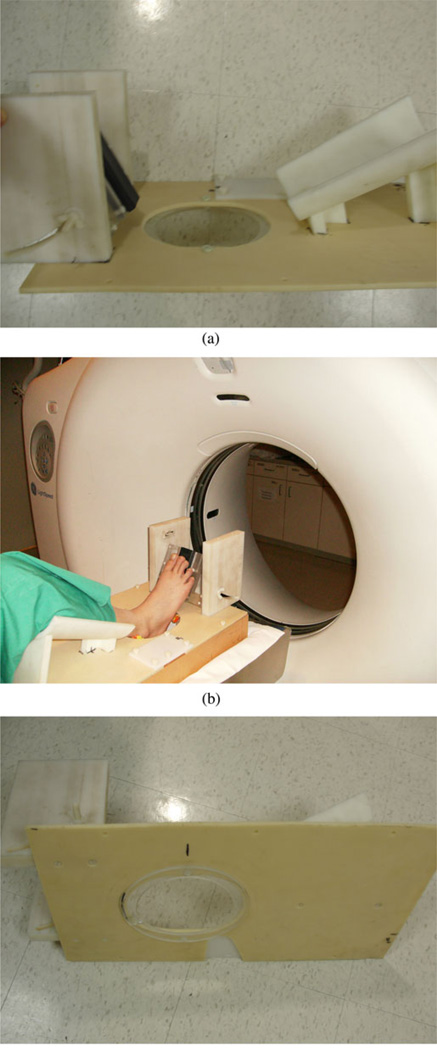
The soft-prior image reconstruction algorithm incorporates structural information about the tissue being imaged. Ideally, we would image the heel simultaneously in both the microwave tomography and CT systems; however, the logistical challenges of integrating these scanners at this time are considerable. Fortunately, the anatomy of the heel is relatively rigid and can be reasonably replicated from one exam to the next. To exploit its rigidity, we designed a common imaging fixture to support the lower leg in the same position during both the microwave tomography and CT imaging sessions. For the CT exam, the patient lies down with the knee bent and leg resting on the support. The heel extends through an aperture in the mounting plate during the scanning process [see Fig. 1(a)]. The fixture is supported by two Plexiglas rails which provide room for the heel to protrude below the fixture plate surface [see Fig. 1(b)]. An additional Plexiglas annulus is attached to the underside surface of the plate and fits directly into the top plate of the microwave imaging system [see Fig. 1(c)]. This plate is visible in the CT scans and provides the main feature for registration with the microwave exams.
Fig. 1.
Photographs of the heel imaging fixture: (a) isolated side view, (b) patient’s heel being imaged in the GE Lightspeed 16 CT Scanner with the side support rails visible, and (c) coupling annulus on the underside of the platform.
B. CT Exams
As part of each patient visit, both heels were imaged in the GE Lightspeed 16 CT Scanner at Dartmouth-Hitchcock Medical Center (DHMC). Subjects participated under informed consent in a protocol approved by the Dartmouth IRB. Patients rested supine on the scanner bed with each leg supported in the registration fixture. Full volumetric images were acquired of the heel region with most of the tissue pendant below the aperture. A voxel size of 0.625 mm was used in each direction. Three-dimensional imaging zones were generated from the outline of the heel and were transformed into 2-D finite element mesh reconstruction regions. In addition to the external boundary, this data also included the delineation of internal structures— primarily the boundaries between the bones and surrounding soft tissue. The soft-prior meshes were subsequently defined from this information.
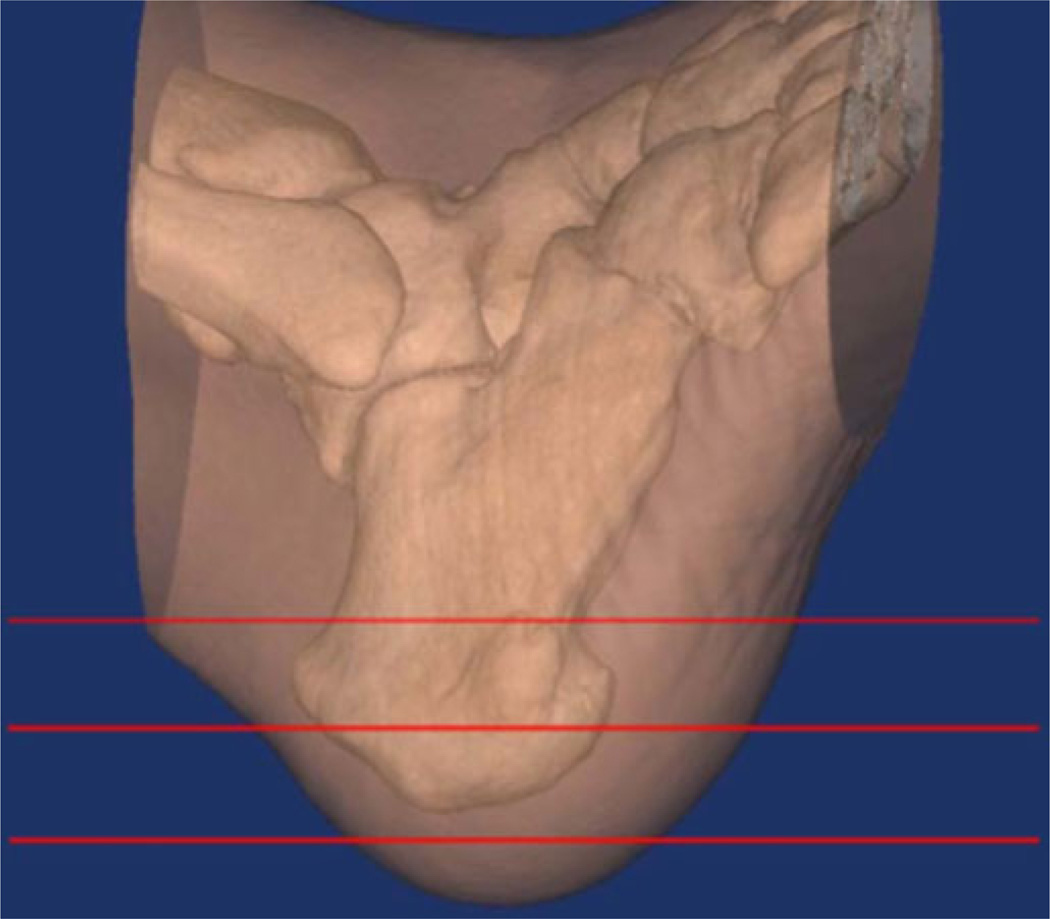
The CT data also provided estimates of bone density. Fig. 2 shows a semitransparent 3-D representation of the heel and ankle region from the first patient with the bones clearly visible within the soft tissue. The radiologist (DG) extracted representative 2-D slices through the image volume to compute associated bone density measures based on the scanner software estimates of the Hounsfield values for the regions identified. These values were used to assess the level of correlation between the microwave metrics and bone density for the ipsilateral and contralateral heels. The Hounsfield values are sensitive to the relative amounts of fat and water in the interrogated zone which are relevant to the microwave image comparison because we are interested in the properties of the composite osseous tissue. Given the natural heterogeneity of the calcaneus, care was taken to utilize regions of interest (ROI) of the same size (the corresponding locations were within 3 mm of each other). Comparisons between patients may be qualitatively useful but cannot be considered quantitative because common ROI locations and scanner settings could not be guaranteed between patients. While variability in marrow and fat in the trabecular regions will reduce the accuracy of these Hounsfield values as measures of bone density, the heel assessments benefit from far less surrounding soft tissue which can substantially confound similar evaluations at more internal locations such as the spine and hip [2].
Fig. 2.
Semitransparent CT view of the first patient’s heel and ankle region with horizontal line overlays indicating the associated microwave imaging planes.
C. Ultrasound Measures
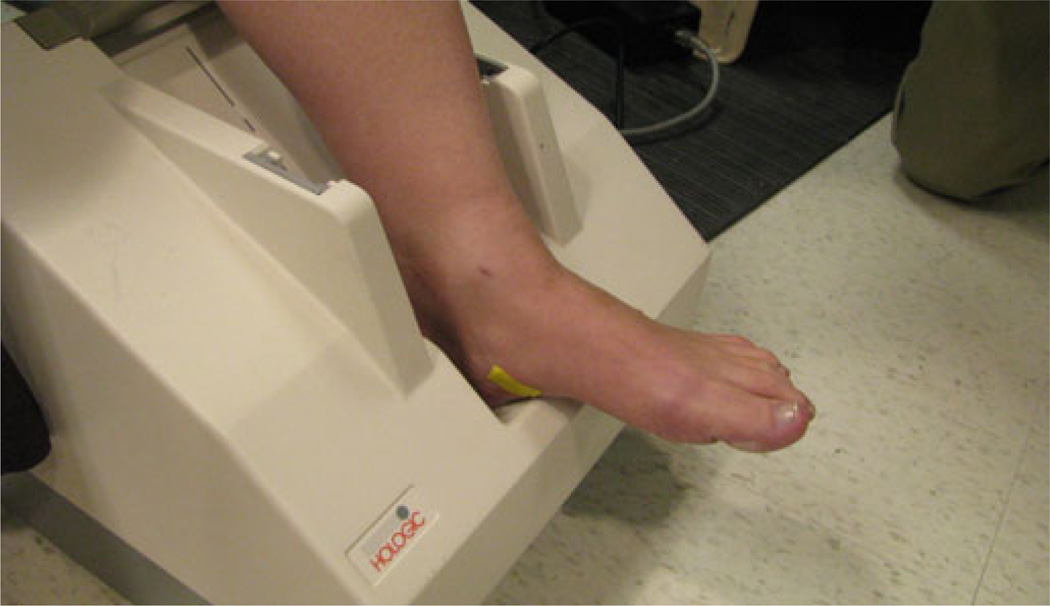
At each patient visit, we acquired ultrasound densitometry measures of both patient heels using a Hologic (Bedford, MA) Sahara Clinical Bone Sonometer (see Fig. 3). For this exam, patients rest comfortably in a chair with their foot positioned in the opening. Two ultrasound transducers slowly contact the heel region from the sides and record ultrasound transmission data in under 30 s. Using this information, the system calculates the SOS and broadband ultrasonic attenuation (BUA) from which it derives an ultrasound-based BMD measurement. The system output consists of the BMD measure and a T-score reflecting how many standard deviations the measure is from the mean. Clinical studies have shown that the BUA and SOS measures correlate with BMD obtained from DXA techniques with coefficients of R = 0.82 and R = 0.85, respectively [3].
Fig. 3.
Photograph of the first patient’s heel being measured in the Sahara Clinical Bone Sonometer.
D. Microwave Imaging
An important component of our microwave hardware is the monopole antenna element used in the imaging array. While its radiation pattern is not directional, the monopole design offers advantages in terms of wide operating bandwidth, minimal mutual coupling between elements, multipath signal suppression, and proximity to the target. Because of the resistive loading of the coupling medium, the bandwidth of the antennas extends from 500 MHz to 3 GHz [55] (which facilitates phase unwrapping of the measurement data used in our log transformed image reconstruction [56]). Techniques for mutual coupling compensation between adjacent elements which is specific to this antenna design [57], [58] and analyses demonstrating sufficient multipath suppression with the monopole [59], which can be debilitating in many near-field applications, are available. Proximity to the imaging target minimizes signal transmission loss, improves image quality [60], and more than compensates for the lack of directivity; thus, the physical dimensions/shape of the antenna enables packing fractions that are hard to achieve with other more directional radiators at these frequencies.
Antennas are positioned on a circular array and mechanically moved (vertically) to provide full volume coverage of the target in the installation used here. The hybrid electronic switching/mechanical motion system represents a practical tradeoff between performance and cost (each custom receive channel is moderately expensive because of its isolation and dynamic range requirements, whereas the motion system is a relatively inexpensive means of reusing these channels at different positions without adding substantially to overall data acquisition time [61]). The dynamic range required for medical microwave imaging (from −40 to −135 dBm) is not typically available from commercial network analyzers; hence, a custom multichannel system was developed not only to measure the lower signal levels, but also to maintain high channel-to-channel isolation at the −135 dBm threshold. The cylindrical array geometry has been used extensively for medical imaging [25], [62], [63], and also for examining external limbs [64].
The measurement data acquired are used in conjunction with a Gauss–Newton iterative imaging algorithm which applies a variance-stabilizing logarithmic transformation [56], [65] that offers advantages over conventional (nontransformed) formulations [65], such as superior convergence behavior [66]–[68]. The phase unwrapping that is required under log transformation is accomplished through spatial analyses of the computed field distributions and spectral (frequency) analyses of measured values over the operating band of the antenna array [56].
E. Soft-Prior Regularization
Soft-prior regularization was first developed in the near infrared imaging community [69] and is designed to exploit prior spatial information to improve the property recovery of specific regions within the imaging zone. It is distinct from other a priori techniques in that it makes no assumptions about the target property distribution, and only encodes the geometric features that are identified. By segmenting the internal target structures of interest, it rewards property distributions within each zone that are relatively uniform but allows sharp gradients across neighboring tissue boundaries—for instance, between bone and soft tissues. In this case, we had access to the CT images of each heel for deriving its internal structures and used the leg fixture described in Section II-A to achieve reasonable image alignment between the microwave and CT exam sessions. To date, our regularization approach has been developed and validated in 2-D through a series of simulation, phantom, and breast exams [53], although the approach is equally applicable to 3-D imaging.
F. Mesh Generation
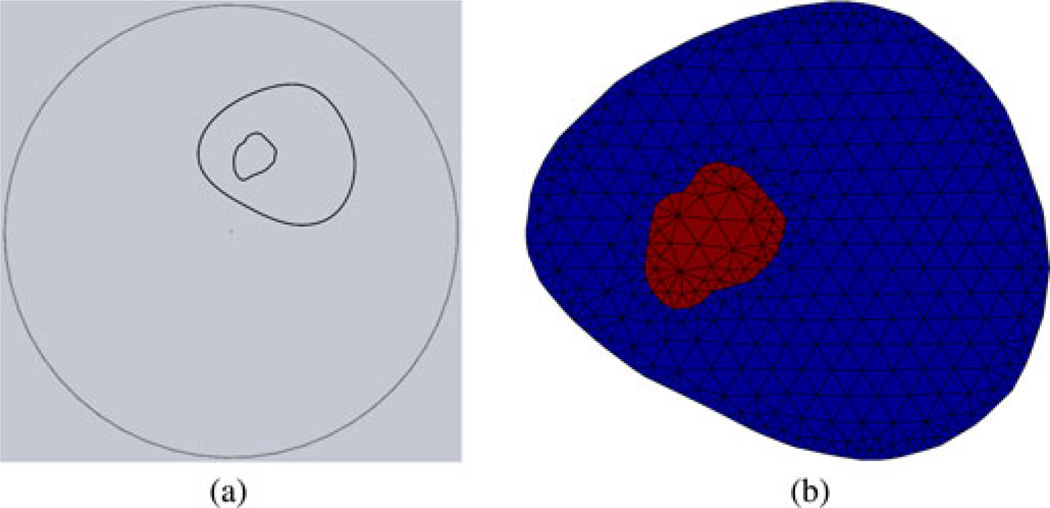
For the 2-D finite-difference time domain (FDTD) computations without soft priors, we formed an external perimeter for the parameter reconstruction mesh by defining a series of closely spaced loci on a 13.5-cm diameter circle. We then created a uniform, triangle-based mesh (except for the boundary) with the desired node spacing (559 nodes and 1044 elements). For the 2-D soft-prior mesh, we imported the desired CT image slice into the Mimics software package (MaterializeNV, Leuven, Belgium) and generated a 3-D volume, as shown in Fig. 2. This structure was then transferred to SolidWorks (SolidWorks Corporation, Concord, MA) where the surfaces of the segmented zones were smoothed. From this structure, representative planes were generated with the corresponding outlines of the heel and calcaneus within the circular antenna array [see Fig. 4(a)]. We applied a custom 2-D mesh generator to this geometry to create a two-zone segmented mesh comprising just the cross section of the heel [see Fig. 4(b)]. For the 3-D FDTD reconstruction mesh, we first defined the cylinder height and diameter and the average nodal spacing. Our internal mesh generation program computed a 3-D mesh comprised primarily of equilateral tetrahedrons except for the less uniform ones along the outer surfaces and edges of the cylinder.
Fig. 4.
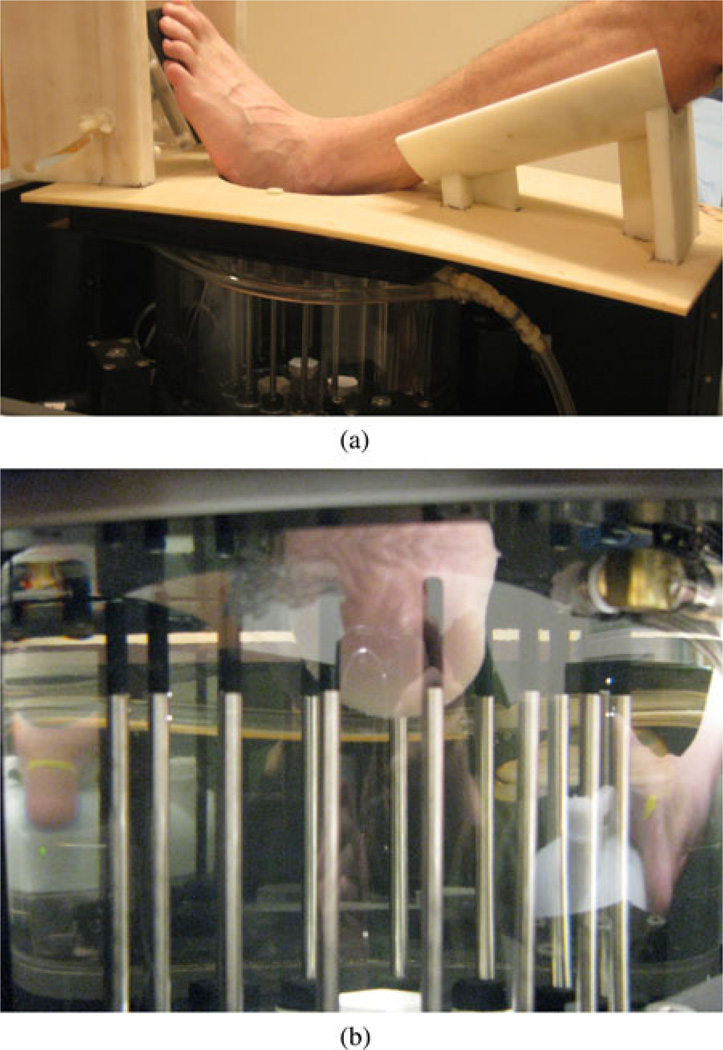
Photographs of the second patient being imaged in the microwave tomography system: (a) patient’s leg resting in the fixture with the heel protruding through the aperture into the imaging tank below, and (b) close-up of the heel in the illumination zone and surrounded by the monopole antenna array.
III. Results
In this section, we describe the results from imaging exams on two patients, each of whom had one leg partially supported by an external device (in this case a walking boot) for at least six weeks. Section III-A shows recovered 2-D and 3-D images for a representative exam. Sections III-B and III-C describe the images for the two patient cases in more detail and present their respective 2-D soft-prior results and their correlation with the CT-based Hounsfield and ultrasound bone density measures.
To conduct these exams, we adapted the clinical microwave breast imaging system installed at DHMC for data acquisition. The system parameters applied include 1) 16 monopole antennas evenly spaced on a 15.2-cm diameter circle, 2) 240 pieces of measurement data collected at each plane and each frequency (16 transmitters × 15 receivers per transmitter), 3) data recorded at four vertical planes separated by 1 cm, 4) 80:20 glycerin:water mixture used as the coupling bath, and 5) measurements obtained for five operating frequencies from 900 to 1700 MHz in 200 MHz increments. Fig. 5 shows two views of the heel being imaged in the microwave system. All images were reconstructed using a Gauss–Newton iterative scheme with a variance stabilizing logarithm transformation [56], [65]. For the reconstructions presented in the following sections, several computational techniques were utilized: 1) 2-D FDTD, 2) 2-D FDTD with a soft-prior regularization [53], and 3) full 3-D FDTD. In each case, the field solutions and the image recovery were computed on separate meshes or grids by applying our dual-mesh strategy which is compatible with any type of field equation solver [57], [58]. For the 2-D FDTD case, the field solutions were computed on a square grid with 110 nodes on each side and a spacing of 1.6 mm with 12 perfectly matched layers (PMLs) on each side. The circular reconstruction mesh representing the field of view of the imaging array consisted of 559 nodes and 1044 triangular elements with a 14-cm diameter. The soft-prior mesh was constructed by discretizing the corresponding plane in the CT scans [see Fig. 4(a)] and automatically generating the segmented zones. For the case shown in Section III-B, this mesh included 470 nodes and 821 elements [see Fig. 4(b)]. For the 3-D FDTD images, the forward solutions were computed on a 200 cm × 200 cm × 11.9 cm cuboid grid. In this case, we used 92 nodes along the horizontal axes and 54 nodes along the vertical one (five PML layers on each face). The images were reconstructed on a separate and overlapping mesh comprised of tetrathedrons arranged in a cylindrical shape which formed the imaging zone [70]. This mesh had a radius of 7 cm and a height of 7 cm and was comprised of 4008 nodes and 17,168 tetrahedral elements.
Fig. 5.
(a) Resulting cross-sectional geometry of the heel (outline of the heel and calcaneus shown) along with the surrounding circle comprising the monopole antenna locations, and (b) the associated mesh used with the soft-prior regularization scheme.
A. Typical 2-D and 3-D Images
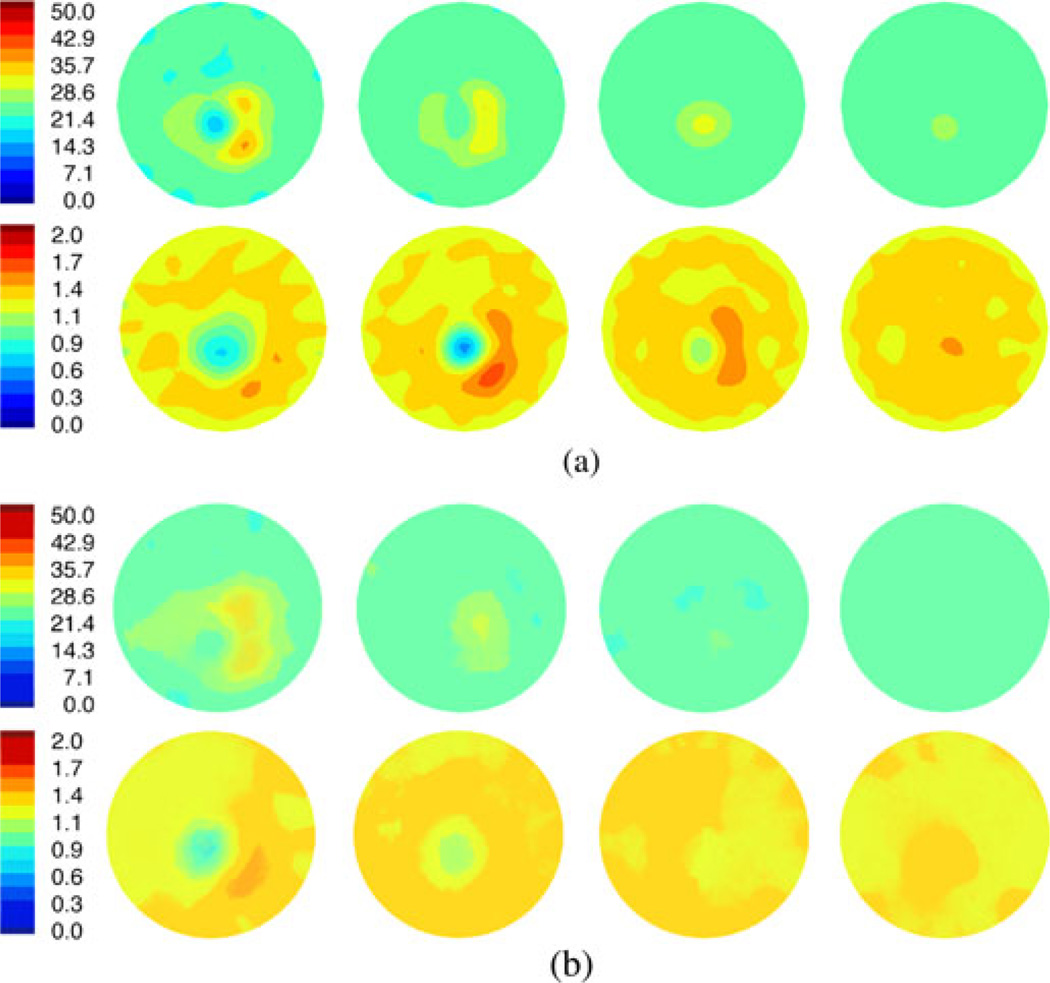
Fig. 6(a) shows a representative set of 2-D FDTD permittivity and conductivity images of a normal heel at 1300 MHz. The properties for the bath were εr = 23.3 and σ = 1.30 S/m. The four image pairs correspond to the data acquired at four vertical heights starting closest to the ankle and moving incrementally toward the heel apex. For the permittivity set, the outline of the heel is essentially triangular with the thin section to the left corresponding to the narrowing of tissue behind the heel. The broader section to the right represents the soft tissue under the foot spreading out toward the toes. Interestingly, for the wider structure to the right, a slight decrease exists between the two larger lobes of higher water content tissue which may be due to the plantar fascia that runs directly from the calcaneus tuberosity to the heads of the metatarsal bones and has lower dielectric properties than muscle (εr = 54.3 and σ = 1.10 S/m) since it is primarily composed of tendons (εr = 45.1 and σ = 0.90 S/m) [71]–[73]. The calcaneus is the lower property region in the center of the heel and is surrounded by the higher property zone comprised of the higher water content soft tissue. As the images progress toward the heel apex (P4), the exterior outline shrinks predictably until it essentially disappears in the last plane. Relative to the anatomical view of the heel in Fig. 2, a considerable amount of soft tissue exists below the end of the calcaneus which is consistent with the soft tissue still visible in the microwave images (but the bone has disappeared).
Fig. 6.
(a) 1300 MHz, 2-D permittivity (top) and conductivity (bottom) images at four horizontal planes vertically separated by 1 cm, respectively. (b) 1300-MHz crosscuts of the 3-D permittivity and conductivity images. The crosscuts were selected at the positions corresponding to the corresponding 2-D images in (a). Note that plane 4 (P4) for each set is below the heel apex.
The conductivity images appear to show the calcaneus structure with the soft tissue only being visible for the larger regions to the right in planes 2 and 3. While considerable permittivity contrast exists with the surrounding bath, the conductivity difference between the soft tissue and the bath is minimal; hence, the recovered properties of the bone are visible but the surrounding muscle is much less evident. In this case, the calcaneus is visible in the first three planes of the conductivity images and the first two planes of the permittivity images. These images are informative on several levels: 1) they capture the 3-D character of the heel structure, 2) the calcaneus is distinct and extends vertically, and 3) the recovered microwave properties are representative of the expected values.
Fig. 6(b) shows the corresponding slices from the 3-D image reconstruction of the same heel utilizing the same measurement data. The heel structures in this set of images appear less distinct (more blurred) compared to those in the 2-D reconstructions primarily because the planes shown transect the mesh at oblique angles (relative to the mesh elements) that do not conform to the internal anatomy. The 3-D images are similar to their 2-D counterparts in Fig. 6(a) especially with respect to feature shape, size, location, and overall property distribution. In this case, the calcaneus is only visible in the first plane of the permittivity and first two planes of the conductivity images, respectively. Twodimensional images often show evidence of objects in planes that extend beyond their physical size [70]. Here, the 3-D images seem to more accurately represent the extent of the calcaneus and its appearance in the third plane in Fig. 6(a) results from limitations in the 2-D algorithm. These images required 55 min to reconstruct on a 2.7-GHz AMD Opteron 2384 multiprocessor platform with 32 nodes. To the best of our knowledge, they represent some of the first fully 3-D clinical microwave property images.
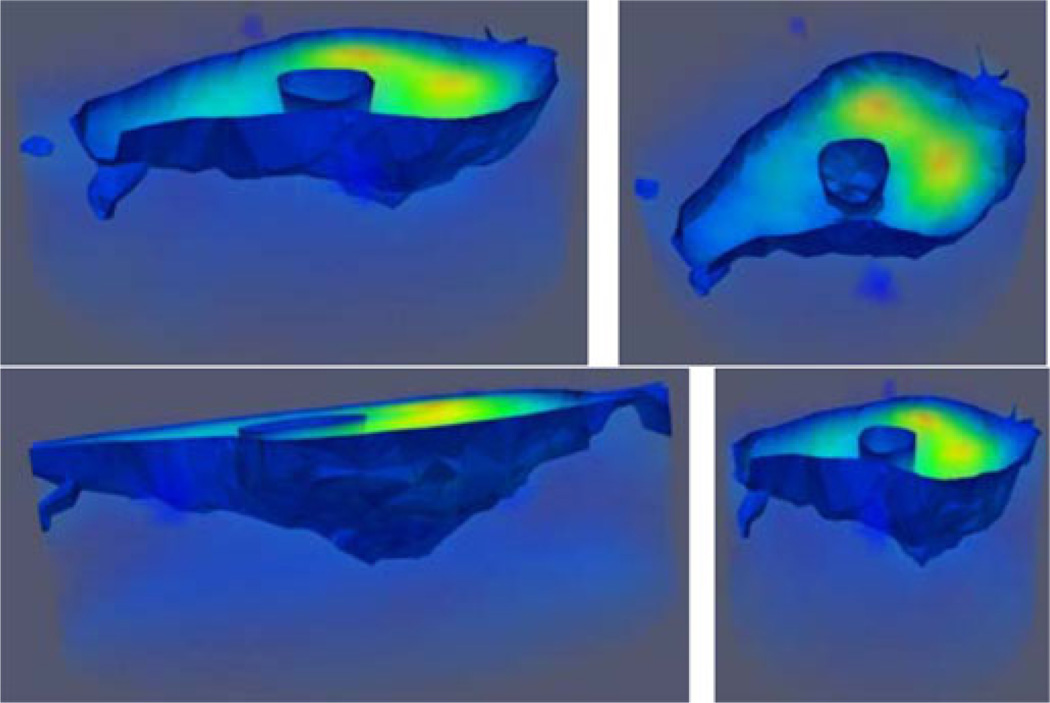
Fig. 7 shows several views of the complete, semitransparent 3-D permittivity image with an isosurface threshold of εr = 26 which captures the interface between the bone and soft tissue and the heel and coupling liquid, respectively. The extent of the cylindrical imaging zone is discernible from the surrounding light blue shading. Important image features are visible: 1) the large high-water-content zones to the right, 2) the centrally located, vertical calcaneus bone, and 3) the narrowing of the heel toward the posterior of the foot. The underside of the surface exterior also appears to conform nicely to the overall heel geometry with the heel apex visible between the narrower and wider ends of the structure at the left and right, respectively.
Fig. 7.
Semitransparent views of the 3-D permittivity image for the same case as Fig. 6. The isosurface threshold was set to εr = 26 to illustrate the tissue/coupling bath and calcaneus/tissue interfaces, respectively.
B. First Patient
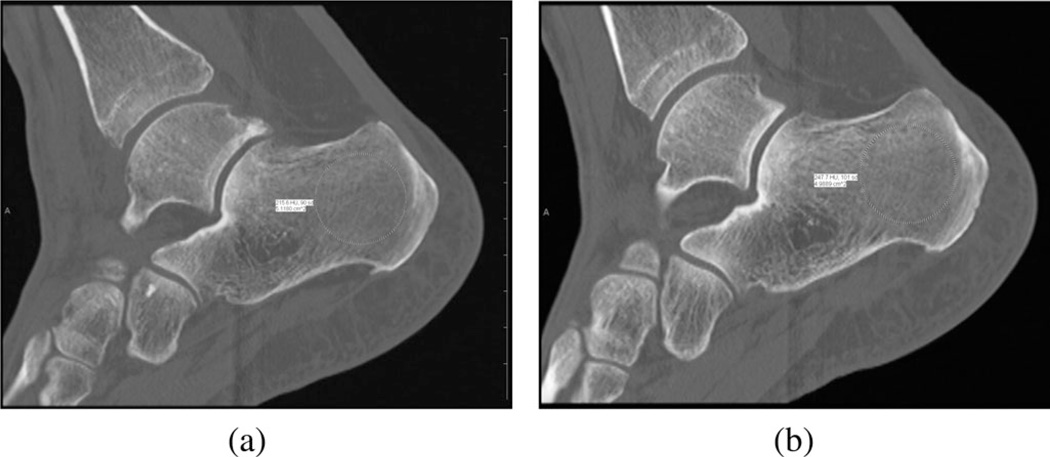
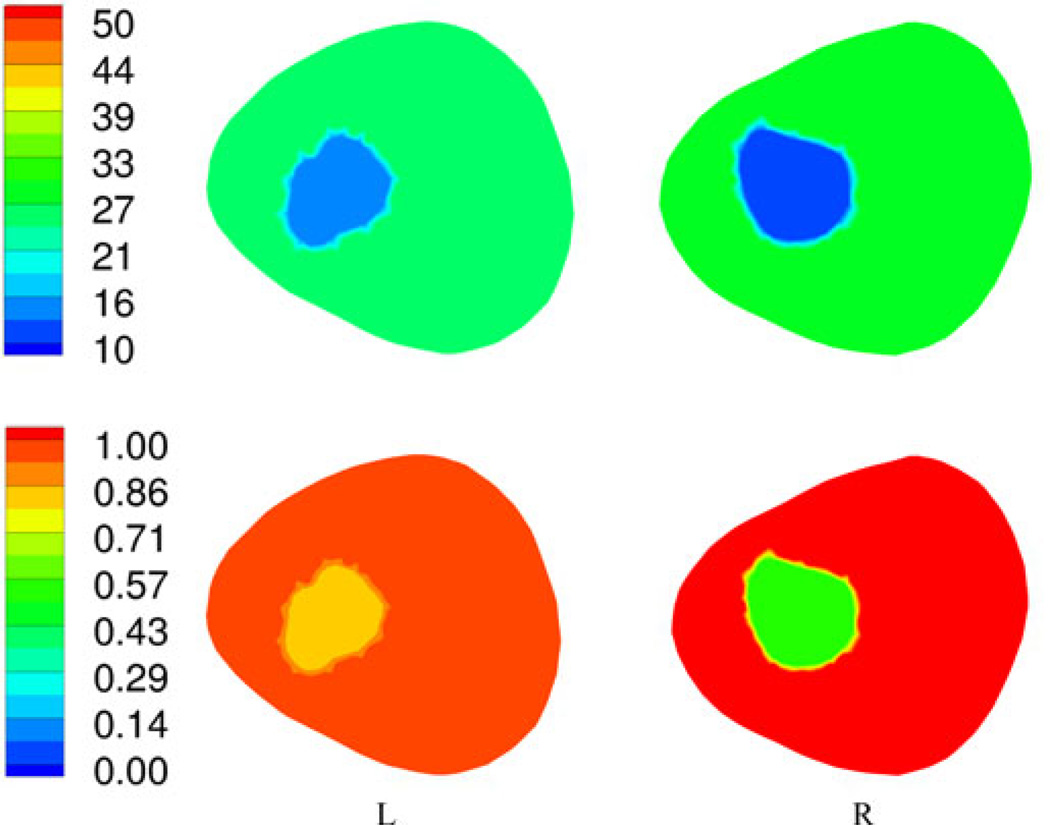
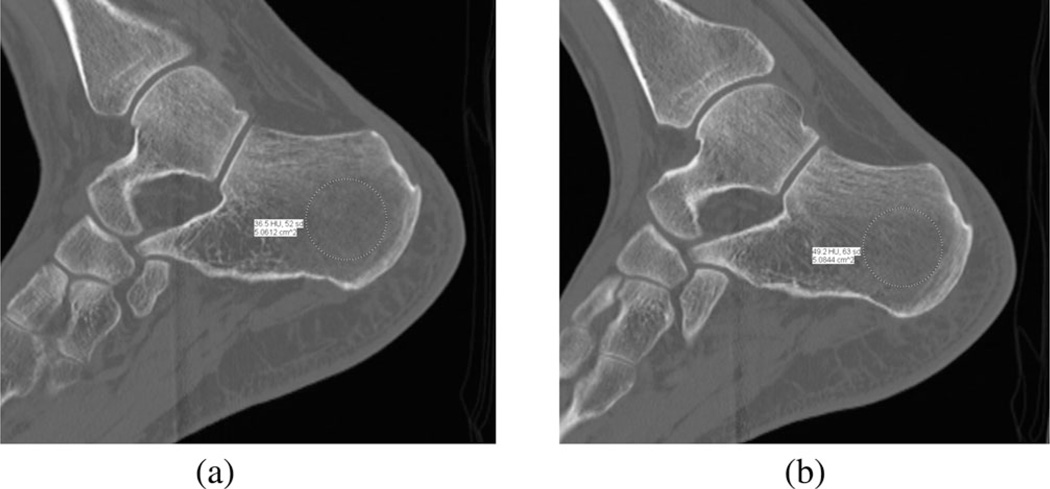
The first patient was a 44 year old female with a body mass index (BMI) of 26.6. She had a left talar dome fracture and two complete ligament tears in her foot and wore a supporting boot for 105 days between the initial injury and surgery and then for another 31 days after surgery. We performed the bone imaging exams on the day the boot was finally removed. Fig. 8(a) and (b) shows sagittal CT views through the left and right calcanei where the radiologist assessed the associated Hounsfield measures (radiologist ROI visible). It is not possible to distinguish the density differences from simple visual inspection, but they are quite apparent from the following quantitative analysis. Fig. 9 shows the 1300 MHz soft-prior permittivity and conductivity images for the affected heel and the normal one (right), respectively. All 2-D soft-prior images were reconstructed in 3 min (20 iterations) on an Intel X5560 single processor with 24 GB of RAM. The soft-prior images are largely homogeneous within the segmented zones (bone and soft tissue) as expected. In this case, the permittivity and conductivity values for the affected heel are 8.8% and 58% higher than for the normal control (left: εr = 13.6, σ = 0.84 S/m; right: εr = 12.5, σ = 0.53 S/m), respectively. In general, these permittivity and conductivity properties are low and high, respectively, but reasonable for cancellous bone relative to nominal published values of εr = 20.1 and σ = 0.44 S/m [73]. Given the alterations to the bone during the recovery period, the associated bone loss would be accompanied by increased hydration. In this situation, the Maxwell-Fricke mixture laws would predict increases in both permittivity and conductivity [74].
Fig. 8.
Sagittal views of the calcaneus bones for the first patient: (a) left and (b) right legs, respectively. The radiologist’s ROIs are visible from the Hounsfield value calculation process.
Fig. 9.
1300-MHz permittivity (top) and conductivity (bottom) soft-prior images for the first plane of the left and right heels of patient 1, respectively.
In comparison to the other modalities, the left and right CT Hounsfield measures were 216 and 248, respectively, while the related ultrasound-based BMDs were 0.699 and 0.773, respectively. The percent changes in each are 13% and 10%, respectively, which are fairly substantial but consistent with the routine clinical observations. The recovered microwave values appear to be representative of these changes.
C. Second Patient
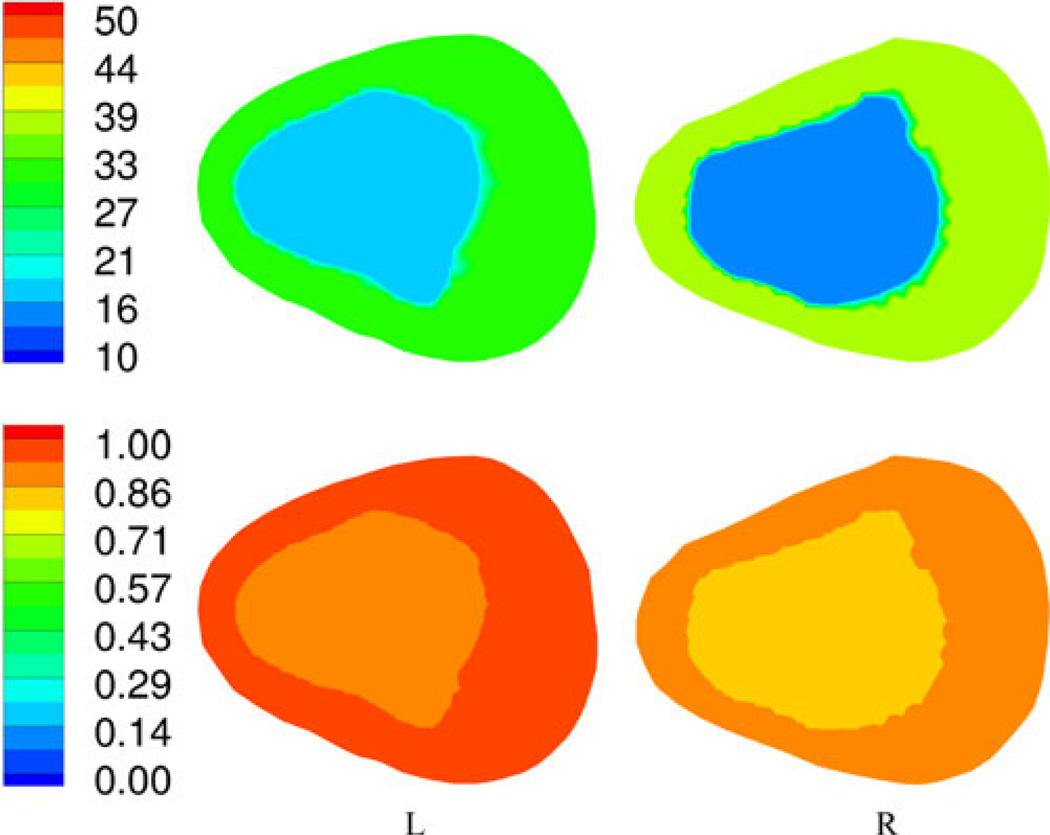
The second patient was a 36 year old male with a BMI of 19.1. He fractured left metatarsals 2, 3, and 4 and was in a cast for 37 days immediately after surgery and in a supporting boot for an additional 14 days. We performed the bone imaging exams on the day the boot was finally removed. Fig. 10(a) and (b) shows sagittal CT views through the left and right calcanei. Fig. 11 shows the 1300 MHz soft-prior permittivity and conductivity images for the affected heel and the normal one (right), respectively. In this case, the permittivity and conductivity values for the affected heel are 24% and 15% higher than for the normal control (left: εr = 16.7, σ = 0.92 S/m; right: εr = 13.5, σ = 0.80 S/m), respectively. Similarly to the first patient, we observed consistent property increases for the affected versus normal heel. The left and right CT Hounsfield measures were 36.5 and 49.2, respectively, while the associated ultrasound-based BMD values were 0.354 and 0.311, respectively. The percent decrease in the CT measures was 34.8%, while the BMD values increased by 13.8%. For this case, the Hounsfield units correlated with the microwave properties but the ultrasound values did not. Interestingly, the microwave values are higher in this patient relative to the first subject while those from the conventional modalities are lower which is consistent with the fact that the second patient had noticeably lower BMI compared to the first patient (BMI ~ 19 versus BMI ~ 27). Table I summarizes the results for both patients.
Fig. 10.
Sagittal views of the calcaneus bones for the second patient: (a) left and (b) right legs, respectively.
Fig. 11.
1300-MHz permittivity (top) and conductivity (bottom) soft-prior images for the first plane of the left and right heels of patient 2, respectively.
TABLE I.
Summary of Patient and Imaging Data
| Patient | Age | BMI | Foot* | CT Houndsfield | Ultrasound BMD |
Relative Permittivity |
Conductivity (S/M) |
|---|---|---|---|---|---|---|---|
| 1 | 44 | 26.6 | Left | 216 | .699 | 13.6 | 0.84 |
| Right | 248 | .773 | 12.5 | 0.53 | |||
| 2 | 36 | 19.1 | Left | 36.5 | .354 | 16.7 | 0.92 |
| Right | 49.2 | .311 | 13.5 | 0.80 |
Left foot was injured in both patients.
IV. Discussion and Conclusion
Both the 2-D and 3-D images shown in Section III-A are encouraging for several reasons. First, they recover the overall shape of the heel and the associated calcaneus bone. These images were reconstructed without any prior information (i.e., we only applied an initial estimate equivalent to the background liquid) in under 20 iterations. While the 3-D images appear to represent the portion of the calcaneus bone nearest the heel apex more faithfully, the 2-D images capture expected details, although the bone features extend vertically further than anticipated—an outcome that is consistent with our experience in clinical breast imaging where the 2-D results contain diagnostic information but exaggerate the 3-D extent of certain features. Given that 2-D image reconstruction is much faster (orders of magnitude fewer computations) than its 3-D counterpart, it may have a clinically useful role as an initial indicator. The images in Fig. 7 provide a rendering of the heel exterior and the calcaneus. They not only recover the overall structure of the important anatomical features within the heel, but they also represent them as having reasonable microwave property values. The heel is a challenging structure to image with microwave methods because of the relatively high property contrast between its tissue constituents— e.g., bone, muscle, skin—which are in close physical proximity.
Although the results were produced from only two patients in this study, they demonstrate encouraging trends. We successfully applied soft-prior regularization to recover accurate property values in the segmented zones identified in the associated CT scans. The bone dielectric values tracked the CT Hounsfield units and were consistent when comparing the calcanei of the injured leg to its normal control in each patient. We only performed 2-D soft-prior reconstructions in this study because it currently provides the most accurate recovery of the dielectric properties within structurally predefined regions. We are currently incorporating soft-prior regularization into our 3-D reconstruction algorithm as the next logical step in the progression of developments and anticipate further improvements from this advance once completed. Clearly, the microwave imaging technique will require further refinement as we explore the possibility of assessing more subtle bone changes over longer periods of time which are expected in various bone diseases.
Interestingly, the microwave measures tracked the CT values in both patients, whereas the ultrasound values were only consistent for the first patient. The ultrasound bone densitometry technique is most effective for a normal range of bone densities, but is less so when the values are far from the norm. In the second patient, the BMDs were 2 standard deviations below normal levels. This observation will need to be tested in a larger group of patients to assess whether the result is significant.
Acknowledgments
This work was supported in part by the U.S. National Institutes of Health under Grant PO1-CA080139.
Biographies
Paul M. Meaney (SM’89) received the A.B. degree in computer science and electrical engineering from Brown University, Providence, RI, in 1982, the M.S. degree in electrical engineering from the University of Massachusetts, Boston, MA, in 1985, and the Ph.D. in biomedical engineering from Dartmouth College, Hanover, NH, in 1995.
From 1996 to 1997, he was a North Atlantic Treaty Organization/National Science Foundation Postdoctoral Fellow at the Royal Marsden Hospital, Sutton, U.K. He is currently a Research Professor at Dartmouth College, where since 1997, he has been a faculty member. His research interests include developing microwave imaging for biomedical applications, especially breast imaging and hyperthermia monitoring.
Keith D. Paulsen (SM’85) received the B.S. degree in biomedical engineering from Duke University, Durham, NC, in 1981, and the M.S. and Ph.D. degrees in biomedical engineering from Dartmouth College, Hanover, NH, in 1984 and 1986, respectively.
From 1986 to 1988, he was an Assistant Professor in the Electromagnetics Group, Department of Electrical and Computer Engineering, University of Arizona. He is currently the Robert A. Pritzker Professor of biomedical engineering in the Thayer School of Engineering, Dartmouth College and the Director of the Radiobiology and Bioengineering Research Program for the Norris Cotton Cancer Center within the Dartmouth-Hitchcock Medical Center. His research interests include computational methods with emphasis on biomedical problems in cancer therapy and imaging, and model-guided surgery.
Contributor Information
Paul M. Meaney, The Thayer School of Engineering, Dartmouth College, Hanover, NH 03755 USA (paul.meaney@dartmouth.edu).
Douglas Goodwin, The Department of Radiology, Dartmouth-Hitchcock Medical Center, Lebanon, NH 03756 USA (douglas.w.goodwin@hitchcock.org).
Amir H. Golnabi, The Thayer School of Engineering, Dartmouth College, Hanover, NH 03755 USA amir.golnabi@dartmouth.edu.
Tian Zhou, The Thayer School of Engineering, Dartmouth College, Hanover, NH 03755 USA benzhoutian@gmail.com.
Matthew Pallone, The Thayer School of Engineering, Dartmouth College, Hanover, NH 03755 USA matthew.pallone@dartmouth.edu.
Shireen D. Geimer, The Thayer School of Engineering, Dartmouth College, Hanover, NH 03755 USA sherri.geimer@dartmouth.edu
Gregory Burke, The Dartmouth Medical School, Hanover, NH 03755 USA (greg.burke@dartmouth.edu).
Keith D. Paulsen, The Thayer School of Engineering, Dartmouth College, Hanover, NH 03755 USA keith.paulsen@dartmouth.edu.
References
- 1.U.S. Department of Health and Human Services Office of the Surgeon General. The 2004 surgeon general’s report on bone health and osteoporosis: What it means to you. 2004 [Google Scholar]
- 2.Griffith JF, Engelke K, Genant HK. Looking beyond bone mineral density—imaging assessment of bone quality. Ann. N. Y. Acad. Sci. 2010;vol. 1192:45–56. doi: 10.1111/j.1749-6632.2009.05378.x. [DOI] [PubMed] [Google Scholar]
- 3.Grampp S, Genant HK, Mathur A, Lang P, Jergas M, Takada M, Gluer CC, Lu Y, Chavez M. Comparison of noninvasive bone mineral measurements in assessing age-related loss, fracture discrimination, and diagnostic classification. J. Bone Miner. Res. 1997;vol. 12:697–711. doi: 10.1359/jbmr.1997.12.5.697. [DOI] [PubMed] [Google Scholar]
- 4.Sornay-Rendu E, Munoz F, Duboeuf F, Delmas P. Rate of forearm bone loss is associated with an increased risk of fracture independently of bone mass in postmenopausal women: The ofely study. J. Bone Miner. Res. 2005;vol. 20:1929–1935. doi: 10.1359/JBMR.050704. [DOI] [PubMed] [Google Scholar]
- 5.Delmas PD. Treatment of postmenopausal osteoporosis. Lancet. 2002;vol. 359:2018–2026. doi: 10.1016/S0140-6736(02)08827-X. [DOI] [PubMed] [Google Scholar]
- 6.Cummings SR, Melton LJ., III Epidemiology and outcomes of osteoporotic fractures. Lancet. 2002;vol. 359:1761–1767. doi: 10.1016/S0140-6736(02)08657-9. [DOI] [PubMed] [Google Scholar]
- 7.Melton LJ, III, Cooper C. Magnitude and impact of osteoporosis and fractures. In: Marcus R, Feldman D, Kelsey J, editors. Osteoporosis. 2nd ed. vol. 1. San Diego, CA: Academic; 2001. pp. 557–567. [Google Scholar]
- 8.Center JR, Nguyen TV, Scheider D, Sambrook PN, Eisman JA. Mortality after all major types of osteoporotic fracture in men and women: An observational study. Lancet. 1999;vol. 353:878–882. doi: 10.1016/S0140-6736(98)09075-8. [DOI] [PubMed] [Google Scholar]
- 9.Poor G, Atkinson EJ, O’Fallon WM, Melton LJ., III Determinants of reduced survival following hip fractures in men. Clin. Orthop. Relat. Res. 1995;vol. 319:260–265. [PubMed] [Google Scholar]
- 10.Browner WS, Pressman AR, Nevitt MC, Cummings SR. Mortality following fractures in older women: The study of osteoporotic fractures. Arch. Internal Med. 1996;vol. 156:1521–1525. [PubMed] [Google Scholar]
- 11.Kado DM, Browner WS, Palermo L, Nevitt MC, Genant HK, Cummings SR. Vertebral fractures and mortality in older women: Aprospective study. Arch. Internal Med. 1999;vol. 159:1215–1220. doi: 10.1001/archinte.159.11.1215. [DOI] [PubMed] [Google Scholar]
- 12.Melton LJ., III Excess mortality following vertebral fracture. J. Amer. Geriatr. Soc. 2000;vol. 48:338–339. doi: 10.1111/j.1532-5415.2000.tb02658.x. [DOI] [PubMed] [Google Scholar]
- 13.Gold DT, Lyles KW, Shipp KM, Drezner MK. Osteoporosis and its nonskeletal consequences: Their impact on treatment decisions. In: Marcus R, Feldman D, Kelsey J, editors. Osteoporosis. 2nd ed. San Diego, CA: Academic; 2001. pp. 479–484. [Google Scholar]
- 14.Greendale GA, Barrett-Connor E. Outcomes of osteoporotic fractures. In: Marcus R, Feldman D, Kelsey J, editors. Osteoporosis. 2nd ed. San Diego, CA: Academic; 2001. pp. 819–829. [Google Scholar]
- 15.Wilkie JR, Giger ML, Chinander MR, Vokes TJ, Li H, Dixon L, Jaros V. Comparison of radiographic texture analysis from computed radiography and bone densitometry systems. Med. Phys. 2004;vol. 31:882–891. doi: 10.1118/1.1650529. [DOI] [PubMed] [Google Scholar]
- 16.Gluer CC, Cummings SR, Bauer DC, Stone K, Pressman A, Mathur A, Genant HK. Osteoporosis: Association of recent fractures with quantitative us findings. Radiology. 1996;vol. 199:725–733. doi: 10.1148/radiology.199.3.8637996. [DOI] [PubMed] [Google Scholar]
- 17.Njeh CF, Fuerst T, Diessel E, Genant HK. Is quantitative ultrasound dependent on bone structure? A reflection. Osteoporos. Int. 2001;vol. 12:1–15. doi: 10.1007/PL00020939. [DOI] [PubMed] [Google Scholar]
- 18.Bauer DC, Gluer CC, Cauley JA, Vogt TM, Ensrud KE, Genant HK, Black DM. Broadband ultrasound attenuation predicts fractures strongly and independently of densitometry in older women. Arch. Internal Med. 1997;vol. 157:629–633. [PubMed] [Google Scholar]
- 19.Wu C, Gluer C, Lu Y, Fuerst T, Hans D, Genant HK. Ultrasound characterization of bone demineralization. Calcified Tissue Int. 1998;vol. 62:133–139. doi: 10.1007/s002239900406. [DOI] [PubMed] [Google Scholar]
- 20.Hans D, Dargent-Molina P, Schott AM, Sebert JL, Cormier C, Kotzki PO, Delmas PD, Pouilles JM, Breart G, Meunier PJ. Ultrasonographic heel measurements to predict hip fracture in elderly women: The EPIDOS prospective study. Lancet. 1996;vol. 348:511–514. doi: 10.1016/s0140-6736(95)11456-4. [DOI] [PubMed] [Google Scholar]
- 21.Larsen LE, Jacobi JH. Medical Applications of Microwave Imaging. Piscataway, NJ: IEEE Press; 1986. [Google Scholar]
- 22.Pichot C, Jofre L, Peronnet G, Bolomey JC. Active microwave imaging of inhomogeneous bodies. IEEE Trans. Antennas Propag. 1985 Apr;vol. 33(no. 4):416–425. [Google Scholar]
- 23.Chen FC, Chew WC. Time-domain ultra-wideband imaging radar experiment for verifying super-resolution in nonlinear inverse scattering. J. Electromagn. Waves Appl. 2003;vol. 17:1243–1260. [Google Scholar]
- 24.Abubakar A, van den Berg PM, Mallorqui JJ. Imaging of biomedical data using a multiplicative regularized contrast source inversion method. IEEE Trans. Microw. Theory Tech. 2002 Jul;vol. 50(no. 7):1761–1771. [Google Scholar]
- 25.Meaney PM, Fanning MW, Raynolds T, Fox CJ, Fang Q, Kogel CA, Poplack SP, Paulsen KD. Initial clinical experience with microwave breast imaging in women with normal mammography. Acad. Radiol. 2007;vol. 14:207–218. doi: 10.1016/j.acra.2006.10.016. [DOI] [PMC free article] [PubMed] [Google Scholar]
- 26.Joachimowicz N, Pichot C, Hugonin JR. Inverse scattering: an iterative numerical method for electromagnetic imaging. IEEE Trans. Antennas Propag. 1991 Dec;vol. 39(no. 12):1742–1752. [Google Scholar]
- 27.Caorsi S, Gragnani GL, Pastorino M. Redundant electromagnetic data for microwave imaging of three-dimensional dielectric objects. IEEE Trans. Antennas Propag. 1994 May;vol. 42(no. 5):581–589. [Google Scholar]
- 28.Isernia T, Pascazio V, Pierri R. On the local minima in a tomographic imaging technique. IEEE Trans. Geosci. Remote Sens. E. 2001 Jul;vol. 39(no. 7):1596–1607. [Google Scholar]
- 29.Meaney PM, Yagnamurthy NK, Li D, Demidenko E, Paulsen KD. Proc. IEEE Int. Symp. Antennas Propag. Boston, MA: 2001. A 2-stage Gauss-Newton reconstruction technique for improved object detection in microwave imaging, in; pp. 238–241. [Google Scholar]
- 30.Liu QH, Zhang ZQ, Wang TT, Bryan JA, Ybarra GA, Nolte LW, Joines WT. Active microwave imaging I—2-D forward and inverse scattering methods. IEEE Trans. Microw. Theory Tech. 2002 Jan;vol. 50(no. 1):123–133. [Google Scholar]
- 31.Pastorino M, Caorsi S, Massa A, Randazzo A. Reconstruction algorithms for electromagnetic imaging. IEEE Trans. Instrum. Meas. 2004 Jun;vol. 53(no. 3):692–699. [Google Scholar]
- 32.Gilmore C, Mojabi P, Zakaria A, Ostadrahimi M, Kaye C, Noghanian S, Shafai L, Pistorius S, LoVetri J. A wideband microwave tomography system with a novel frequency selection procedure. IEEE Trans. Biomed. Eng. 2010 Apr;vol. 57(no. 4):894–904. doi: 10.1109/TBME.2009.2036372. [DOI] [PubMed] [Google Scholar]
- 33.Klemm M, Leendertz J, Preece AW, Shere M, Craddock IJ, Benjamin R. Soc. Int. Symp. Toronto, Canada: 2010. Clinical experience of breast cancer imaging using ultrawideband microwave radar system at Bristol, presented at the IEEE Antennas Propag. [Google Scholar]
- 34.Fear EC, Sill J, Stuchly MA. Experimental feasibility study of confocal microwave imaging for breast tumor detection. IEEE Trans. Microw. Theory Tech. 2003 Mar;vol. 51(no. 3):887–892. [Google Scholar]
- 35.Hagness SC, Taflove A, Bridges JE. Two-dimensional FDTD analysis of a pulsed microwave confocal system for breast cancer detection: Fixed-focus and antenna-array sensors. IEEE Trans. Biomed. Eng. 1998 Dec;vol. 45(no. 12):1470–1479. doi: 10.1109/10.730440. [DOI] [PubMed] [Google Scholar]
- 36.Poplack SP, Paulsen KD, Hartov A, Meaney PM, Pogue B, Tosteson T, Grove M, Soho S, Wells W. Electromagnetic breast imaging: Pilot results in women with abnormal mammography. Radiology. 2007;vol. 243:350–359. doi: 10.1148/radiol.2432060286. [DOI] [PubMed] [Google Scholar]
- 37.Foster KR, Schwan H. Dielectric properties of tissues and biological materials: A critical review. Crit. Rev. Biomed. Eng. 1989;vol. 17(no. 1):25–104. [PubMed] [Google Scholar]
- 38.Foster KR, Schwan HP. Dielectric properties of tissues. In: Polk C, Postow E, editors. Handbook of Biological Effects of Electromagnetic Fields. Boca Raton, FL: CRC Press; 1996. pp. 25–100. [Google Scholar]
- 39.Peyman A, Rezazadeh AA, Gabriel C. Changes in the dielectric properties of rat tissue as a function of age at microwave frequencies. Phys. Med. Biol. 2001;vol. 46:1617–1629. doi: 10.1088/0031-9155/46/6/303. [DOI] [PubMed] [Google Scholar]
- 40.Peyman A, Gabriel C, Grant EH, Vermeeren G, Martens L. Variation of the dielectric properties of tissues with age: The effect on the values of SAR in children when exposed to walkie-talkie devices. Phys. Med. Biol. 2009;vol. 54:227–241. doi: 10.1088/0031-9155/54/2/004. [DOI] [PubMed] [Google Scholar]
- 41.Chakkalakal DA, Johnson MW, Harper RA, Katz JL. Dielectric properties of fluid-saturated bone. IEEE Trans. Biomed. Eng. 1980 Feb;vol. 27(no. 2):95–100. doi: 10.1109/tbme.1980.326713. [DOI] [PubMed] [Google Scholar]
- 42.Marino AA, Becker RO, Bachman CH. Dielectric determination of bound water of bone. Phys. Med. Biol. 1967;vol. 12:367–378. doi: 10.1088/0031-9155/12/3/309. [DOI] [PubMed] [Google Scholar]
- 43.Saha S, Williams PA. Comparison of the electrical and dielectric behavior of wet human cortical and cancellous bone tissue from the distal tibia. J. Orthop. Res. 1995;vol. 13:524–532. doi: 10.1002/jor.1100130407. [DOI] [PubMed] [Google Scholar]
- 44.Meaney PM, Zhou T, Golnabi A, Attardo E, Paulsen KD. Bone dielectric property variation as a function of mineralization at microwave frequencies. Int. J. Biomed. Imaging. 2012;vol. 2012:649612-1–649612-9. doi: 10.1155/2012/649612. [DOI] [PMC free article] [PubMed] [Google Scholar]
- 45.Sierpowska J. Ph.D. dissertation, Dept. Appl. Phys. Kuopio, Finland: Kuopio University; 2007. Electrical and dielectric characterization of trabecular bone quality. [Google Scholar]
- 46.Smith SR, Foster KR. Dielectric properties of low-water-content tissues. Phys. Med. Biol. 1985;vol. 30:965–973. doi: 10.1088/0031-9155/30/9/008. [DOI] [PubMed] [Google Scholar]
- 47.Swanson GT, Lafferty JF. Electrical properties of bone as a function of age, immobilization and vibration. J. Biomech. 1972;vol. 5:261–266. doi: 10.1016/0021-9290(72)90041-3. [DOI] [PubMed] [Google Scholar]
- 48.Ingle BM, Hay SM, Bottjer HM, Eastell R. Changes in bone mass and bone turnover following ankle fracture. Osteoporos. Int. 1999;vol. 10:408–415. doi: 10.1007/s001980050247. [DOI] [PubMed] [Google Scholar]
- 49.Sarangi PP, Ward AJ, Smith EJ, Staddon GE, Atkins RM. Algodystrophy and osteoporosis after tibial fractures. J. Bone Joint Surg. 1993;vol. 75-B:450–452. doi: 10.1302/0301-620X.75B3.8496220. [DOI] [PubMed] [Google Scholar]
- 50.Ahl T, Sjoberg H-E, Dalen N. Bone mineral content in the calcaneus after ankle fracture. Acta Orthop. Scand. 1988;vol. 59:173–175. [PubMed] [Google Scholar]
- 51.Beller G, Belavy DL, Sun L, Armbrecht G, Alexandre C, Felsenberg D. Wise-2005: Bed-rest induced changes in bone mineral density in women during 60 days simulated microgravity. Bone. 2011;vol. 49:858–866. doi: 10.1016/j.bone.2011.06.021. [DOI] [PubMed] [Google Scholar]
- 52.Leblanc AD, Schneider VS, Evans HJ, Engelbtretson DA, Krebs JM. Bone mineral loss and recovery after 17 weeks of bed rest. J. Bone Miner. Density. 1990;vol. 5:843–850. doi: 10.1002/jbmr.5650050807. [DOI] [PubMed] [Google Scholar]
- 53.Golnabi AH, Meaney PM, Paulsen KD. Comparison of noprior and soft-prior regularization in biomedical microwave imaging. Int. J. Med. Phys. 2011;vol. 36(no. 2):125–136. doi: 10.4103/0971-6203.83482. [DOI] [PMC free article] [PubMed] [Google Scholar]
- 54.Golnabi AH, Meaney PM, Geimer SD, Zhou T, Paulsen KD. Microwave tomography for bone imaging. Proc. IEEE Int. Symp. Biomed. Imaging: From Nano to Macro. 2011 Mar-Apr;:956–959. [Google Scholar]
- 55.Fox CJ, Meaney PM, Shubitidze F, Potwin L, Paulsen KD. Characterization of a monopole antenna in a lossy medium for microwave breast computed tomography. In: Ibrahim TS, Crozier S, Fear E, editors. New Electromagnetic Methods and Applications of Antennas in Biomedicine. vol. 2008. Cairo, Egypt: Hindawi Publishing Corporation; 2008. [Google Scholar]
- 56.Meaney PM, Paulsen KD, Pogue BW, Miga MI. Microwave image reconstruction utilizing log-magnitude and unwrapped phase to improve high-contrast object recovery. IEEE Trans. Med. Imaging. 2001 Feb;vol. 20(no. 2):104–116. doi: 10.1109/42.913177. [DOI] [PubMed] [Google Scholar]
- 57.Paulsen KD, Meaney PM. Compensation for nonactive array element effects in a microwave imaging system—I: Forward solution vs. Measured data comparison. IEEE Trans. Med. Imaging. 1999 Jun;vol. 18(no. 6):496–507. doi: 10.1109/42.781015. [DOI] [PubMed] [Google Scholar]
- 58.Meaney PM, Paulsen KD, Chang JT, Fanning M. Compensation for nonactive array element effects in a microwave imaging system— II: Imaging results. IEEE Trans. Med. Imaging. 1999 Jun;vol. 18(no. 6):508–518. doi: 10.1109/42.781016. [DOI] [PubMed] [Google Scholar]
- 59.Meaney PM, Schubitidze F, Fanning MW, Kmiec M, Epstein N, Paulsen KD. Surface wave multi-path signals in near-field microwave imaging. Int. J. Biomed. Imaging. 2012;vol. 2012:697253-1–697253-11. doi: 10.1155/2012/697253. [DOI] [PMC free article] [PubMed] [Google Scholar]
- 60.Fang Q, Meaney PM, Paulsen KD. Singular value analysis of the Jacobian matrix in microwave image reconstructions. IEEE Trans. Antennas Propag. 2006 Aug;vol. 54(no. 8):2371–2380. [Google Scholar]
- 61.Li D, Meaney PM, Raynolds T, Pendergrass SA, Fanning MW, Paulsen KD. A parallel-detection microwave spectroscopy system for breast imaging. Rev. Sci. Instrum. 2004;vol. 75:2305–2313. [Google Scholar]
- 62.Bolomey J-C. Recent European developments in active microwave imaging for industrial, scientific and medical applications. IEEE Trans. Microw. Theory Tech. 1989 Dec;vol. 37(no. 12):2109–2117. [Google Scholar]
- 63.Fear EC, Li X, Hagness SC, Stuchly MA. Confocal microwave imaging for breast cancer detection: Localization of tumors in three dimensions. IEEE Trans. Biomed. Eng. 2002 Aug;vol. 49(no. 8):812–822. doi: 10.1109/TBME.2002.800759. [DOI] [PubMed] [Google Scholar]
- 64.Semenov S, Kellam J, Williams T, Quinn M, Nicholson B, Thirunavukkarasu S. Microwave tomographic spectroscopy for an assessment tissue oxygenation. presented at the Eur. Conf. Antennas Propag., Prague, Czech Republic. 2012
- 65.Meaney PM, Fang Q, Rubaek T, Demidenko E, Paulsen KD. Log transformation benefits parameter estimation in microwave tomographic imaging. Med. Phys. 2007;vol. 34:2014–2023. doi: 10.1118/1.2737264. [DOI] [PubMed] [Google Scholar]
- 66.Grzegorczyk TM, Meaney PM, Jeon SI, Geimer SD, Paulsen KD. Importance of phase unwrapping for the reconstruction of microwave tomographic images. Biomed. Opt. Exp. 2011;vol. 2:315–330. doi: 10.1364/BOE.1.000315. [DOI] [PMC free article] [PubMed] [Google Scholar]
- 67.Scapaticci R, Crocco L, Bucci OM, Catapano I. Assessment of inversion strategies for microwave imaging of weak magnetic scatterers embedded into a biological environment. presented at the Eur. Conf. Antennas Propag., Prague, Czech Republic. 2012
- 68.Semenov SY, Bulyshev AE, Abubakar A, Posukh VG, Sizov YE, Souvorov AE, van den Berg PM, Williams TC. Microwavetomographic imaging of the high dielectric-contrast objects using different image-reconstruction approaches. IEEE Trans. Microw. Theory Tech. 2005 Jul;vol. 53(no. 7):2284–2294. [Google Scholar]
- 69.Srinivasan S, Pogue BW, Brooksby B, Jiang S, Dehghani H, Kogel CA, Wells WA, Poplack SP, Paulsen KD. Near-infrared characterization of breast tumors in-vivo using spectrally-constrained reconstruction. Technol. Cancer Res. Treat. 2005;vol. 4:513–526. doi: 10.1177/153303460500400505. [DOI] [PubMed] [Google Scholar]
- 70.Fang Q, Meaney PM, Paulsen KD. Viable three-dimensional microwave imaging: Theory and experiments. IEEE Trans. Antennas Propag. 2010 Feb;vol. 58(no. 2):449–458. doi: 10.1109/TAP.2009.2037691. [DOI] [PMC free article] [PubMed] [Google Scholar]
- 71.Gabriel C, Gabriel S, Corthout E. The dielectric properties of biological tissues—I: Literature survey. Phys. Med. Biol. 1996;vol. 41:2231–2249. doi: 10.1088/0031-9155/41/11/001. [DOI] [PubMed] [Google Scholar]
- 72.Gabriel S, Lau RW, Gabriel C. The dielectric properties of biological tissues—II: Measurements in the frequency range 10 Hz to 20 GHz. Phys. Med. Biol. 1996;vol. 41:2251–2269. doi: 10.1088/0031-9155/41/11/002. [DOI] [PubMed] [Google Scholar]
- 73.Gabriel S, Lau RW, Gabriel C. The dielectric properties of biological tissues—III: Parametric models for the dielectric spectrum of tissues. Phys. Med. Biol. 1996;vol. 41:2271–2293. doi: 10.1088/0031-9155/41/11/003. [DOI] [PubMed] [Google Scholar]
- 74.Foster KR, Schepps JL, Schwan HP. Microwave dielectric relaxation in muscle. A second look. Biophys. J. 1980;vol. 29:271–281. doi: 10.1016/S0006-3495(80)85131-9. [DOI] [PMC free article] [PubMed] [Google Scholar]


