Abstract
The complement system is an integral innate immune component that is made up of a cascade of enzymatic proteins that, once activated, results in lysis of invading pathogens, opsonization or recruitment of other innate and/or acquired immune responders, or some combination of the three. Due to the importance of the signal amplification and control points present in the cascade, complement is highly sensitive to subtle variations in initiation conditions, including nanoscale changes to molecular spacing. Using Fc-functionalized microparticles and nanoparticles, we find that activation requires a minimum threshold surface concentration of Fc of at least 20% surface coverage. This result indicates that a high surface density Fc is necessary for micro/nanoparticle complement activation through the classical pathway. In addition, the magnitude of the response was dependent on the size of the particle, with larger particles causing decreased activation. We hypothesize that a high density of Fc is needed to efficiently bind and closely appose molecular initiators of the complement cascade, from initiation to terminal complement complex formation. These fundamental studies of the interaction of microparticles and nanoparticles with the immune system suggest design rules for particle size and molecular density that impact immunostimulation through the complement system. Providing a therapeutic agent to modulate the complement response could aid a variety of treatment strategies. Engineered nanoparticles with controlled gaps between molecular activators could lead to new types of immunomodulatory agents.
Keywords: Complement system, microparticles and nanoparticles, Fc, immunomodulation
1. Introduction
The body’s immune response is comprised of a vital system of cells and macromolecules that help to regulate homeostasis as well as respond to, kill and clear invading pathogens or waste products.1–4 Components of the immune system have also been shown to play a role in a variety of disease processes such as cancer,5 atherosclerosis6,7 and numerous other autoimmune and immune deficiency diseases.8–10 In total, chronic immune-related disease affects ~5% of the United States population each year,11 highlighting the importance of developing a novel method for modulating the body’s immune response in a directed and “tunable” manner. The humoral immune response represents the body’s use of specific proteins, including immunoglobulins and complement components, to opsonize and/or inactivate invading pathogens while also initiating cytotoxic processes and recruiting immune cells through chemotaxis.3,12,13 The complement system14–17 comprises a group of proteins that become enzymatically activated through one of three pathways: the classical, alternative and lectin pathways.9,10,18,19 The classical pathway is activated by the binding of C1 monomers to closely apposed Fc regions of a single IgM or multiple IgG molecules, and formation of the C1 complex.20–22
If one of these pathways is initiated by an invading pathogen, the complement proteins are activated in a cascading manner, resulting in the deposition of complement proteins on the surface of the pathogen and the formation of a membrane attack complex, also known as a terminal complement complex (TCC). The TCC forms a nanoscale transmembrane channel leading to loss of integrity of the bilayer membrane and osmotic lysis of the pathogen.18,19 Diffusion of the proteolytic fragments of these deposited complement components also interact with other immune cells, such as neutrophils and macrophages, to amplify the phagocytosis signal(s) and aid in the clearance of the targeted pathogen.9,10,18,23 While the complement system represents only a portion of the humoral response, any knockdown of complement component receptors severely impairs the overall humoral immune response.24 In addition, the complement system is also involved in the transition to and effectiveness of the adaptive immune response, as successful complement activation has been shown to act as an adjuvant to improve vaccine effectiveness.14,25
The interaction of microparticles and nano-particles with humoral immune constituents provides an opportunity to modulate the magnitude and location of the innate immune response. Particle induced immunomodulation can be accomplished through physical signals, such as particle size and shape; chemical signals, such as material composition; and biological signals, such as opsonization; resulting in an opportunity for rational design and control of an immune response suited for specific applications (i.e., a “tunable” immune response).26–31 Particles have previously been used in immune-related applications as delivery platforms for vaccine development and in the study of phagocytosis.14,26,27,32,33 In our phagocytosis studies, particles were coated in immunoglobulin gamma (IgG) antibody so that the crystallizable fragment (Fc) of the antibody is orientated outwards.57 This Fc portion of the antibody is then able to interact with Fc-receptors on the surface of immune cells to trigger receptor-mediated phagocytosis. Consistent with previous work, these studies demonstrate that the size of the particle and the density of Fc can affect the efficiency of phagocytosis and cytokine production by macrophages.26,34,35 However, in contrast to previous work, these studies established a minimum Fc coverage and a maximum size threshold for biological and physical stimulation of the complement cascade.
While the destruction of pathogens through lysis that results from the insertion of the membrane attack complex is typically seen as the traditional role of the complement system, recent studies have shown that it also plays a key role in the body’s response to tumors18,36,37 and the effectiveness of vaccines.14,25 This only further highlights the need for a tunable design platform for location-specific complement system modulation. Despite the large role of Fc functionalized particles in the study and manipulation of macrophages, only a few studies have investigated Fc functionalized particles to understand their role in activating the complement system.14–17 Previous studies have found that particle size can affect complement system activation, possibly due to the physical effect of the curvature of small particles on complement constituent assembly.38–40 The C1 complex assembles in direct contact with apposed Fc molecules, and is only stabilized and retained when the C1q head is bound multivalently to Fc molecules.41,42 Therefore, the density of Fc molecules on a particle, as well as their orientation, may also affect complement activation. While efficient activation of complement is an important defense against pathogens, uncontrolled activation may lead to “self-” tissue damage.43 Rationally designed modulation of the complement response will allow development of a wide range of therapeutic agents for many different immunopathologies.
We hypothesize that microparticles and nano-particles functionalized with IgG molecules are capable of stimulating the complement system in a manner that depends upon the particle size and density of the opsonizing IgG antibody. Therefore, by controlling these variables, we can modulate the complement system in a tunable manner. The design of microparticles and nanoparticles for nanoscale control of Fc stimulants may be useful as a clinical therapeutic agent to augment and modulate the immune response through the complement system.
2. Materials and Methods
2.1. Particle functionalization
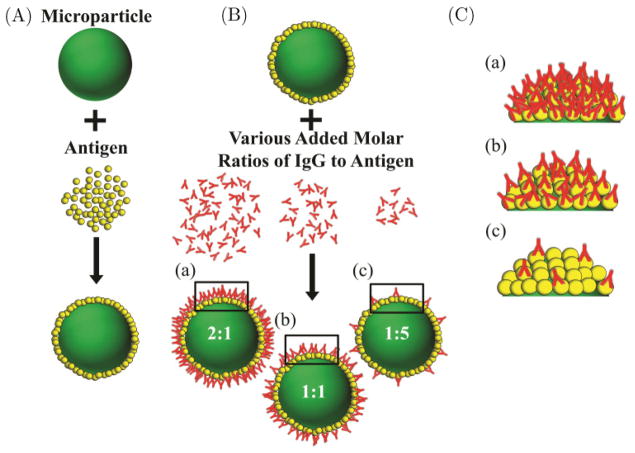
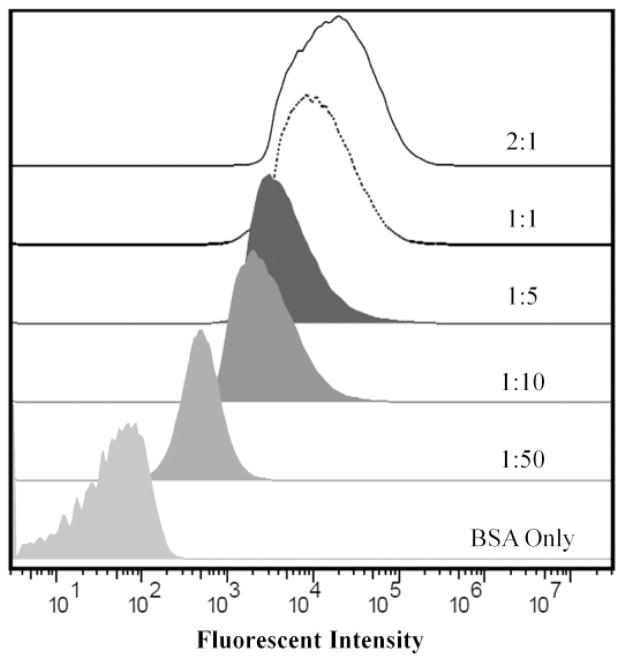
Carboxylated polystyrene particles of 0.5 μm, 1 μm, 2 μm and 4 μm diameters were purchased from Polysciences (Warrington, PA) and Bangs Laboratories (Fishers, IN). An illustration representing the particle functionalization process is shown in Fig. 1. The particles were first incubated in a 2 mg/mL bovine serum albumin (BSA) (Sigma Aldrich, St. Louis, MO) solution to adsorb a saturating layer of BSA onto the surface of the particles. The amount of BSA added was increased with the total amount of particle surface area to keep the BSA coating on the particles uniform, in accordance with manufacturer’s recommendations. To confirm that the amount of BSA added was in fact saturating, we used fluorescently labeled BSA in increasing and decreasing concentrations. The fluorescence was then measured using a flow cytometer (see Fig. A.1). This BSA coating serves to orient the Fc portion of the bound anti-BSA IgG molecules to the exterior. To vary the amount of exposed Fc domains on the particles, sheep polyclonal anti-BSA IgG antibody (Abcam, Cambridge, MA) was then added in various molar ratios. We began with a minimum molar ratio of 1:50 representing a single IgG molecule to every 50 BSA molecules that were originally added, creating a dilute surface density of Fc molecules on the particles. The ratio was then increased to a maximum of 2:1. To ensure a high density Fc coverage on the 4 μm particles, we also created two additional sets of particles coated with molar ratios of 5:1 and 10:1. For each functionalization step, we allowed the particles to incubate with the proteins for at least 2 h at room temperature in phosphate buffered saline (PBS) at a pH ~7.2 (Invitrogen, Carlsbad, CA). After the incubation period, the particles were washed three times through centrifugation and PBS exchange. We also reserved a set of particles that were coated in only BSA. To demonstrate that Fc density was varied successfully, we examined a sample of each particle condition through incubation with a fluorescently labeled rabbit anti-sheep IgG secondary antibody (Abcam, Cambridge, MA). The particles were then analyzed using a flow cytometer. The flow cytometer recorded the fluorescent intensity per particle and 50 000 events were recorded for each condition. The mean fluorescent intensity (MFI), represented as the arithmetic mean of the measured fluorescent intensity of the secondary antibody, corresponds to number of available Fc molecules for a given size of particles. Representative traces are shown in Fig. B.1.
Fig. 1.
Microparticle functionalization process. (A) Antigen is adsorbed onto the particle surface at a saturating density and then (B) IgG is added in increasing molar ratios and (C) to create particles with variable Fc density.
2.2. Flow cytometry
Measurement of Fc density on all particle samples was analyzed using a flow cytometer (BD Accuri C6, Franklin Lakes, NJ) after incubation with the fluorescently labeled secondary antibody. Fluorescence was measured with a 630 ± 30 nm band-pass filter capable of detecting the fluorescent marker. The resulting MFI of the particle sample for each Fc density condition was calculated using the CFlow-Plus software (BD, Franklin Lakes, NJ) and FlowJo (Tree Star, Inc., Ashland, OR). We also recorded the number of microparticles per mL to establish the particle concentration of each sample.
2.3. Serum collection
Whole blood was first collected from two healthy, consenting human donors with approval from the GIT IRB #H10011. Approximately 10 mL of whole blood was collected from each donor and was allowed to clot at 4°C. The samples were then centrifuged at 2000×G for 10 min. The resulting serum from each sample was decanted and transferred to a sterile centrifuge tube. Centrifugation was repeated to remove any residual red blood cells, which resulted in approximately 5 mL of serum collected from each donor.
2.4. Complement activation assay
The MicroVue CH50 enzyme immunoassay (EIA) (Quidel, San Diego, CA) was used to evaluate the magnitude of complement activation as a result of the addition of Fc functionalized particles to human serum (see Fig. 2). This kit is used clinically to determine complement system deficiencies by measuring the amount of generated TCCs.44,45 Included in the kit is heat aggregated gamma globulin (HAGG) activator, which we use as a positive control. The kit was used according to the manufacturer’s instructions. Approximately 10–30 million particles were added to serum samples from both donors for each Fc density and particle size condition. The CH50 EIA measures the amount of TCC generated through the use of TCC-specific antibodies. The amount of antibody binding is directly correlated to the amount of fully formed TCC that results in 50% hemolytic lysis in accordance with the kit standards and quality control. Results are shown in CH50 unit equivalents per milliliter (CH50 U Eq/mL).
Fig. 2.

Overview of CH50 EIA. Microparticles, standards and controls are added to wells containing human serum. During incubation, C1 complex components present in the serum begin to bind to Fc regions and the resulting complex triggers the complement system cascade. This results in the generation of the terminal complement complexes (TCC).
2.5. Monte Carlo simulation of complement activation
To better examine the effect of Fc density on complement activation by Fc-coated particles, we modeled the surface assembly of the C1 complex via multiple immobilized Fc molecules, a critical step of complement activation. A Monte Carlo simulation46 of antibodies randomly distributed on a gridded antigen-coated surface was modeled in MATLAB (MathWorks, Natick, MA). An N × N grid was created to represent a portion of the surface area of the particles. Each element of the grid represents a region of a single, densely packed Fc molecule, formed by attachment of IgG antibody to surface-immobilized antigens. We estimate each element to therefore correspond to a 18 nm × 18 nm square on the particle surface. A random number generator determined whether each element was occupied by a Fc molecule by assigning a value of “0” or “1” to each element on the grid. The probability of occupation was varied to simulate an increase in the amount of Fc on the surface. A total of 100 simulated surfaces were created to represent a range of Fc occupancy. Since the C1 complex binds multivalently to several Fc molecules, we identified dense Fc regions by using a window of elements with a size equivalent to the fully assembled C1 complex. We chose a window size of 3 × 3 elements. The window was raster scanned over the entire grid to evaluate the number of regions which contain a threshold number Fc molecules or greater. Since these regions will more potently initiate the assembly and stabilization of the C1 complex42 and trigger enzymatic activation of subsequent complement signaling molecules, a complement activation metric was developed to quantify the number of dense Fc regions. The metric used an algorithm to first identify regions that are Fc-dense, then count the total number of those regions within the N × N grid. A variety of threshold numbers of Fc molecules were used to identify regions of sufficient density to contribute toward the complement activation metric. We used a threshold value of 4 Fc molecules in the results. The algorithm prohibited double counting of high-density Fc regions by removing previously identified elements that contributed to the complement activation metric. After all elements in the grid were evaluated, we calculated the total complement activation by summing the number of Fc-dense regions. The simulation for each antibody occupancy percentage was repeated 10 times and the results were averaged. A grid size of 15 × 15 elements or greater all produced results that converged to a consistent complement activation metric when normalized to the fully occupied value.
2.6. Statistical analysis
Statistical analysis was conducted by using analysis of variance to determine significance of variables. Tukey–Kramer honestly significant difference (HSD) was used for post-hoc analysis to determine significance between each group.
3. Results
3.1. Increased molar ratio of antibody results in increased density of Fc
We evaluated the average Fc density per particle by measuring the MFI with flow cytometry (see Fig. 3). Fluorescently tagged secondary antibody was used to quantify the relative Fc density per particle. For the particle sizes of 0.5 μm, 1 μm, 2 μm and 4 μm, we measured the MFI for each of the Fc conditions, defined as the molar ratio of Fc to BSA antigen, for the values of: 2:1, 1:1, 1:5, 1:10 and 1:50. We also evaluated the highly saturated molar ratios of 5:1 and 10:1 for the 4 μm particle. As the Fc density was increased, the measured MFI of the particles also increased. We also evaluated the MFI of BSA-only particles and saw minimal fluorescence at each particle size.
Fig. 3.
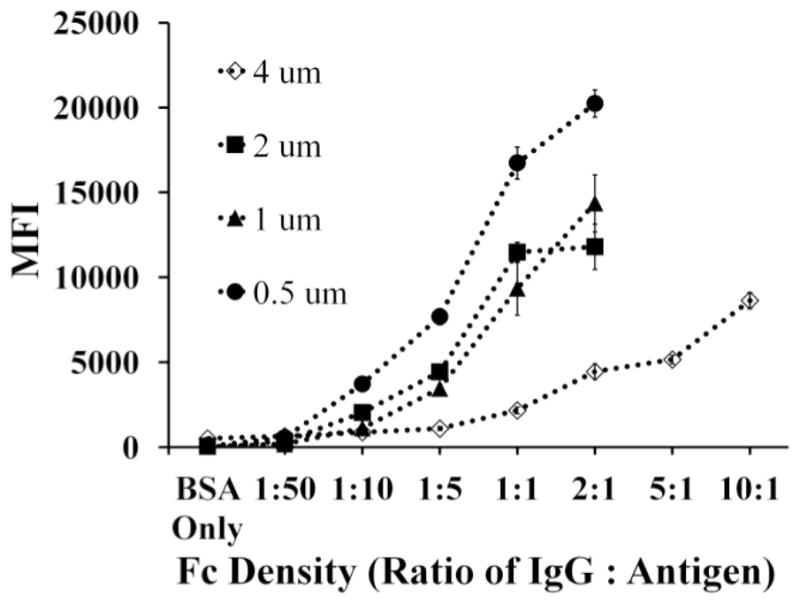
MFI for each Fc density condition across the different particle sizes used for this study.
3.2. Effects of particle size on complement activation
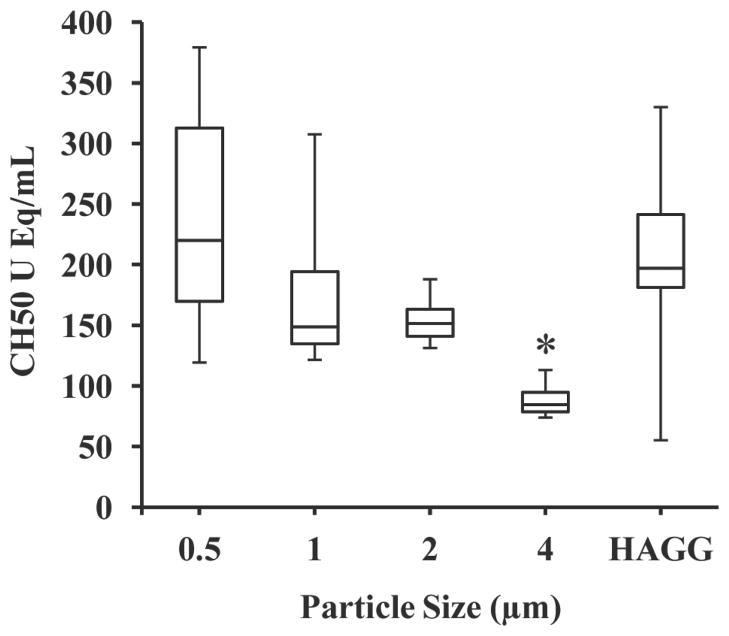
The effect of particle size on complement system activation was determined by evaluating the amount of CH50 equivalents produced as a result of particles coated at the 2:1 Fc density condition (see Fig. 4). The complement system was successfully activated using Fc-functionalized particles of size 0.5 μm, 1 μm, 2 μm and 4 μm. For all but the 4 μm particle sizes, CH50 equivalents were generated at comparable levels to the HAGG activator. We found that equivalent numbers of 4 μm particles generated significantly decreased levels of complement activation than the smaller sized particles (p < 0.01).
Fig. 4.
Effects of particle size on complement activation; *, significantly different from HAGG control (p < 0.01); N = 4.
3.3. Complement system activation depends on Fc density
To better understand our results concerning the effects of particle size (see Fig. 4), the various sized particles were used to evaluate the effects of Fc density on complement system activation. We tested three Fc density conditions, corresponding to a molar ratio of Fc:BSA of 2:1, 1:1 and 1:5 for all particle sizes, as well as particles coated in BSA-only. In addition, to ensure maximal Fc coverage of the 4 μm particles, 5:1 and 10:1 ratios were also tested. HAGG activator was our positive control. Our results showed a remarkable dependence of complement activation on Fc density for all particle sizes (see Figs. 5 and 6). For the 0.5 μm, 1 μm and 2 μm particle sizes, the 2:1 condition, representing a high Fc density, successfully activated the complement system and produced levels of CH50 equivalent to or surpassing the positive HAGG control. In all cases, the 1:1 condition shows a level of complement activation significantly above background (p < 0.05), but below the 2:1 complement activation levels. The 1:5 and BSA-only particles did not activate the complement system efficiently, as the amount of CH50 equivalents generated was significantly lower than the positive control (p < 0.005) as well as the high Fc density conditions of 1:1 (p < 0.05) and 2:1 (p < 0.001). Therefore, Fc density is a significant dependent variable in complement system activation.
Fig. 5.

Effects of Fc Density on complement activation; *, significantly different (SD) from HAGG (p < 0.005);◆, SD from 2:1 Condition (p < 0.001); □, SD from 1:1 Condition (p < 0.05); N = 8 replicates (N = 16 replicates for HAGG).
Fig. 6.
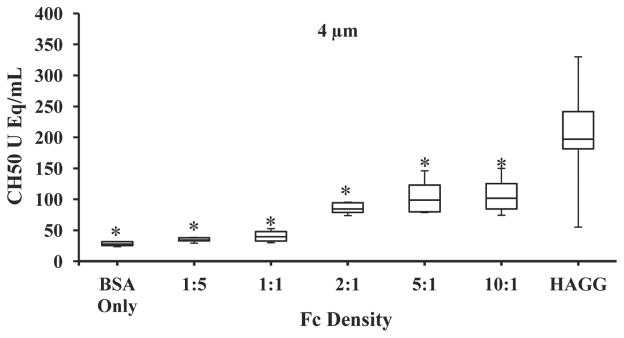
Effects of increased Fc treatment of the 4 μm particle on complement activation; *, significantly different from HAGG (p < 0.001); N = 8 replicates (N = 16 replicates for HAGG).
We observed that for the 4 μm particles, the 2:1 Fc condition did not fully activate the complement system to the level seen in other functionalized particles or in the positive control. To test whether this lack of efficient complement system activation was due to insufficient antibody binding to the particle surface, we also evaluated the effect of higher amounts of added IgG [5:1 and 10:1 ratios (see Fig. 6)]. Despite the increased amount of Fc used to functionalize the particles, we did not observe increased levels of CH50 equivalent activation. This result indicates that 4 μm particles activate complement at lower levels than other particle sizes not because a lack of saturating Fc, but for a reason related to particle size.
3.4. Monte Carlo simulation of complement activation
To estimate the appropriate window size for identifying a threshold Fc density, we compared the size of closely packed antibody–antigen complex, represented by each element in the grid, to the C1 complex size. While individual BSA molecules occupy a linear distance of 7 nm,47 electron microscopy analysis of BSA-antibody complexes determined an average root mean square end-to-end distance of 18 nm.48,49 We acknowledge that these measures only illustrate an estimate for the dimension of the grid, as antibody–antigen binding regions are flexible.50 The linear dimension of the binding region of the C1 complex is determined by the reach of two flexible C1q arms of 18.5 nm length each and a fibril-like stalk of width 4.5 nm.20 The total diameter is approximately 41 nm, though the specific geometry may vary due to the orientation of the globular c-terminal regions.51 Microscopic analysis of antibody complexes and assembled C1q structures on opsonized lipid vesicles show C1 complex size ranging between 50 nm to 100 nm.52,53 Comparing the element size of 18 nm to the size of a C1 complex, which ranges from 41 nm to over 50 nm, we determine that a window of 3 × 3 elements most closely approximates the spatial reach of the C1 complex.
To determine the threshold number of Fc molecules necessary to assemble a C1 complex, we note that the affinity for the assembled C1 complex to Fc molecules increases dramatically in the case of multimers of Fc molecules.42 Clq monomers show only weak binding, in the range of micromolar affinity, to the Fc regions of isolated IgG. However multiple, closely spaced Fc molecules, such as those in immune complexes to repetitive molecular motifs, increase the binding of multivalent Clq a thousand-fold and enhance affinity to the few nanomolar.20,41,42,54 In our model of complement activation, we varied the threshold number of Fc molecules within a 3 × 3 window necessary to contribute to the complement activation metric.
Based upon our experimental data, the activation of the complement system by Fc-functionalized microparticles and nanoparticles did not increase in a manner proportional to Fc density, but instead required a minimum density. To compare the experimental results to our model of complement activation by micro/nanoparticles, we performed a Monte Carlo simulation of the complement system activation process that emphasized the need for a local high density of Fc molecules to initiate C1 complex formation and the subsequent classical complement cascade products. This model assumed an array of antibody binding sites and included a probability of antibody binding at any given site, as shown in a schematic in Fig. 7(a). A grid of elements was generated, in which each element corresponded to a site of possible antigen–antibody complex formation and therefore presentation of Fc. A random number generator determined the binding of the antibody to the antigen. An example of a result of the antibody binding and Fc display over a grid is shown in Fig. 7(b). In this example, the grid contains 15 × 15 elements and the probability of each element containing a Fc molecule is 20%, which is represented as a “1” in each grid element. A 20% occupancy percentage nominally corresponds to the condition of 1:5 molar ratio of antibody to BSA. The antibody occupation probability corresponded to the amount of surface area covered by antibodies for a sufficiently large grid. In this example, we identified by red boxes dense Fc clusters as 4 or more molecules inside the 3 × 3 window, and therefore likely sites of complement activation through C1 complex formation. An activation metric was calculated for the grid at each occupancy percentage and plotted in Fig. 7(c). The results of the activation metric revealed a very low activation value for an occupancy of 0–20%, with a dramatic increase for higher occupancy values, consistent with requirement of C1 multivalency. As we expected, a high probability of antibody binding corresponded to a saturated complement activation value. Other threshold values of Fc within the window of elements were also tested and values of 3 or greater most accurately fit the experimental data.
Fig. 7.
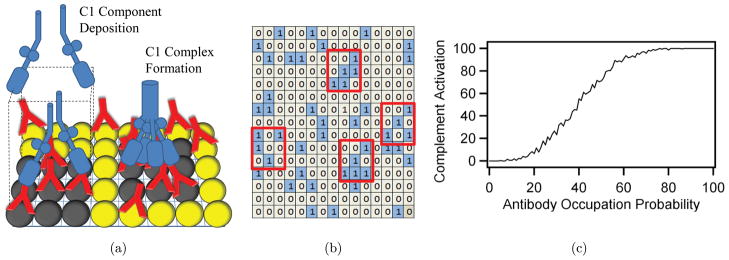
Model of complement system activation. (a) A schematic of packed antigens (spheres) and partial surface coverage of antibodies (Y’s) displaying Fc binding sites. A C1 complex assembles on regions of high Fc density, identified by dark filled spheres, contributing to complement activation. (b) Monte Carlo grid of 15 × 15 elements, where the probability of antibody binding at each element is 20% and displayed as a “1” in each grid element. An algorithm has identified four regions of dense Fc clusters outlined in red, which contribute to the complement system activation metric and (c) A complement activation metric calculates the number of regions of high Fc density. Very low activation is seen below 20% occupancy with a dramatic increase at high occupancy values.
4. Discussion
The immune system is a vital and intricate system necessary for the clearance and defense against invading pathogens, as well as to maintain systemic homeostasis.1–4 Therefore, the ability to initiate, direct and/or modulate the immune system could prove to be an important means to treat and prevent multiple immune-related disorders.5–11 The complement system has been shown to play a role not only in immune-specific diseases,9,10 but in vaccine efficacy14 and inhibition of tumor growth.36,37 By using microparticles and nanoparticles, we have adapted a well-established method previously used to study other immune components14,26,33,55,56 to the activation and modulation of the complement system.
We successfully varied the density of Fc presentation on the particles by varying the molar ratio of IgG added to particles coated with BSA. Our results showed that Fc density has a significant impact on the magnitude of complement activation. While several studies have shown that multiple IgG molecules are needed to efficiently activate the classical complement pathway, none have examined the effect of Fc density when displayed on microparticles and nanoparticles.
It is surprising that an Fc density of 1:5 did not successfully activate the complement system for any of the particle sizes. A 1:5 antibody:antigen ratio nominally represents 20% surface coverage, although the measured coverage varies from 15% to 35% as determined from flow cytometry (see Fig. 1). For uniformly distributed antibody of 20% surface coverage, a Monte Carlo simulation calculated average spacing between Fc molecules as approximately 2.1 element spaces, corresponding to a separation of 38 nm if we assume an antibody–antigen complex size of 18 nm. However, due to stochastic variation in the antibody binding, each particle will on average contain a significant amount of surface area that locally displays a sufficiently high density of Fc to activate complement. Our model has determined that the proportion of the particle surface with a high local density of Fc increases nonlinearly with the surface coverage, as seen in Fig. 7(c). This result suggests a possible explanation for the observed nonlinearity of complement activation with Fc density. We hypothesize therefore that an essential trigger for complement activation by Fc-coated particles is the assembly of the C1 complex on the surface of the particles via binding to multiple, closely apposed Fc molecules. Our model is only illustrative of the importance of Fc density, as it neither accounts for possible confounding effects such as antibody aggregation on the particle surface, Fc orientation due to particle surface curvature, nor other factors that may trigger or inhibit complement activation.
While high Fc density conditions activated the complement system for all the tested particle sizes, the size of the particle played a significant role in determining the magnitude of the activation. For the 0.5 μm and 1 μm particles, there is no complement response for low density of Fc, but the stimulation effect increases dramatically to a plateau at higher Fc density values. The 2 μm particle supports a more tunable platform for complement activation. For the 2 μm particles, only the highest Fc density condition of 2:1 activated the complement system at comparable levels to the HAGG activator. The next highest Fc density condition of 1:1 activated the complement system in significantly lower levels than the HAGG activator (p < 0.005), but it was still higher than the 1:5 and BSA-only condition (p < 0.05). This apparent switch from a binary-like response in smaller particles to a tunable response in mid-range sized particles further highlights the importance of particle size to complement system response. Larger 4 μm particles showed an even less efficient complement activation response. Even at the highest antibody levels tested (10:1), complement activation plateaued at less than half of the positive HAGG control.
This result is all the more surprising considering the number of particles was held constant for each of the experimental conditions during the activation study. Remarkably, when we consider the amount of complement system activation by Fc-functionalized particles per unit surface area, the dependence on particle size is even more clearly demonstrated. It might be expected that complement system activation would be proportional to the surface area of beads and the absolute degree of Fc presentation. Instead, we found that the complement activation per unit area was over 4 orders of magnitude larger for the 0.5 μm beads compared to the 4 μm beads. In addition, a power law function describes the relationship between complement activation per unit area of each particle and particle size, with an exponential dependence of −2.5 (see Fig. 8). This effect results from the combination of lower maximum complement activation for larger particles, as well as an increased surface area of the larger beads. Previous work has shown that an increase in polymer surface area results in an increase in complement system activation.16,39 Our work thus suggests that variation in Fc functionalization of particles also strongly affects the complement response.
Fig. 8.
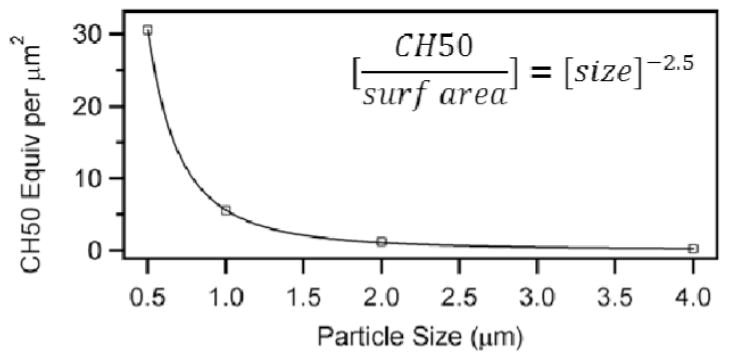
Maximum measured complement activation per μm2 of particles versus particle.
This study represents the first time that polymeric particles artificially coated in Fc were used to activate the complement system. While previous studies had suggested that crosslinking of multiple Fc molecules was the only requirement for initial activation by the classical pathway, our results suggest that the presence of multiple Fc regions is not sufficient to fully activate complement. In our studies, we observed that the complement system response decreases with increasing particle size, for a given Fc density condition. The sensitive dependence of the complement response on Fc density indicates the importance of nanoscale effects in efficiently modulating the response and that particle size can be an independent means to adjust the level of complement response once a threshold of Fc density is attained. While we cannot rule out a possible confounding effect in which particles prepared with similar treatments produce unequal Fc densities, the effect of particle size on complement activation may also be due to inherent biological properties of the complement system.
The topographic curvature of IgM-functionalized particles and peptidoglycan layers has been shown to influence the strength of complement activation, potentially through changes of the orientation of the Fc molecules.39 This study also found that complement system activation was maximized for 250 nm particles with decreased activation for both larger and smaller particle sizes. However, as they used IgM antibodies to dextran already present in human serum samples and did not prefunctionalize the particles, these results could not be used to determine the impact of Fc density on complement. As single IgMs are sufficient to activate complement, this method also does not allow the tuning of complement activation, either through variation in Fc density on complement, or through larger microscale sizes. We cannot currently say whether the observed modulation of complement with particle size is due to the influence of surface curvature, the decrease of diffusive motion leading to increased depletion of reactants, or to some other effect. However, regardless of the reason, the observed inefficiency of complement activation with 4 μm beads could lead to the development of complement-modulation therapeutic agents, while nanoscale particles are better suited to more fully activate complement.
Better understanding the variables involved in successful complement system activation will improve our ability to take advantage of nano-technology in basic or applied immunology. Due to the powerful nature of successful complement system activation, as well as the multiple naturally occurring safeguards in place to prevent an auto-immune response, the observed dependence on particle size and Fc density affirms our hypothesis of the importance of nanoscale effects on complement control. As the complement system response is essential for clearance of pathogens and vaccine efficacy, the ability to modify and/or fine-tune the magnitude of complement system activation with nanotechnology holds significant promise in these broad reaching fields. However, further study is needed to adequately delineate and fully understand the effects of particle size and Fc density, as well as to further identify the specific range of Fc presentation needed to successfully activate the complement cascade.
Acknowledgments
The authors thank the Bill and Melinda Gates Foundation and the National Institutes of Health (grant number 1R21EB013413-01) for support of this research. The authors would also like to thank the National Science Foundation for support of PMP. The authors acknowledge Nathan Hotaling and Dr. Julia Babensee for their assistance in serum collection and helpful suggestions.
Appendix A. Absorbance of Antigen
Fig. A.1.
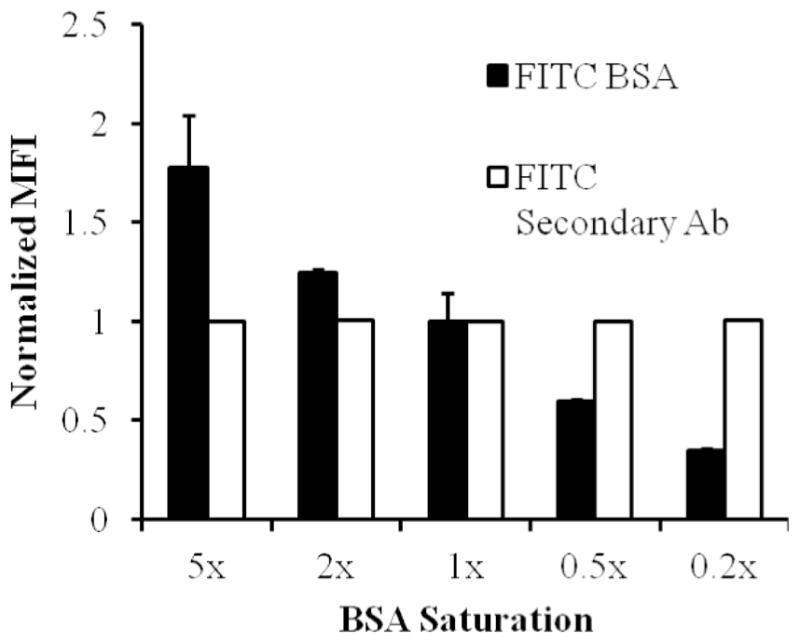
Fluorescein isothiocyante (FITC) labeled BSA was adsorbed in various concentrations, with 1x representing the amount used for our experiments, to determine a saturating limit. The MFI was recorded using a flow cytometer and normalized to the value measured for 1x. This process was then repeated with nonfluorescent BSA. A constant amount of anti-BSA was then added to all BSA conditions in a 2:1 molar ratio of IgG to antigen using the antigen value from the 1x condition. The MFI of the secondary antibody was recorded using a flow cytometer and normalized to the value measured for 1x to determine the amount of Anti-BSA on the particle surface. This shows that the antigen and IgG values used in this study are valid.
Appendix B. Fluorescent Intensity Histograms
Fig. B.1.
Representative histograms of the fluorescent intensity of the fluorescein isothiocyante (FITC) labeled secondary antibody added to each particle conditions and measured by the flow cytometer. These histograms show that the fluorescent intensity decreases as the IgG to antigen ratio decreases. These histograms were used to calculate the MFI for each condition and correlates with the amount of Fc on each particle surface.
Contributor Information
PATRICIA M. PACHECO, Email: ppacheco3@gatech.edu, George W. Woodruff School of Mechanical Engineering, Parker H. Petit Institute for Bioengineering and Bioscience, Georgia Institute of Technology, Atlanta, Georgia 30332, USA
BENJAMIN LE, Email: benjamin3@gatech.edu, Coulter School of Biomedical Engineering, Georgia Institute of Technology, Atlanta, Georgia 30332, USA.
DAVID WHITE, Email: david.m.white@aphis.usda.gov, United States Department of Agriculture, National Centers for Animal Health, Ames, Iowa 50010, USA.
TODD SULCHEK, Email: todd.sulchek@me.gatech.edu, George W. Woodruff School of Mechanical Engineering, Coulter School of Biomedical Engineering, Georgia Institute of Technology, Atlanta, Georgia 30332, USA.
References
- 1.Delves PJ, Roitt IM. N Engl J Med. 2000;343:37. doi: 10.1056/NEJM200007063430107. [DOI] [PubMed] [Google Scholar]
- 2.Delves PJ, Roitt IM. N Engl J Med. 2000;343:108. doi: 10.1056/NEJM200007133430207. [DOI] [PubMed] [Google Scholar]
- 3.Parkin J, Cohen B. Lancet. 2001;357:1777. doi: 10.1016/S0140-6736(00)04904-7. [DOI] [PubMed] [Google Scholar]
- 4.Gordon S, Taylor PR. Nat Rev Immunol. 2005;5:953. doi: 10.1038/nri1733. [DOI] [PubMed] [Google Scholar]
- 5.Finn OJ. N Engl J Med. 2008;358:2704. doi: 10.1056/NEJMra072739. [DOI] [PubMed] [Google Scholar]
- 6.Hansson GK, Libby P. Nat Rev Immunol. 2006;6:508. doi: 10.1038/nri1882. [DOI] [PubMed] [Google Scholar]
- 7.Ross R. N Engl J Med. 1999;340:115. doi: 10.1056/NEJM199901143400207. [DOI] [PubMed] [Google Scholar]
- 8.Smith DA, Germolec DR. Environ Health Perspect. 1999;107:661. doi: 10.1289/ehp.99107s5661. [DOI] [PMC free article] [PubMed] [Google Scholar]
- 9.Walport MJ. N Engl J Med. 2001;344:1058. doi: 10.1056/NEJM200104053441406. [DOI] [PubMed] [Google Scholar]
- 10.Walport MJ. N Engl J Med. 2001;344:1140. doi: 10.1056/NEJM200104123441506. [DOI] [PubMed] [Google Scholar]
- 11.Whitacre CC. Nat Immunol. 2001;2:777. doi: 10.1038/ni0901-777. [DOI] [PubMed] [Google Scholar]
- 12.Heinrich V, Lee CY. J Cell Sci. 2011;124:3041. doi: 10.1242/jcs.086413. [DOI] [PMC free article] [PubMed] [Google Scholar]
- 13.Tan TT, Coussens LM. Curr Opin Immunol. 2007;19:209. doi: 10.1016/j.coi.2007.01.001. [DOI] [PubMed] [Google Scholar]
- 14.Reddy ST, van der Vlies AJ, Simeoni E, et al. Nat Biotechnol. 2007;25:1159. doi: 10.1038/nbt1332. [DOI] [PubMed] [Google Scholar]
- 15.Moghimi SM, Andersen AJ, Ahmadvand D, et al. Adv Drug Deliv Rev. 2011;63:1000. doi: 10.1016/j.addr.2011.06.002. [DOI] [PubMed] [Google Scholar]
- 16.Montdargent B, Toufik J, Carreno MP, et al. Biomaterials. 1992;13:571. doi: 10.1016/0142-9612(92)90024-i. [DOI] [PubMed] [Google Scholar]
- 17.Szebeni J, Muggia F, Gabizon A, et al. Adv Drug Deliv Rev. 2011;63:1020. doi: 10.1016/j.addr.2011.06.017. [DOI] [PubMed] [Google Scholar]
- 18.Ricklin D, Hajishengallis G, Yang K, et al. Nat Immunol. 2010;11:785. doi: 10.1038/ni.1923. [DOI] [PMC free article] [PubMed] [Google Scholar]
- 19.Sim RB, Tsiftsoglou SA. Biochem Soc Trans. 2004;32:21. doi: 10.1042/bst0320021. [DOI] [PubMed] [Google Scholar]
- 20.Porter RR, Reid KB. Adv Protein Chem. 1979;33:1. doi: 10.1016/s0065-3233(08)60458-1. [DOI] [PubMed] [Google Scholar]
- 21.Schumaker VN, Zavodszky P, Poon PH. Annu Rev Immunol. 1987;5:21. doi: 10.1146/annurev.iy.05.040187.000321. [DOI] [PubMed] [Google Scholar]
- 22.Duncan AR, Winter G. Nature. 1988;332:738. doi: 10.1038/332738a0. [DOI] [PubMed] [Google Scholar]
- 23.Carroll MC. Nat Immunol. 2004;5:981. doi: 10.1038/ni1113. [DOI] [PubMed] [Google Scholar]
- 24.Molina H, Holers VM, Li B, et al. Proc Natl Acad Sci USA. 1996;93:3357. doi: 10.1073/pnas.93.8.3357. [DOI] [PMC free article] [PubMed] [Google Scholar]
- 25.Stager S, Alexander J, Kirby AC, et al. Nat Med. 2003;9:1287. doi: 10.1038/nm933. [DOI] [PubMed] [Google Scholar]
- 26.Champion JA, Walker A, Mitragotri S. Pharm Res. 2008;25:1815. doi: 10.1007/s11095-008-9562-y. [DOI] [PMC free article] [PubMed] [Google Scholar]
- 27.Demento SL, Eisenbarth SC, Foellmer HG, et al. Vaccine. 2009;27:3013. doi: 10.1016/j.vaccine.2009.03.034. [DOI] [PMC free article] [PubMed] [Google Scholar]
- 28.Kumar MNVR. J Pharm Pharm Sci. 2000;3:234. [PubMed] [Google Scholar]
- 29.Al-Hanbali O, Rutt KJ, Sarker DK, et al. J Nanosci Nanotechnol. 2006;6:3126. doi: 10.1166/jnn.2006.406. [DOI] [PubMed] [Google Scholar]
- 30.Moghimi SM, Hunter AC, Dadswell CM, et al. Biochim Biophys Acta. 2004;1689:103. doi: 10.1016/j.bbadis.2004.02.005. [DOI] [PubMed] [Google Scholar]
- 31.Vonarbourg A, Passirani C, Saulnier P, et al. Biomaterials. 2006;27:4356. doi: 10.1016/j.biomaterials.2006.03.039. [DOI] [PubMed] [Google Scholar]
- 32.Ahsan FL, Rivas IP, Khan MA, et al. J Controlled Release. 2002;79:29. doi: 10.1016/s0168-3659(01)00549-1. [DOI] [PubMed] [Google Scholar]
- 33.Reddy ST, Swartz MA, Hubbell JA. Trends Immunol. 2006;27:573. doi: 10.1016/j.it.2006.10.005. [DOI] [PubMed] [Google Scholar]
- 34.Gallo P, Goncalves R, Mosser DM. Immunol Lett. 2010;133:70. doi: 10.1016/j.imlet.2010.07.004. [DOI] [PMC free article] [PubMed] [Google Scholar]
- 35.Vorup-Jensen T. Adv Drug Deliv Rev. 2012;64:1759. doi: 10.1016/j.addr.2012.06.003. [DOI] [PubMed] [Google Scholar]
- 36.Markiewski MM, Lambris JD. Trends Immunol. 2009;30:286. doi: 10.1016/j.it.2009.04.002. [DOI] [PMC free article] [PubMed] [Google Scholar]
- 37.Markiewski M, DeAngelis R, Benencia F, et al. Mol Immunol. 2008;45:4151. [Google Scholar]
- 38.Devine DV, Wong K, Serrano K, et al. Bba-Biomembranes. 1994;1191:43. doi: 10.1016/0005-2736(94)90231-3. [DOI] [PubMed] [Google Scholar]
- 39.Pedersen MB, Zhou XF, Larsen EKU, et al. J Immunol. 2010;184:1931. doi: 10.4049/jimmunol.0902214. [DOI] [PubMed] [Google Scholar]
- 40.Harashima H, Huong TM, Ishida T, et al. Pharm Res. 1996;13:1704. doi: 10.1023/a:1016401025747. [DOI] [PubMed] [Google Scholar]
- 41.Burton DR. Mol Immunol. 1985;22:161. doi: 10.1016/0161-5890(85)90151-8. [DOI] [PubMed] [Google Scholar]
- 42.Wright JK, Tschopp J, Jaton JC, et al. Biochem J. 1980;187:775. doi: 10.1042/bj1870775. [DOI] [PMC free article] [PubMed] [Google Scholar]
- 43.Lambris JD, Reid KBM, Volanakis JE. Immunol Today. 1999;20:207. doi: 10.1016/s0167-5699(98)01417-0. [DOI] [PubMed] [Google Scholar]
- 44.Flierl MA, Gaudiani JL, Sabel AL, Long CS, Stahel PF, Mehler PS. Ann Gen Psychiatry. 2011;10:16. doi: 10.1186/1744-859X-10-16. [DOI] [PMC free article] [PubMed] [Google Scholar]
- 45.Seregin SS, Hartman ZC, Appledorn DM, et al. J Innate Immun. 2010;2:353. doi: 10.1159/000284368. [DOI] [PMC free article] [PubMed] [Google Scholar]
- 46.Busch NA, Wertheim MS, Yarmush ML. J Chem Phys. 1996;104:3962. [Google Scholar]
- 47.Armstrong JK, Wenby RB, Meiselman HJ, et al. Biophys J. 2004;87:4259. doi: 10.1529/biophysj.104.047746. [DOI] [PMC free article] [PubMed] [Google Scholar]
- 48.Murphy RM, Slayter H, Schurtenberger P, et al. Biophys J. 1988;54:45. doi: 10.1016/S0006-3495(88)82929-1. [DOI] [PMC free article] [PubMed] [Google Scholar]
- 49.Ban N, Escobar C, Garcia R, et al. Proc Natl Acad Sci USA. 1994;91:1604. doi: 10.1073/pnas.91.5.1604. [DOI] [PMC free article] [PubMed] [Google Scholar]
- 50.Werner TC, Cathou RE, Bunting JR. Proc Natl Acad Sci USA. 1972;69:795. doi: 10.1073/pnas.69.4.795. [DOI] [PMC free article] [PubMed] [Google Scholar]
- 51.Schneider S, Zacharias M. Mol Immunol. 2012;51:66. doi: 10.1016/j.molimm.2012.02.111. [DOI] [PubMed] [Google Scholar]
- 52.Henry N, Parce JW, McConnell HM. Proc Natl Acad Sci USA. 1978;75:3933. doi: 10.1073/pnas.75.8.3933. [DOI] [PMC free article] [PubMed] [Google Scholar]
- 53.Parce JW, Henry N, McConnell HM. Proc Natl Acad Sci USA. 1978;75:1515. doi: 10.1073/pnas.75.3.1515. [DOI] [PMC free article] [PubMed] [Google Scholar]
- 54.Hughesjones NC, Gardner B. Mol Immunol. 1979;16:697. doi: 10.1016/0161-5890(79)90010-5. [DOI] [PubMed] [Google Scholar]
- 55.Blanchette CD, Woo YH, Thomas C, et al. PLoS One. 2009;4:e6056. doi: 10.1371/journal.pone.0006056. [DOI] [PMC free article] [PubMed] [Google Scholar]
- 56.Mitragotri S, Lahann J. Nat Mater. 2009;8:15. doi: 10.1038/nmat2344. [DOI] [PMC free article] [PubMed] [Google Scholar]
- 57.Pacheco P, White D, Sulchek T. PLoS One. 2013;8:e60989. doi: 10.1371/journal.pone.0060989. [DOI] [PMC free article] [PubMed] [Google Scholar]


