Abstract
Anthocyanins are plant pigments occurring in flowers and berry fruits. Since a phenomenon of food-drug interactions is increasingly emerging, we examined the effects of 21 major anthocyanins and the extracts from 3 food supplements containing anthocyanins on the aryl hydrocarbon receptor (AhR) – cytochrome P450 CYP1A1 signaling pathway in human hepatocytes and human hepatic HepG2 and intestinal LS174T cancer cells. Pelargonidin-3-O-rutinoside (PEL-2) and cyanidin-3,5-O-diglucoside (CYA-3) dose-dependently activated AhR, as revealed by gene reporter assay. PEL-2 and CYA-3 induced CYP1A1 mRNA but not protein in HepG2 and LS174T cells. Neither compound induced CYP1A1 mRNA and protein in four different primary human hepatocytes cultures. The effects of PEL-2 and CYA-3 on AhR occurred by ligand-dependent and ligand-independent mechanisms, respectively, as demonstrated by ligand binding assay. In a direct enzyme inhibition assay, none of the antocyanins tested inhibited the CYP1A1 marker activity to less than 50% even at 100 µM concentration. PEL-2 and CYA-3 at 100 µM inhibited CYP1A1 to 79% and 65%, respectively. In conclusion, with exception of PEL-2 and CYA-3, there were no effects of 19 major anthocyanins and 3 food supplements containing anthocyanins on AhR-CYP1A1 signaling, implying zero potential of these compounds for food-drug interactions with respect to AhR-CYP1A1 pathway.
Keywords: aryl hydrocarbon receptor, cytochrome P450, anthocyanins, food-drug interactions, food supplements
1. INTRODUCTION
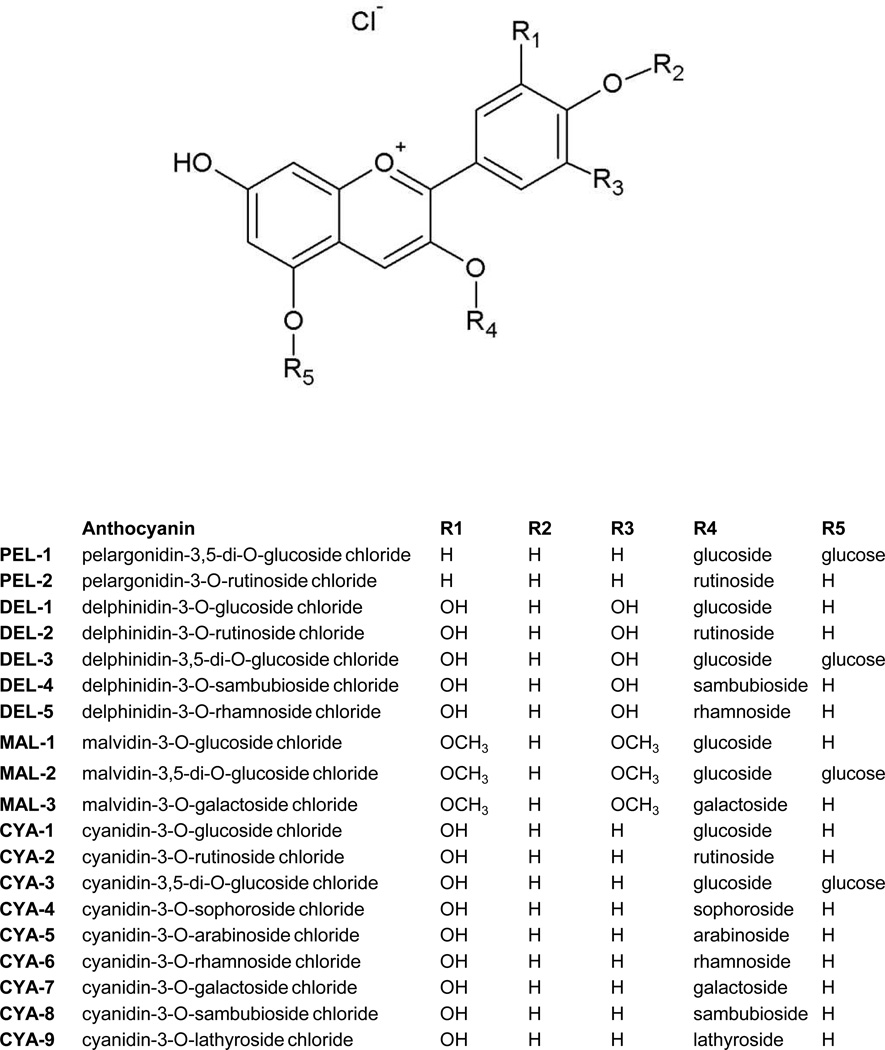
Anthocyanins, the sub-group of flavonoids, are the plant pigments responsible for red, blue or purpure colors of berries, grapes, apples, purple cabbage and corn. They are water-soluble compounds occurring in plants primarily in the form of glycosidic polyhydroxyl and polymethoxyl derivatives of flavylium salts (Winkel-Shirley 2001). Anthocyanins are attached with one or more sugars such as glucose, galactose, arabinose, xylose, rhamnose and glucoronid acid (Welch et al. 2008). They differ in the number of hydroxyl and methoxyl groups, in the position of attachment of sugars and in a number of aliphatic or aromatic acids attached to sugars in the molecule (Figure 1). Epidemiologic studies demonstrated that anthocyanins-containing foodstuffs possess anti-oxidant, anti-obesity and anti-inflammatory effects and due to them they lower the risk of diabetes, cardiovascular disease, arthritis and cancer (Prior and Wu 2006). Consequently, a vast number of dietary supplements, containing anthycyanins, is available at the market worldwide. These supplements are provided in several forms, including dried juice, dried fruits or water extracts from fruits. Major source for the supplements are blueberries, cranberries, raspberries and grape wine fruits and leaves. The concentration (content) of anthocyanins in single dose of dietary supplement can be in some cases unexpectedly high. For instance, food supplement Urinal Akut® (Walmark a.s., Czech Republic), used in the current study, contains in one tablet the amount of extract equivalent to 338 400 mg of fresh cranberries, as declared by manufacturer. Therefore, very high concentrations of anthocyanins are attained in gastrointestinal tract, and perhaps in portal vein and liver of consumers, leading potentially to food-drug interactions.
Figure 1. Chemical structures of anthocyanins.
Signaling pathway aryl hydrocarbon receptor (AhR) – cytochrome P450 CYP1A1 is involved in the metabolism of xenobiotics, as well as in homeostasis of endogenous compounds such as eicosanoids or retinoids. In addition, AhR plays a role in chemically induced carcinogenesis (Haarmann-Stemmann et al. 2012), immune response, cell differentiation, cell cycle, adaptive skin responses (Haarmann-Stemmann et al. 2013) and many other cellular functions (Abel and Haarmann-Stemmann 2010). It was demonstrated that some flavonoids act as AhR agonists leading to increased transcription of CYP1A1 gene (Hodek et al. 2002). However, the complex study focused on anthocyanins was not performed yet. We have recently examined the effects of six major anthocyanidins, the aglycones of anthocyanins, on AhR-CYP1A1 pathway (Kamenickova et al. 2013).
In the present study, we investigated the effects of 21 major anthocyanins and the extracts from 3 food supplements containing anthocyanins on the AhR-CYP1A1 signaling pathway in human hepatocytes and human hepatic HepG2 and intestinal LS174T cancer cells.
2. MATERIALS AND METHODS
2.1. Compounds and reagents
Dimethylsulfoxide (DMSO) and hygromycin B were purchased from Sigma-Aldrich (Prague, Czech Republic). The anthocyanins, peonidin-3-O-glucoside chloride (PEO-1; ref.#0929S; purity ≥95%), peonidin-3-O-rutinoside chloride (PEO-2; ref.#0945S; purity ≥95%), pelargonidin-3,5-di-O-glucoside chloride (PEL-1; syn. pelargonin; ref.#0903S; purity ≥90%), pelargonidin-3-O-rutinoside chloride (PEL-2; ref. #0943S; purity ≥90%), delphinidin-3-O-glucoside chloride (DEL-1; syn. myrtillin; ref. #0938S; purity ≥95%), delphinidin-3-O-rutinoside chloride (DEL-2; syn. tulipanin; ref. #0901S; purity ≥95%), delphinidin-3,5-di-O-glucoside chloride (DEL-3; syn. delphin; ref. #0941S; purity ≥97%), delphinidin-3-O-sambubioside chloride (DEL-4; ref. #0948S; purity ≥90%), delphinidin-3-O-rhamnoside chloride (DEL-5; ref. #0940S; purity ≥90%), malvidin-3-O-glucoside chloride (MAL-1; syn. oenin; ref. #0911S; purity ≥95%), malvidin-3,5-di-O-glucoside chloride (MAL-2; syn. malvin; ref. #0930S; purity ≥95%), malvidin-3-O-galactoside chloride (MAL-3; syn. primulin; ref. #0931S; purity ≥97.5%), cyanidin-3-O-glucoside chloride (CYA-1; syn. kuromanin, asterin, chrysanthemin; ref. #0915S; purity ≥96%), cyanidin-3-O-rutinoside chloride (CYA-2; syn. keracyanin; ref. #0914S; purity ≥96%), cyanidin-3,5-di-O-glucoside chloride (CYA-3; cyanin; ref. #0932S; purity ≥97%), cyanidin-3-O-sophoroside chloride (CYA-4; ref. #0937S; purity ≥95%), cyanidin-3-O-arabinoside chloride (CYA-5; ref. #0908S; purity ≥97%), cyanidin-3-O-rhamnoside chloride (CYA-6; ref. #0939S; purity ≥90%), cyanidin-3-O-galactoside chloride (CYA-7; syn. ideain; ref. #0923S; purity ≥97%), cyanidin-3-O-sambubioside chloride (CYA-8; ref. #0949S; purity ≥95%), cyanidin-3-O-lathyroside chloride (CYA-9; ref. #0936S; purity ≥97%) and proanthocyanidin A2 (PAC, purity ≥97%) were purchased from Extrasynthese (Lyon, France). Luciferase lysis buffer and P450-Glo CYP1A1 assay were from Promega (www.promega.com; Hercules, CA). 2,3,7,8-Tetrachlorodibenzo-p-dioxin (TCDD) was from Ultra Scientific (RI, USA). Oligonucleotide primers used in RT-PCR reactions were from Invitrogen. LightCycler FastStart DNA MasterPLUS SYBR Green I was from Roche Diagnostic Corporation (Intes Bohemia, Czech Republic). Following dietary supplements were purchased in public pharmacy store: SUP-1 (Antistax®, Tablets à 360 mg of Vitis viniferae folii extractum aquosum siccum, total amount of anthocyanins 24 mg/100g with the major components being malvidin-3-glucoside (17.5 mg/100g), and cyanidin-3-glucoside (4.8 mg/100g), Boehringer Ingelheim International GmbH, Germany), SUP-2 (Urinal Akut®, Tablets à 36 mg of proanthocyanidins, the amount of anthocyanins 44 mg/100g with the highest representation of cyanidin-3-arabinoside (32.9 mg/100g), and cyanidin-3-galactoside (9.8 mg/100g), Walmark a.s., Czech Republic), SUP-3 (Ostrovid, Tablets à 40 mg of extract from Vaccinium myrtillus, the amount of anthocyanins 911 mg/100g with the highest amount of cyanidin-3-glucoside (714.2 mg/100g), cyanidin-3-galactoside (66.7 mg/100g), delphinidin-3-glucoside (58.2 mg/100 mg), and malvidin-3-glucoside (41.6 mg/100g), Swiss Herbal Remedies Ltd., Canada). Amount of anthocyanins was determined by HPLC by a standard method (Durst R.W. 2001). The extracts were prepared by pulverizing and dissolving 1 tablet of each supplement in 3 mL of sterile distilled water. All other chemicals were of the highest quality commercially available.
2.2. Human hepatocytes
Human hepatocytes were isolated from human liver obtained from multiorgan donors LH45 (M, 46 years), LH46 (M, 37 years), LH47 (M, 47 years) and LH49 (M, 38 years); tissue acquisition protocol was in accordance with the requirements issued by local ethical commission in the Czech Republic. Hepatocytes were treated in a serum-free medium for 24 h or 48 h with the tested compounds, TCDD (5 nM) and/or vehicle (DMSO; 0.1% v/v). Cultures were maintained at 37°C and 5% CO2 in a humidified incubator.
2.3. Human cancer cell lines
Human Caucasian hepatocellular carcinoma cells HepG2 (ECACC No. 85011430) and human Caucasian colon adenocarcinoma cells LS174T (ECACC No. 87060401) were purchased from ECACC and were cultured as recommended by manufacturer. Cells were maintained at 37°C and 5% CO2 in a humidified incubator.
2.4. Gene reporter assay
Stably transfected gene reporter cell line AZ-AHR, which was derived from HepG2 cells transfected with a construct containing several AhR binding sites upstream of a luciferase reporter gene, were used (Novotna et al. 2011). Following plating, cells were stabilized for 16 h and then incubated for 24 h with tested compounds, tested extracts, TCDD (5 nM), and/or vehicle (DMSO; 0.1% v/v). After the treatments, cells were lysed using Reporter Lysis Buffer (Promega, Madison, WI, USA) according to manufacturers´ instructions, and luciferase activity was measured.
2.5. Quantitative reverse transcriptase polymerase chain reaction (qRT-PCR)
Total RNA was isolated using TRI Reagent® and cDNA was synthesized according to the common protocol, using M-MLV Reverse Transcriptase F-572 (Finnzymes) and random hexamers 3801 (Takara). qRT-PCR was carried out on Light Cycler apparatus 480 II (Roche Diagnostic Corporation, Prague, Czech Republic). The levels of CYP1A1 and GAPDH mRNAs were determined as described elsewhere (Dvorak et al. 2008). The measurements were performed in triplicates. Gene expression levels were normalized to glyceraldehyde-3-phosphate dehydrogenase (GAPDH), a housekeeping gene. Data were processed by delta-delta method.
2.6. Protein detection and Western blotting
Total protein extracts were prepared as described elsewhere (Pavek et al. 2007). Following SDS-PAGE separation and Western-blot transfer, blots were probed with antibody against CYP1A1 (goat polyclonal; sc-1616), purchased from Santa Cruz Biotechnology (Santa Cruz, USA). Chemiluminescent detection was performed using horseradish peroxidase-conjugated secondary antibody and an Amersham (GE Healthcare) ECL kit.
2.7. Enzyme activity of CYP1A1 in human liver microsomes
Pooled human liver microsomes were obtained from Biopredic (Rennes, France) in accordance with ethical regulations of the country of origin (France). They were from twenty-six donors (twenty males and six females) with a protein content of 25 mg/mL; the CYP1A1/2, CYP2A6, CYP2B6, CYP2C9, CYP2C19, CYP2E1 and CYP3A4/5 enzyme activities were verified before the experiment.
Activity of CYP1A1 was evaluated using a luciferase based assay with CYP1A1 specific substrate Luciferin-CEE (www.promega.com, Promega, Hercules, CA). Formation of product of the reaction was determined by measuring the luminescence using Infinite M200 spectrophotometer/spectrofluorometer/luminometer (TECAN Austria, Vienna). Incubation mixture contained 100 mM potassium phosphate buffer (pH 7.4). Aqueous stock solution of anthocyanins and proanthocyanidin A2 was 1 mM (pH 6.7). Final reaction mixture volume was 100 µL. Inhibition experiments were performed with five concentrations of anthocyanins (0, 10, 20, 40, 80, 100 µM). With luciferin-CEE luminogenic substrate, microsomes with 22 pmol total CYP were preincubated with 60 µM luciferin-CEE and with the respective anthocyanin (same final concentrations as above) for 30 minutes at 37°C; then, NADPH-generating system was added (0.8 mM NADP+, 5.8 mM isocitrate, 0.3 unit/mL of isocitrate dehydrogenase and 8 mM MgCl2), and the system was incubated for 10 min. Detection reagent was then added and the reaction mixture was incubated again for 20 min. according to the recommended protocol (www.promega.com). Two independent experiments were done with duplicates which did not differ by more than 10%. Inhibition of CYP1A1 activity was in all cases evaluated by plotting the respective remaining activity versus the inhibitor concentration.
2.8. AhR ligand binding assay
[3H]TCDD was kindly provided by Dr Steven Safe (Texas A&M university) and 2,3,7,8- tetrachlorodibenzofuran (TCDF) was from Accustandard (New Haven, CT USA). The competitive displacement of [3H]TCDD from guinea pig hepatic cytosol was as previously described (Korashy et al. 2011). Briefly, hepatic guinea pig cytosol diluted to 8 mg/mL protein in MEDG (25 mM MOPS-NaOH, pH 7.5, 1 mM EDTA, 1 mM DTT, 10% v/v glycerol) was incubated with different concentrations of PEL-2 (pelargonidin-3-O-rutinoside chloride), CYA-3 (cyanidin-3,5-di-O-glucoside chloride) or 200 nM TCDF for 1 h at room temperature in the presence of 2 nM [3H]TCDD. The amount of [3H]TCDD specific binding was determined by hydroxyapatite protocol, and specific binding was determined as the difference between the ‘no competitor’ and TCDF reaction (Denison 2002). [3H]TCDD specific activity was 9.5 Ci/mmol. Non-specific binding was approximately 30% of total binding, i.e. specific binding was approximately 70% of total binding.
3. RESULTS
3.1. Effects of anthocyanins on transcriptional activity of AhR in AZ-AHR reporter cells
In the first series of experiments, we examined the effects of 21 different anthocyanins (chemical structures shown in Figure 1; abbreviations explained in section 2.1.), proanthocyanidin A2, and extracts from 3 dietary supplements containing anthocyanins, on transcriptional activity of AhR in recombinant AZ-AHR cells, which are HepG2 cells that had been stably transfected with an AhR-responsive luciferase reporter plasmid (Novotna et al. 2011). Cells were incubated for 24 h with 21 different anthocyanins (10 µM and 50 µM), proanthocyanidin A2 (10 µM and 50 µM), extracts from 3 dietary supplements (1000 × dilution), TCDD (5 nM) or vehicle (0.1% v/v DMSO). In nine independent experiments, induction of luciferase activity by 5 nM TCDD varied from 87-fold to 1023-fold.
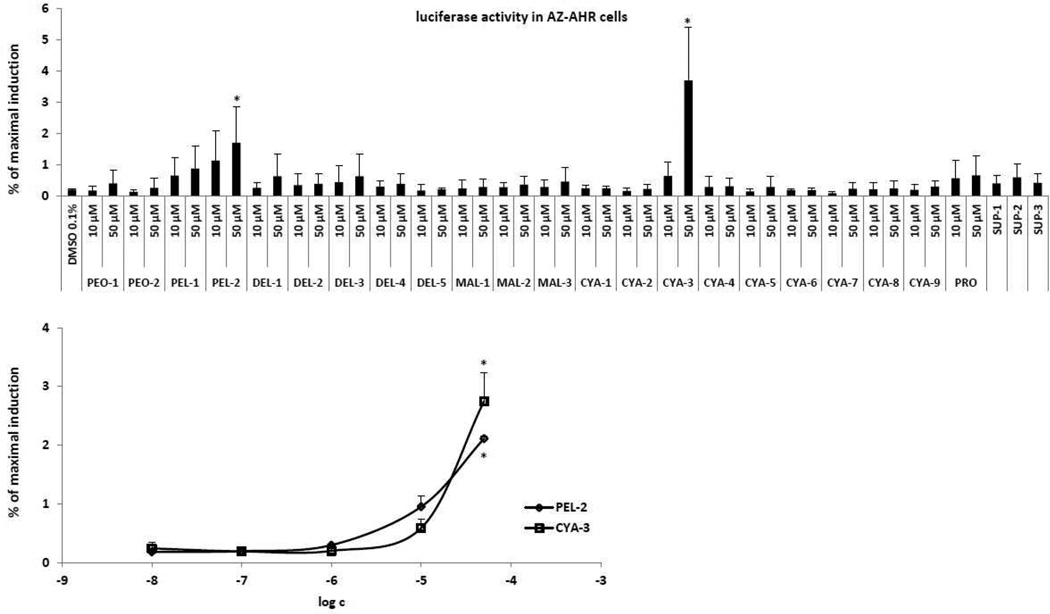
Anthocyanins PEL-2 (pelargonidin-3-O-rutinoside) and CYA-3 (cyaniding-3,5-di-O-glucoside) produced a concentration-dependent induction of luciferase activity, which was significantly different from vehicle at concentration of 50 µM (Figure 2). Although the magnitude of induction by 50 µM PEL-2 and CYA-3 was 10-fold and 17-fold greater than that of the vehicle (DMSO) control, respectively, the magnitude of the induction response was very low when compared to TCDD (i.e. between 2% and 3% of the maximal level of induction by TCDD). No significant induction of luciferase activity was observed with other 19 anthocyanins, proanthocyanidin A2 and extracts from food supplements (dilution 1000 × SUP-1, SUP-2, SUP-3). Taken together, these results indicate that PEL-2 and CYA-3 are weak AhR agonists. Based on the data above, we did not further test extracts from food supplements and proanthocyanidin A2 for their effects on AhR-CYP1A1 pathway in cell lines.
Figure 2. Effects of anthocyanins on transcriptional activity of AhR in AZ-AHR transgenic cell line.
AZ-AHR cells were plated at 96-well plates and stabilized for 16 h. Bar graph: Cells were treated for 24 h with 21 anthocyanins (10 µM and 50 µM; i.e. PEO-1, PEO-2, PEL-1, PEL-2, DEL-1, DEL-2, DEL-3, DEL-4, DEL-5, MAL-1, MAL-2, MAL-3, CYA-1, CYA-2, CYA-3, CYA-4, CYA-5, CYA-6, CYA-7, CYA-8, CYA-9), proanthocyanidin A2 (10 µM and 50 µM; PRO), extracts from food supplements (SUP-1, SUP-2, SUP-3), 2,3,7,8- tetrachlorodibenzo-p-dioxin (TCDD; 5 nM) and/or vehicle (DMSO; 0.1% v/v). Plot graph: Cells were treated for 24 h with PEL-2 and CYA-3 in concentrations of 10 nM, 100 nM, 1 µM, 10 µM and 50 µM. After the treatments, cells were lysed and luciferase activity was measured. The data are the mean from triplicate measurements and are expressed as a percentage of the induction attained by TCDD. Experiments were performed in three different passages of AZ-AHR cells. The differences between individual measurements were lower that 5%. * - values significantly different from the vehicle value (p < 0.05) as determined by the Student’s t-test.
3.2. Effects of anthocyanins on CYP1A1 expression in HepG2 and LS174T cancer cells
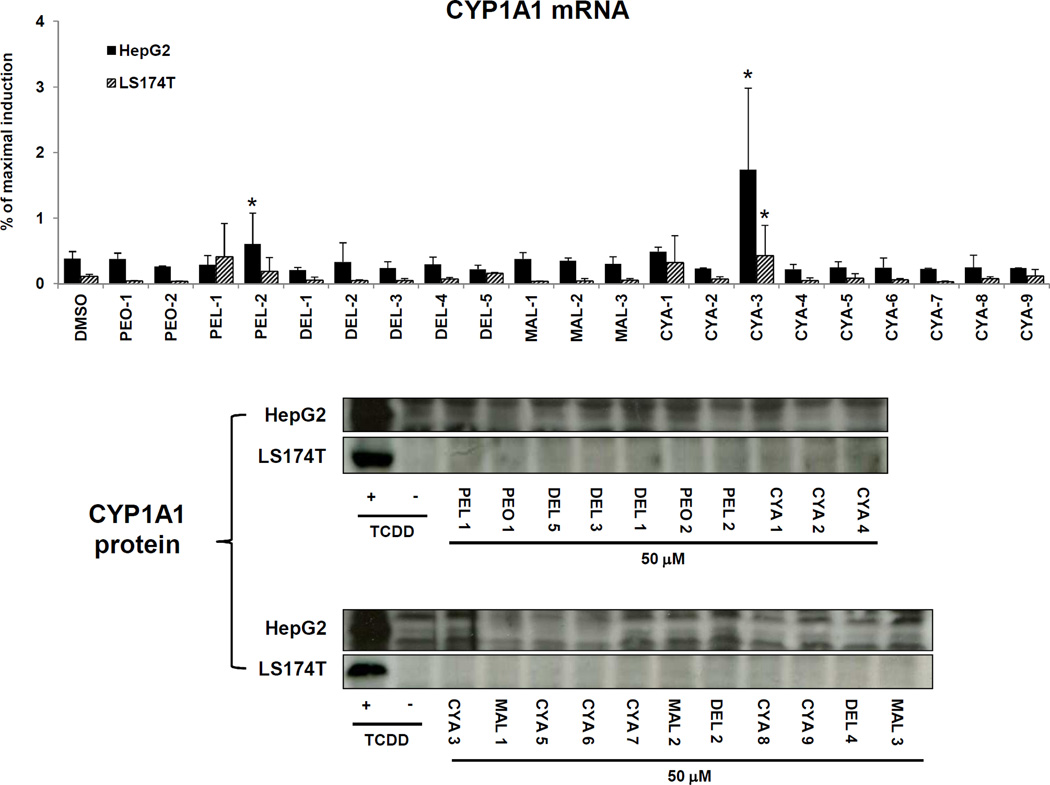
We studied the effects of anthocyanins on the expression of CYP1A1, a typical target gene of ligand- and AhR-dependent signal transduction. We determined the levels of CYP1A1 mRNA and protein in hepatic HepG2 and intestinal LS174T human cancer cells, which were incubated with 21 different anthocyanins (50 µM), TCDD (5 nM) and DMSO (0.1% v/v) for 24 h and 48 h. In two independent experiments, TCDD strongly induced CYP1A1 mRNA after 24 h of incubation in HepG2 cells (322-fold and 216-fold) and in LS174T cells (1003-fold and 724-fold). The level of CYP1A1 mRNA was significantly increased by PEL-2 and CYA-3 in HepG2 cells, and by CYA-3 in LS174T cells, while other 19 anthocyanins had no significant effects on CYP1A1 mRNA in either cell line. However, PEL-2 and CYA-3 were relatively weak inducers of CYP1A1 mRNA in both cell lines, increasing CYP1A1 mRNA levels by only about 0.5% – 2% of that observed with a maximal inducing concentration of TCDD (Figure 3). These results are consistent with those obtained from AZ-AHR cells, and further support the conclusion that PEL-2 and CYA-3 are AhR agonists, albeit relatively weak compared to TCDD. In contrast, none of the 21 anthocyanins tested increased the levels of CYP1A1 protein in HepG2 and LS174T cells after 48 h incubation, whereas TCDD strongly induced CYP1A1 protein in both cell lines (Figure 3). This discrepancy is probably due to weak induction of mRNA and hence not detectable change in protein level.
Figure 3. Effects of anthocyanins on the expression of CYP1A1 in HepG2 and LS174T cells.
Upper panel: Cells were incubated for 24 h with 21 anthocyanins (10 µM and 50 µM; i.e. PEO-1, PEO-2, PEL-1, PEL-2, DEL-1, DEL-2, DEL-3, DEL-4, DEL-5, MAL-1, MAL-2, MAL-3, CYA-1, CYA-2, CYA-3, CYA-4, CYA-5, CYA-6, CYA-7, CYA-8, CYA-9), TCDD (5 nM) and vehicle (DMSO; 0.1% v/v). Bar graph shows RT-PCR analyses (2 independent experiments) of CYP1A1 mRNA. The data are the mean from triplicate measurements and are expressed as a percentage of maximal induction attained in TCDD-treated cells. The data were normalized per GAPDH mRNA levels. * - value is significantly different from DMSO-treated cells (p < 0.05) as determined by the Student’s t-test. Lower panel: Cells were incubated for 48 h with 21 anthocyanins (10 µM and 50 µM; i.e. PEO-1, PEO-2, PEL-1, PEL-2, DEL-1, DEL-2, DEL-3, DEL-4, DEL-5, MAL-1, MAL-2, MAL-3, CYA-1, CYA-2, CYA-3, CYA-4, CYA-5, CYA-6, CYA-7, CYA-8, CYA-9), TCDD (5 nM) and vehicle (DMSO; 0.1% v/v). Western blots show a representative analysis of CYP1A1 protein. Similar profiles were observed in two independent experiments. As a loading control, the blots were probed to actin (data not shown).
3.3. Effects of anthocyanins on CYP1A1 expression in primary human hepatocytes
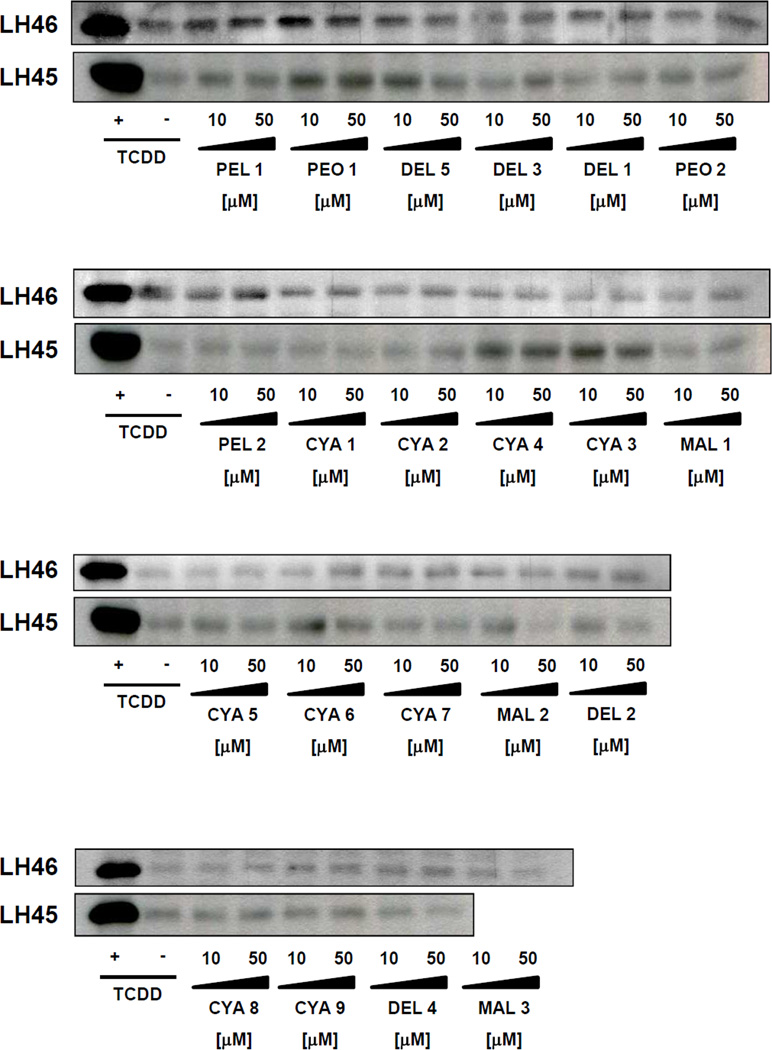
In the next series of experiments, we tested the effects of anthocyanins on the expression of CYP1A1 mRNA and protein in primary human hepatocytes. In contrast to the cell lines, human hepatocytes express a full panel of drug-metabolizing enzymes, hence, the mixed effects of the parent compounds and their metabolites are examined. Therefore, we also tested the effects of extracts from food supplements. Four different primary human hepatocytes cultures were used (LH45, LH46, LH47, LH49). Dioxin strongly induced the expression of CYP1A1 mRNAs in all human hepatocytes cultures at 24 h, and the magnitude of induction in cultures LH45, LH46, LH47 and LH49 was 125-fold, 344-fold, 105-fold and 71-fold, respectively. The levels of CYP1A1 protein were strongly induced after 48 h of incubation with 5 nM TCDD in four human hepatocytes cultures; data shown for two cultures (Figure 4). While slight induction of CYP1A1 mRNA and protein was observed for some of the tested anthocyanins, these increases occurred in a culture dependent manner, i.e. they were not systematic (Table 1; Figure 4).
Figure 4. Effects of anthocyanins on CYP1A protein expression in primary human hepatocytes.
Cells were incubated for 48 h with 21 anthocyanins (10 µM and 50 µM; i.e. PEO-1, PEO-2, PEL-1, PEL-2, DEL-1, DEL-2, DEL-3, DEL-4, DEL-5, MAL-1, MAL-2, MAL-3, CYA-1, CYA-2, CYA-3, CYA-4, CYA-5, CYA-6, CYA-7, CYA-8, CYA-9), TCDD (5 nM) and vehicle (DMSO; 0.1% v/v). Western blots show analyses of CYP1A proteins from two different primary human hepatocytes cultures (LH45 and LH46). As a loading control, the blots were probed to actin (data not shown).
Table 1.
Effects of anthocyanins on the expression of CYP1A1 mRNA in primary human hepatocytes treated for 24 h with tested compounds. Results are expressed as a fold induction over the vehicle-treated cells. Data are mean ± S.D. from triplicate measurements. nd = not determined
| abbr. | COMPOUND | conc. | LH45 | LH46 | LH47 | LH48 |
|---|---|---|---|---|---|---|
| DMSO | 0.1% | 1.00 ± 0.38 | 1.00 ± 0.25 | 1.00 ± 0.10 | 1.00 ± 0.11 | |
| TCDD | 5nM | 125.4 ± 17.7 | 343. ± 45.6 | 104.7 ± 13.4 | 70.5 ± 1.8 | |
| PEO-1 | PEONIDIN-3-O-GLUOSIDE | 10 µM | 0.21 ± 0.03 | 2.14 ± 0.18 | n.d. | n.d. |
| 50 µM | 0.80 ± 0.22 | 2.48 ± 0.57 | 0.51 ± 0.07 | 0.08 ± 0.03 | ||
| PEO-2 | PEONIDIN-3-O-RUTINOSIDE | 10 µM | 0.20 ± 0.03 | 1.04 ± 0.02 | n.d. | n.d. |
| 50 µM | 0.67 ± 0.07 | 1.15 ± 0.09 | 0.54 ± 0.03 | 0.08 ± 0.00 | ||
| PEL-1 | PELARGONIDIN-3,5-di-O-GLUCOSIDE | 10 µM | 0.70 ± 0.17 | 1.49 ± 0.10 | n.d. | n.d. |
| 50 µM | 1.17 ± 0.14 | 2.21 ± 0.66 | 0.59 ± 0.52 | 0.98 ± 0.27 | ||
| PEL-2 | PELARGONIDIN-3-O-RUTINOSIDE | 10 µM | 0.87 ± 0.04 | 2.66 ± 0.20 | n.d. | n.d. |
| 50 µM | 0.24 ± 0.01 | 2.39 ± 0.22 | 0.61 ± 0.01 | 0.60 ± 0.17 | ||
| DEL-1 | DELPHINIDIN-3-O-GLUCOSIDE | 10 µM | 1.80 ± 0.11 | 1.99 ± 0.12 | n.d. | n.d. |
| 50 µM | 1.50 ± 0.21 | 0.80 ± 0.07 | 1.01 ± 0.12 | 0.01 ± 0.00 | ||
| DEL-2 | DELPHINIDIN-3-O-RUTINOSIDE | 10 µM | 1.53 ± 0.36 | 1.34 ± 0.10 | n.d. | n.d. |
| 50 µM | 0.53 ± 0.11 | 0.68 ± 0.01 | 0.23 ± 0.05 | 0.02 ± 0.01 | ||
| DEL-3 | DELPHINIDIN-3,5-di-O-GLUCOSIDE | 10 µM | 0.82 ± 0.02 | 0.85 ± 0.06 | n.d. | n.d. |
| 50 µM | 1.70 ± 3.26 | 1.14 ± 0.21 | 0.39 ± 0.06 | 0.02 ± 0.01 | ||
| DEL-4 | DELPHINIDIN-3-O-SAMBUBIOSIDE | 10 µM | 0.26 ± 0.21 | 1.11 ± 0.20 | n.d. | n.d. |
| 50 µM | 0.34 ± 0.09 | 1.31 ± 0.05 | 0.21 ± 0.26 | 0.07 ± 0.01 | ||
| DEL-5 | DELPHINIDIN-3-O-RHAMNOSIDE | 10 µM | 0.48 ± 0.01 | 0.98 ± 0.15 | n.d. | n.d. |
| 50 µM | 0.40 ± 0.09 | 1.19 ± 0.18 | 0.26 ± 0.01 | 0.01 ± 0.01 | ||
| MAL-1 | MALVINIDIN-3-O-GLUCOSIDE | 10 µM | 1.13 ± 0.35 | 2.34 ± 0.25 | n.d. | n.d. |
| 50 µM | 0.93 ± 0.11 | 1.56 ± 0.23 | 0.14 ± 0.13 | 0.29 ± 0.03 | ||
| MAL-2 | MALVINIDIN-3,5-di-O-GLUCOSIDE | 10 µM | 1.14 ± 0.28 | 1.72 ± 0.39 | n.d. | n.d. |
| 50 µM | 0.44 ± 0.01 | 1.64 ± 0.38 | 0.56 ± 0.07 | 0.93 ± 0.09 | ||
| MAL-3 | MALVINIDIN-3-O-GLUCOSIDE | 10 µM | 0.12 ± 0.00 | 0.87 ± 0.02 | n.d. | n.d. |
| 50 µM | 0.28 ± 0.04 | 1.32 ± 0.05 | 0.54 ± 0.02 | 0.33 ± 0.02 | ||
| CYA-1 | CYANIDIN-3-O-GLUCOSIDE | 10 µM | 1.22 ± 0.04 | 1.14 ± 0.20 | n.d. | n.d. |
| 50 µM | 0.73 ± 0.22 | 1.04 ± 0.12 | 0.28 ± 0.01 | 0.03 ± 0.00 | ||
| CYA-2 | CYANIDIN-3-O-RUTINOSIDE | 10 µM | 2.34 ± 0.28 | 0.55 ± 0.03 | n.d. | n.d. |
| 50 µM | 0.69 ± 0.25 | 0.91 ± 0.04 | 0.57 ± 0.09 | 0.07 ± 0.02 | ||
| CYA-3 | CYANIDIN-3,5-di-O-GLUCOSIDE | 10 µM | 0.68 ± 0.20 | 2.21 ± 0.16 | n.d. | n.d. |
| 50 µM | 0.48 ± 0.07 | 2.59 ± 0.09 | 0.45 ± 0.03 | 0.13 ± 0.03 | ||
| CYA-4 | CYANIDIN-3-O-SOPHOROSIDE | 10 µM | 1.31 ± 0.25 | 2.97 ± 0.39 | n.d. | n.d. |
| 50 µM | 0.46 ± 0.03 | 0.28 ± 0.05 | 0.51 ± 0.16 | 0.05 ± 0.02 | ||
| CYA-5 | CYANIDIN-3-O-ARARINOSIDE | 10 µM | 0.69 ± 0.06 | 0.67 ± 0.07 | n.d. | n.d. |
| 50 µM | 1.16 ± 0.17 | 0.61 ± 0.08 | 0.34 ± 0.11 | 0.07 ± 0.01 | ||
| CYA-6 | CYANIDIN-3-O-RHAMNOSIDE | 10 µM | 0.77 ± 0.12 | 1.19 ± 0.14 | n.d. | n.d. |
| 50 µM | 0.73 ± 0.04 | 1.36 ± 0.03 | 0.31 ±0.03 | 0.07 ± 0.00 | ||
| CYA-7 | CYANIDIN-3-O-GALACTOSIDE | 10 µM | 0.65 ± 0.11 | 2.62 ± 0.41 | n.d. | n.d. |
| 50 µM | 0.34 ± 0.06 | 1.85 ± 0.09 | 0.25 ± 0.02 | 0.05 ± 0.02 | ||
| CYA-8 | CYANIDIN-3-O-SAMBUBIOSIDE | 10 µM | 0.26 ± 0.01 | 1.48 ± 1.14 | n.d. | n.d. |
| 50 µM | 0.20 ± 0.04 | 1.72 ± 0.72 | 2.44 ± n.d. | 0.02 ± 0.00 | ||
| CYA-9 | CYANIDIN-3-O-LATHYROSIDE | 10 µM | 0.32 ± 0.12 | 0.91 ± 0.11 | n.d. | n.d. |
| 50 µM | 0.61 ± 0.05 | 1.77 ± 0.49 | 0.11 ± 0.17 | 0.09 ± 0.05 | ||
| SUP-1 | OSTROVID | n.d. | n.d. | 0.57 ± 0.72 | n.d. | |
| SUP-2 | ANTISTAX | n.d. | n.d. | 0.91 ± 1.16 | n.d. | |
| SUP-3 | URINAL | n.d. | n.d. | 0.77 ± 1.00 | n.d. |
3.4. Ligand binding assay
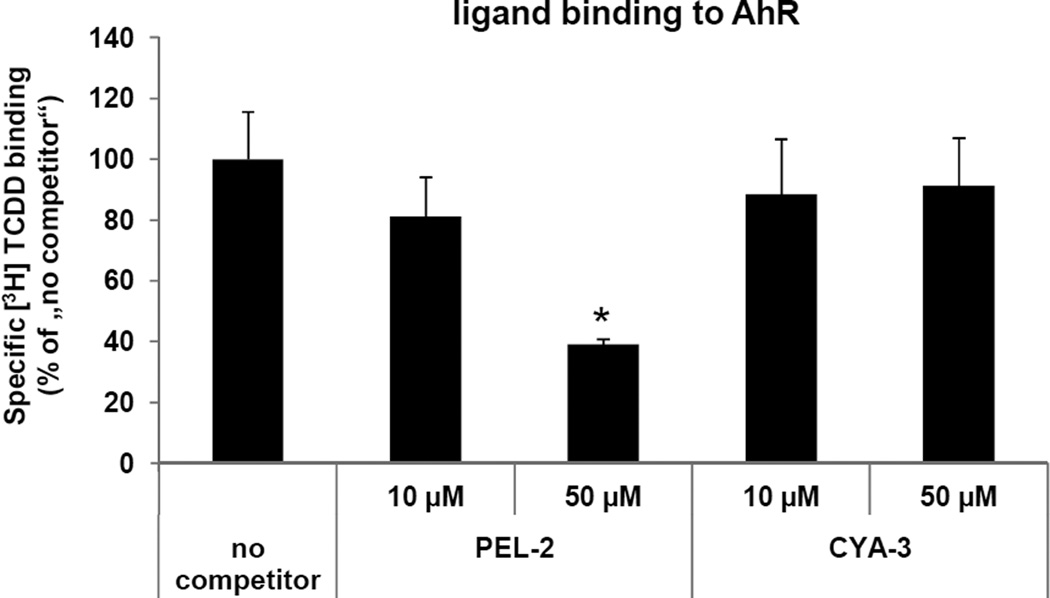
Since the activation of AhR may occur by ligand-dependent or ligand-independent mechanisms, we tested whether the effects of PEL-2 and CYA-3 on AhR-CYP1A1 signaling pathway involved binding of PEL-2 and CYA-3 to the AhR. We performed AhR ligand binding assays using guinea pig hepatic cytosol. PEL-2 competitively inhibited [3H]-TCDD binding to the AhR when present in the binding incubation at 50 µM (61–71% inhibition), (Figure 5). These data are consistent with the previous results which suggest that PEL-2 is a weak ligand/agonist of the AhR, and that the effects of PEL-2 on AhR-CYP1A1 signaling pathway likely occur via a ligand-dependent mechanism. On the other hand, CYA-3 did not displace radiolabelled TCDD from AhR in any tested concentration (Figure 5). Therefore, effects of CYA-3 on AhR-CYP1A1 signaling pathway are probably ligand-independent.
Figure 5. Ligand binding assay.
Guinea pig hepatic cytosol was incubated with indicated concentrations of PEL-2 (pelargonidin-3-O-rutinoside chloride), CYA-3 (cyanidin-3,5-di-O-glucoside chloride) or 200 nM TCDF for 1 h at room temperature in the presence of 2 nM [3H]TCDD. Ligand binding to the cytosolic proteins was determined by the hydroxyapatite binding protocol and scintillation counting. Specific binding was determined as a difference between total and non-specific (TCDF) reactions. The values are presented as mean ± SD of three independent reactions. * - values significantly different from the ‘no competitor’ reaction at P<0.05 as determined by the Student’s t-test. The results are representative of two independent experiments.
3.5. Effects of anthocyanins on CYP1A1 catalytic activity in human liver microsomes
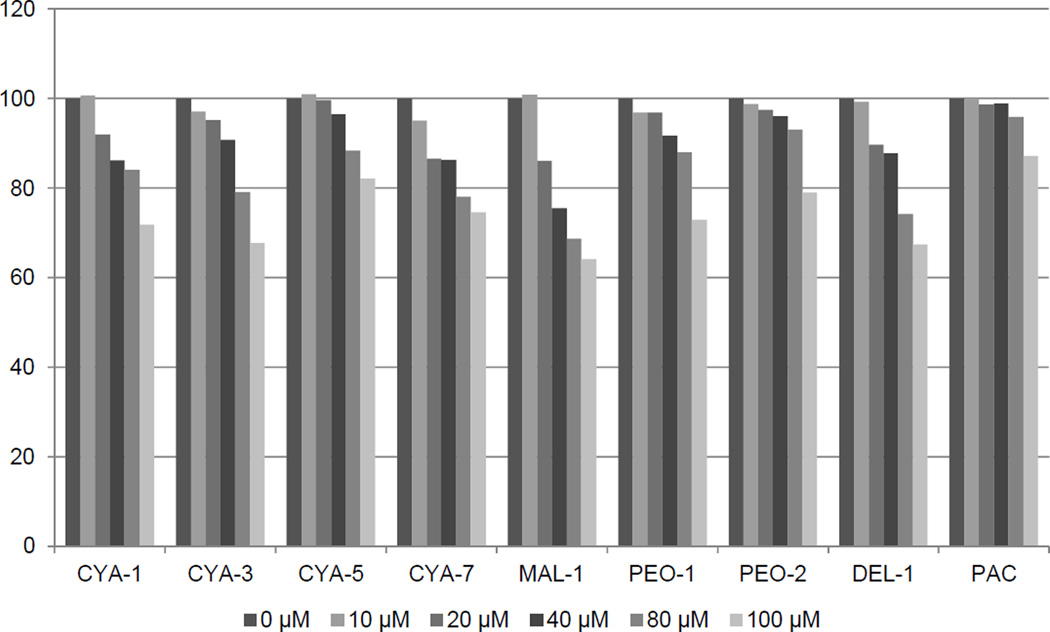
Given the ability of many AhR ligands to also bind to and be metabolized by the CYP1A enzymes, we directly examined the effects of anthocyanins on the activitity of the CYP1A1 by following a specific luciferin activating activity using human microsomes. Tested compounds were selected based on the composition of food supplements tested in the current study. Results of competitive kinetic analyses revealed a weak concentration-dependent inhibition of CYP1A1 after the addition of anthocyanins CYA-1, CYA-5, CYA-7, MAL-1, PEO-1, PEO-2, DEL-1,CYA-3, PAC, albeit to a relatively low extent (to 80% - 65% of the initial activity, i.e. without anthocyanidin added) at the highest concentration of the respective anthocyanin (i.e. 100 µM). The data (Figure 6) clearly document the course of the inhibition of CYP1A1 activity by various anthocyanins with maximum extent down to 62% with 100 µM of malvidine 3-glucoside (MAL-1). These results thus document the relatively weak ability of anthocyanins to interact with drug metabolizing system of CYP1A1.
Figure 6. Effects of anthocyanins on CYP1A1 catalytic activity in human liver microsomes.
Inhibition of human microsomal CYP1A1 catalytic activity by eight anthocyanins and proanthocyanidin A2 (PAC) expressed as the amount of activity remaining relative to control (without anthocyanin) in percent. Concentration of respective anthocyanins in the reaction mixture was 0, 10, 20, 40, 80 and 100 µM. For experimental details, see the Methods section.
4. DISCUSSION
A phenomenon of food-drug (or drug-food) interactions may principally occur in two ways: (i) inhibition of drug-metabolizing enzymes, or by competition for this enzyme; (ii) induction of drug-metabolizing enzymes via activation of nuclear receptors (e.g. vitamin D receptor – VDR, farnesoid X receptor - FXR), receptors for steroid hormones (e.g. glucocorticoid receptor – GR, estrogen receptor – ER) or xenoreceptors (e.g. aryl hydrocarbon receptor – AhR, pregnane X receptor – PXR). Activation of nuclear, steroid and xeno-receptors by xenobiotics, such as drugs or food constituents may have plenty of physiological and pathophysiological consequences, other than induction of drug-metabolizing enzymes. For instance, AhR is a key transcriptional regulator of phase I. enzymes (CYP1A1, CYP1A2, CYP1B1) and phase II. enzymes (GSTA1, UGT1A2). On the other hand, AhR plays various physiological roles (e.g. in immune response, in cellular proliferation and differentiation) and pathophysiological roles (e.g. in chemically induced carcinogenesis). The behavior of AhR resembles Dr. Jekyll and Mr. Hyde from R.L. Stevenson´s novel, when activation of AhR by environmental pollutants leads to toxic responses to human organism, while activation by endogenous ligands is necessary for human health. Given the complex role of AhR in toxicological response and in human physiology and pathophysiology, this is of topical interest to examine the effects of xenobiotics, including food constituents, on the activity of AhR.
In the present study, we examined the effects of 21 major anthocyanins and 3 extracts from food supplements containing anthocyanins, on AhR-CYP1A1 signaling pathway in primary human hepatocytes and in human hepatic HepG2 and intestinal LS174T cancer cells. Anthocyanins are plant pigments occurring in grape wines and berry fruits such as blueberries, cranberries, raspberries etc. In addition, anthocyanins are the active constituents of food supplements based on the extracts from berry fruits. The amounts of anthocyanins and other phenolics in food supplements are sometimes so high that their consumption results in intestinal or plasma concentrations in order of magnitude higher as compared to that attained by consumption of fresh fruits. Indeed, a food supplement SUP-2 (Urinal Akut®, Tablets à 36 mg of proanthocyanidins Walmark a.s., Czech Republic), used in the current study, contains in one tablet the amount of extract equivalent to 338 400 mg of fresh cranberries, as declared by manufacturer. The data presented in the current paper show that only two anthocyanins of 21 tested displayed an activity towards AhR-CYP1A1 signaling pathway. It was the case of pelargonidin-3-O-rutinoside (PEL-2) and cyanidin-3,5-O-diglucoside (CYA-3), which dose-dependently activated AhR, as revealed by gene reporter assay. In addition, these two compounds induced CYP1A1 mRNA but not protein in HepG2 and LS174T cells. The effects of PEL-2 and CYA-3 on AhR occurred by ligand-dependent and ligand-independent mechanisms, respectively, as demonstrated by ligand binding assay. The effects of PEL-2 are analogical to those observed for pelargonidin, an aglycone for PEL-2, as we described recently (Kamenickova et al. 2013). Neither compound nor extract from food supplements induced CYP1A1 mRNA and protein in four different primary human hepatocytes cultures. This is an important finding with regard to the fact that examination in primary human hepatocytes comprises both maternal compounds and metabolites (Vanzo et al. 2011). In line with these results, also the CYP1A1 enzyme activity was not prominently influenced by anthocyanins tested. Inhibition of CYP1A1 was concentration-dependent, however, it did not reach 50% even at the highest anthocyanin concentration i.e. 100 µM. On the contrary, the aglycon parts of the anthocyanins tested i.e. the anthocyanidins exhibited in at least two cases, of pelargonidin (PEL) and delphinidin (DEL), an inhibition of CYP1A1 with IC50 values of 33 and 77 µM, respectively, documenting the ability of aglycons (anthocyanidins) to interact with drug metabolism by CYP1A enzyme (Kamenickova et al. 2013). Conjugation with sugar part, however, lowered the inhibition of enzyme activity as shown in this paper and led to less prominent activation of the AhR.
Collectively, tested anthocyanins and the extracts from food supplements that contain anthocyanins possess very low, if any, potential for food-drug interactions with respect to AhR-CYP1A1 pathway. This result is – taken from the consumer´s point of view – important for the safety of their use.
ACKNOWLEDGEMENTS
Our laboratories are supported by a grant GACR 303/12/G163 from the Czech Scientific Agency, by a student grant from Palacky University Olomouc PrF-2013-002 and by a grant from the National Institute of Environmental Health Sciences (ES04699).
ABBREVIATIONS
- AhR
Aryl Hydrocarbon Receptor
- TCDD
2,3,7,8- tetrachlorodibenzo-p-dioxin
Footnotes
CONFLICT OF INTEREST
The authors declare that they have no conflict of interest.
REFERENCES
- Abel J, Haarmann-Stemmann T. An introduction to the molecular basics of aryl hydrocarbon receptor biology. Biological chemistry. 2010;391(11):1235–1248. doi: 10.1515/BC.2010.128. [DOI] [PubMed] [Google Scholar]
- Denison MS, Rogers JM, Rushing SR, Jones CL, Tetangco SC, Health-Pagliuso S. Analysis of the AhR Receptor Signal Transduction Pathway. In: Maines M, Costa LG, Reed DJ, Sassa S, Sipes IG, editors. Current Protocols in Toxicology. New York: John Wiley and Sons; 2002. pp. 4.8.1–4.8.45. [DOI] [PubMed] [Google Scholar]
- Durst RW, WRE . Separation and characterization of anthocyanins by HPLC. In: Wrolstad REATE, Decker EA, Penner MH, Reid DS, Schwartz SJ, Shoemaker CF, Smith DM, Sporns P, editors. Current Protocols in Food Analytical Chemistry. vol Unit F1.3. New York: Wiley; 2001. pp. F1.3.1–F1.3.13. [Google Scholar]
- Dvorak Z, Vrzal R, Henklova P, et al. JNK inhibitor SP600125 is a partial agonist of human aryl hydrocarbon receptor and induces CYP1A1 and CYP1A2 genes in primary human hepatocytes. Biochem Pharmacol. 2008;75(2):580–588. doi: 10.1016/j.bcp.2007.09.013. [DOI] [PubMed] [Google Scholar]
- Haarmann-Stemmann T, Abel J, Fritsche E, Krutmann J. The AhR-Nrf2 pathway in keratinocytes: on the road to chemoprevention? The Journal of investigative dermatology. 2012;132(1):7–9. doi: 10.1038/jid.2011.359. [DOI] [PubMed] [Google Scholar]
- Haarmann-Stemmann T, Boege F, Krutmann J. Adaptive and Maladaptive Responses in Skin: Mild Heat Exposure Protects against UVB-induced Photoaging in Mice. The Journal of investigative dermatology. 2013;133(4):868–871. doi: 10.1038/jid.2012.435. [DOI] [PubMed] [Google Scholar]
- Hodek P, Trefil P, Stiborova M. Flavonoids-potent and versatile biologically active compounds interacting with cytochromes P450. Chemico-biological interactions. 2002;139(1):1–21. doi: 10.1016/s0009-2797(01)00285-x. [DOI] [PubMed] [Google Scholar]
- Kamenickova A, Anzenbacherova E, Pavek P, et al. Pelargonidin activates the AhR and induces CYP1A1 in primary human hepatocytes and human cancer cell lines HepG2 and LS174T. Toxicology letters. 2013;218(3):253–259. doi: 10.1016/j.toxlet.2013.01.020. [DOI] [PMC free article] [PubMed] [Google Scholar]
- Korashy HM, Anwar-Mohamed A, Soshilov AA, Denison MS, El-Kadi AO. The p38 MAPK inhibitor SB203580 induces cytochrome P450 1A1 gene expression in murine and human hepatoma cell lines through ligand-dependent aryl hydrocarbon receptor activation. Chemical research in toxicology. 2011;24(9):1540–1548. doi: 10.1021/tx200141p. [DOI] [PMC free article] [PubMed] [Google Scholar]
- Novotna A, Pavek P, Dvorak Z. Novel stably transfected gene reporter human hepatoma cell line for assessment of aryl hydrocarbon receptor transcriptional activity: construction and characterization. Environmental science & technology. 2011;45(23):10133–10139. doi: 10.1021/es2029334. [DOI] [PubMed] [Google Scholar]
- Pavek P, Cerveny L, Svecova L, et al. Examination of Glucocorticoid receptor alpha-mediated transcriptional regulation of P-glycoprotein, CYP3A4, and CYP2C9 genes in placental trophoblast cell lines. Placenta. 2007;28(10):1004–1111. doi: 10.1016/j.placenta.2007.05.001. [DOI] [PubMed] [Google Scholar]
- Prior RL, Wu X. Anthocyanins: structural characteristics that result in unique metabolic patterns and biological activities. Free radical research. 2006;40(10):1014–1028. doi: 10.1080/10715760600758522. [DOI] [PubMed] [Google Scholar]
- Vanzo A, Vrhovsek U, Tramer F, Mattivi F, Passamonti S. Exceptionally fast uptake and metabolism of cyanidin 3-glucoside by rat kidneys and liver. Journal of natural products. 2011;74(5):1049–1054. doi: 10.1021/np100948a. [DOI] [PubMed] [Google Scholar]
- Welch CR, Wu Q, Simon JE. Recent Advances in Anthocyanin Analysis and Characterization. Current analytical chemistry. 2008;4(2):75–101. doi: 10.2174/157341108784587795. [DOI] [PMC free article] [PubMed] [Google Scholar]
- Winkel-Shirley B. Flavonoid biosynthesis. A colorful model for genetics, biochemistry, cell biology, and biotechnology. Plant physiology. 2001;126(2):485–493. doi: 10.1104/pp.126.2.485. [DOI] [PMC free article] [PubMed] [Google Scholar]


