Abstract
Numerous methodologies, assays, and databases presently provide candidate targets of transcription factors (TFs). However, TFs rarely regulate their targets universally. The context of activation of a TF can change the transcriptional response of targets. Direct multiple regulation typical to mammalian genes complicates direct inference of TF targets from gene expression data. We present a novel statistic that infers context-specific TF regulation based upon the CoGAPS algorithm, which infers overlapping gene expression patterns resulting from coregulation. Numerical experiments with simulated data showed that this statistic correctly inferred targets that are common to multiple TFs, except in cases where the signal from a TF is negligible relative to noise level and signal from other TFs. The statistic is robust to moderate levels of error in the simulated gene sets, identifying fewer false positives than false negatives. Significantly, the regulatory statistic refines the number of TF targets relevant to cell signaling in gastrointestinal stromal tumors (GIST) to genes consistent with the phosphorylation patterns of TFs identified in previous studies. As formulated, the proposed regulatory statistic has wide applicability to inferring set membership in integrated datasets. This statistic could be naturally extended to account for prior probabilities of set membership or to add candidate gene targets.
Keywords: Bioinformatics, Genetic expression, Genomics
I. INTRODUCTION
Transcriptional regulators play a key role in developmental processes and normal cellular homeostasis by controlling reprogramming of cells. Reprogramming of normal cells is typically driven by internal and external signals (e.g., metabolic changes, growth factors) with activation of transcription factors (TFs) leading to both repression and activation of transcription of target genes. If such transcriptional changes are driven at inappropriate times by aberrant activity, the system can switch to a diseased state. Therefore, identifying TF activity can implicate underlying biochemical processes in a disease system, such as cell signaling in tumorigenesis [1]. However, it is clear that TFs regulate different genes in different contexts, and the effect of TF activation therefore is cell-type and cell-context dependent. Determining TF targets activated in specific instances can help to refine understanding of disease by identifying the specific genes aberrantly activated in cells showing the disease phenotype. As a result, these targets may provide insight into treatment options or genomic biomarkers unidentifiable in single gene analyses or standard gene set analyses.
Inference of TF gene targets is an active area of research that involves numerous quantitative and experimental techniques. Chromatin Immuno-Precipitation on microarrays (ChIP-chip) and or with sequencing (ChIP-seq) assays have been used widely to detect TF targets (reviewed in [2]). The ENCODE project has performed extensive quantification of numerous TF targets [3]. Although performed across numerous cell types, such studies are unable to characterize the transcriptional landscape from cells undergoing dynamic regulation by disease or developmental processes. Alternatively, the in silico techniques that predict candidate targets from binding sites in DNA sequence often detect all candidate targets regardless of actual gene transcription driven by TFs in the specific biological background [4]. These limitations in measurement and prediction techniques make context-specific target identification difficult even in curated databases of TF targets.
Ideally, prior knowledge of TF candidate targets can be refined by integrating global gene expression measurements to infer context-specific TF targets from evidence of transcript generation. For example, integrating ChIP candidate targets in an analysis of expression response to Pou5f1, Sox2, and Nanog suppression refined context-specific knowledge of targets of these TFs [5]. However, such direct inference methods are intractable for most in vivo studies, in which TF activity can be neither directly manipulated nor measured. Recently, numerous techniques to refine genes in gene sets or identify patient specific pathways by integrating expression and other data have been developed [6], [7], extending previous algorithms [8]. These methods are generally based upon inference of common expression responses in candidate genes inferred with clustering, principal component analysis (PCA), or network-based analyses. However, previous studies have found that the techniques underlying these algorithms have difficulty accounting for the regulation of individual genes by multiple TFs or secondary transcriptional effects due to feedback [9].
Sparse Markov chain Monte Carlo (MCMC) matrix factorization algorithms, such as CoGAPS [10], have been shown to infer patterns across samples that relate to TF activity and account for multiple regulation of individual genes [1]. While previous extensions leveraged prior knowledge of targets to more accurately estimate TF activity [11], no technique has been able to refine gene targets based on context. This paper extends our approach to include a gene-regulatory statistic that predicts context-specific TF targets. Analysis of simulations and time course data from gastrointestinal stromal tumor (GIST) cell lines demonstrate that the algorithm successfully integrates gene expression data and prior knowledge to accurately determine context-specific targets.
II. ALGORITHM TO IDENTIFY CONTEXT-SPECIFIC TRANSCRIPTION FACTOR TARGETS
We sought a regulatory statistic that computes the probability that a gene g is a member of gene set 𝒢 based upon prior knowledge of gene set membership, Pr(g ∈ 𝒢 ), and gene expression data. We based the proposed regulatory statistic for membership of g in 𝒢 upon comparisons of the expression profile of g to the expression pattern CoGAPS infers for members of 𝒢. In the formulation below, we assumed that the priors on Pr(g ∈ 𝒢 ) were binary, but we note that the algorithm could be modified easily to include non-binary probabilities, such as arise in ChIP-seq. Due to the binary prior, we set the symbol 𝒢 to represent candidate set members, 𝒢 = {g|Pr (g ∈ 𝒢 ) = 1}, in addition to representing the gene set itself.
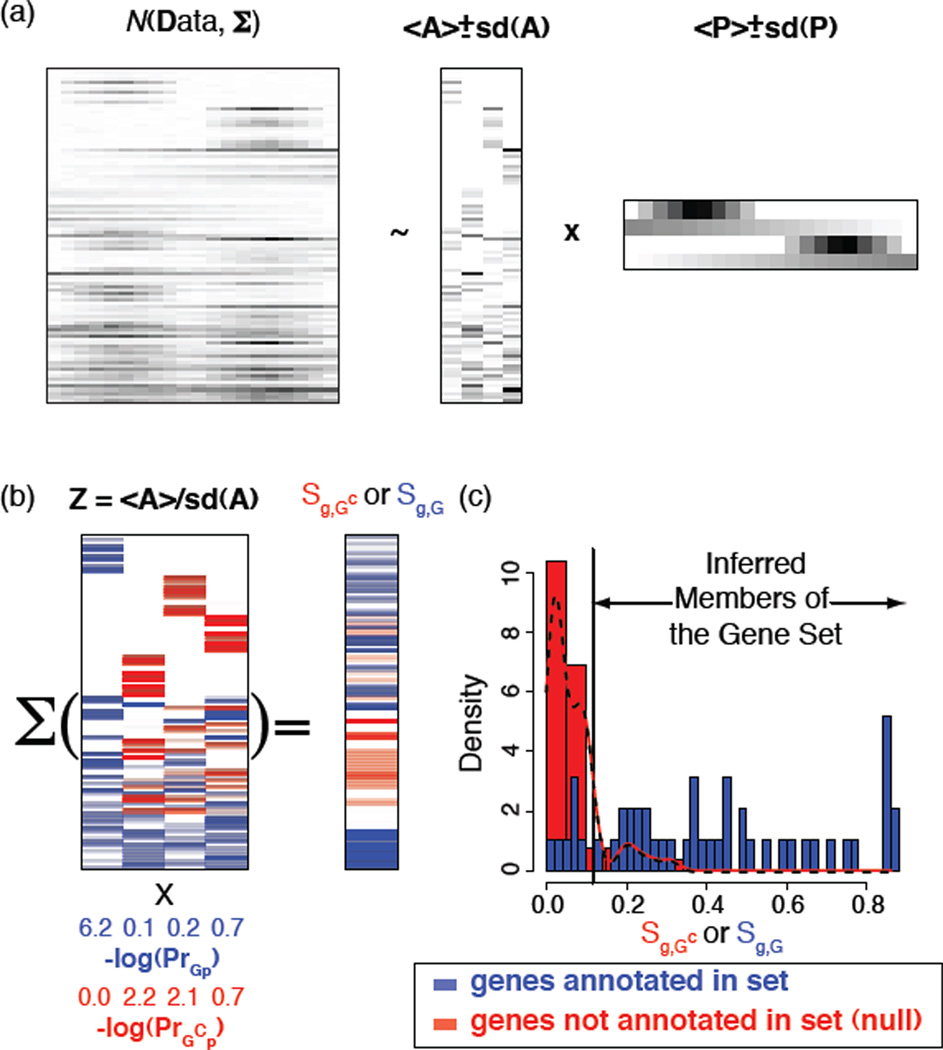
The CoGAPS algorithm was developed to infer expression patterns across samples that are shared by multiple genes. The algorithm thus modeled gene expression by factoring the n gene × m sample data matrix D into an n × p amplitude matrix A and a p × m pattern matrix P, so that
| (1) |
where 𝒩 (µ, σ) is a normal distribution with mean µ and standard deviation σ, and Σij is a standard deviation representing the uncertainty in Dij (Figure 1a). Using an atomic prior [12], CoGAPS inferred A and P by Markov chain Monte Carlo (MCMC). CoGAPS then calculated a Z-score statistic to infer the amplitude of the gene set 𝒢 in each of the patterns as
| (2) |
where G is the number of elements in 𝒢 and where 〈Agp〉 and sd (Agp) are respectively the posterior mean and standard deviation of Agp estimated by MCMC. The probability that members of 𝒢 are upregulated in each pattern (Pr𝒢p) is then inferred using a permutation test, comparing Z𝒢p to the comparable Z-score statistic resulting from applying eq. 2 to random sets drawn from the appropriate column of A containing G members (Figure 1b). This statistic has been shown to link validated TF activation across samples from the inferred underlying patterns in D [1], [13].
Figure 1.
Overview of the algorithm for the identification of context specific TF targets. (a) CoGAPS identifies global patterns (rows of P) from the gene expression data matrix (D). The expression of each gene is then modeled as a linear combination of these patterns, with coefficients stored in corresponding entries of the A matrix. (b) Gene set statistics are computed by permutation tests comparing the relative Z-score associating genes with patterns for genes annotated in gene set. These set statistics are computed for genes annotated as putative set members (blue), and for null genes not annotated to the set (red) and log transformed (bottom). Gene-specific statistics (Sg,𝒢) are computed by averaging Z-scores quantifying gene-association with a pattern weighted according to these set statistics using eq (3). (c) The p-values quantifying set membership are computed by comparing the computed value of gene-specific statistics for genes in the set (blue) to similar statistics computed for genes in the null distribution (i.e., genes not in the set, red).
We hypothesized that in a single context, an active TF simultaneously regulates all active targets. Therefore, a gene g would be assigned to 𝒢 in this context, if its expression profile was similar to other members of 𝒢. This hypothesis was quantified by comparing the activity of gene g to that of 𝒢 across all patterns, using
| (3) |
The measure Sg, 𝒢 will be large when g has amplitude in patterns that are upregulated in 𝒢, and zero otherwise. The probability of set membership was then computed by comparing the value of Sg, 𝒢 for each gene to the distribution of values of the statistic in eq. 3 for genes outside of the set (namely, 𝒢C = {g|Pr (g ∈ 𝒢 ) = 0}); i.e., Figure 1c. Using the logarithm in eq. 3 insured that our statistic had greater sensitivity to patterns with small p-values of upregulation than would result from scaling the Z-scores by 1 – Pr𝒢p. Because eq. 3 did not not include a penalty term for activity in sets outside of 𝒢, Sg, 𝒢 can have large values for multiple gene sets 𝒢 with correspondingly low p-values inferred from the permutation test. It is therefore likely that the statistic can further facilitate inference of multiple regulation of a gene g within a CoGAPS analysis.
III. METHODS
A. Implementation
All analyses reported in this manuscript were performed using the Bioconductor package for CoGAPS [10], and the set membership statistic of eq. 3 is implemented in the function computeGeneGSProb. The inferred, normalized pattern for each gene set was computed as
| (4) |
where Pp•, represents the pth row of the pattern matrix and P̃𝒢 is normalized to have a sum of 1 for plotting.
B. Simulated data
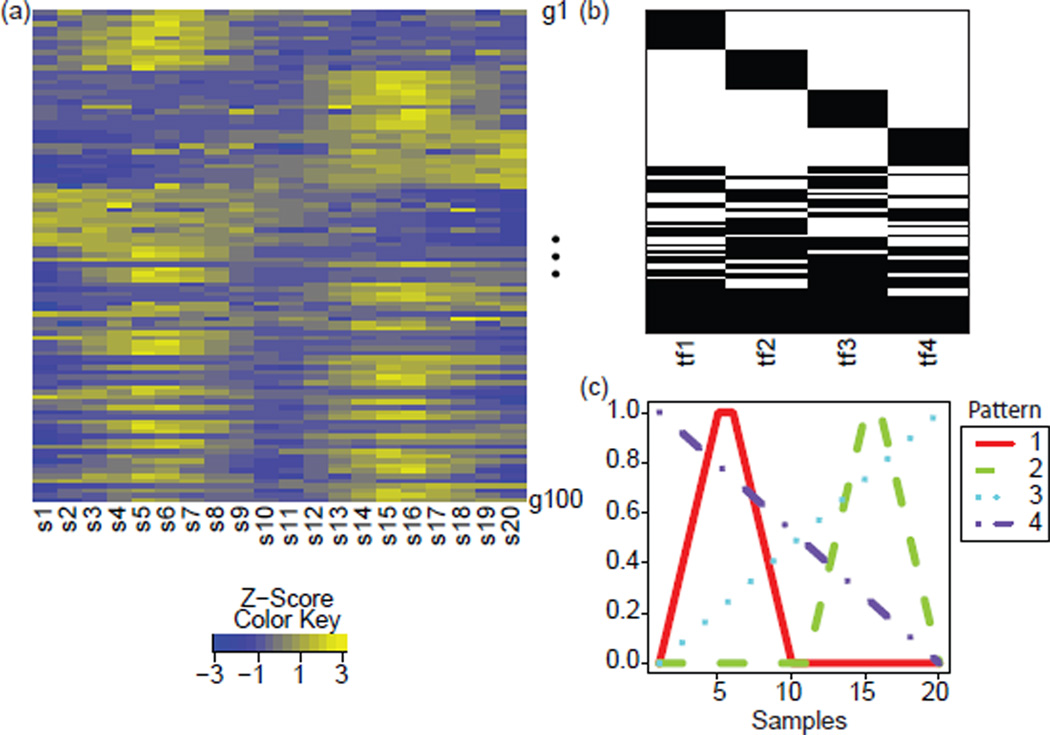
The simulated dataset depicted in Figure 2a (the D matrix) consisted of four TFs, with targets represented in Figure 2b (the true A matrix) and activity represented by patterns in Figure 2c (the true P matrix). Genes were preselected as being regulated by one to four of the TFs. The specific TFs that regulated each of these genes were then selected at random to avoid biasing the analysis toward any subset of the four TFs. The maximum magnitude by which a TF regulates each gene target when fully active (i.e., a value of 1 for the corresponding element in the P matrix) were drawn from an exponential distribution with parameter ⅓. Multiplicative noise of 10% was added to the simulated data, in accordance with the mean of noise typically seen across array measurements [14].
Figure 2.
Overview of simulated data. (a) Heatmap of the relative log2 expression of each gene, colored according to the color key. The data have been row-scaled to gene-specific Z-scores for visualization, however the analysis was done on the non-negative D matrix. (b) Gene targets of each simulated TF in black shading in rows. (c) Simulated patterns across samples. Patterns are numbered according to the TF to which they are assigned (e.g., 1 for tf1).
Additional datasets were simulated to investigate the ability of the method to deduce changes in transcriptional regulation due to different genetic contexts. For instance, it has been shown that TFs regulate different targets in different cell types, potentially due to epigenetic changes, and each cell type could be considered a different genetic context. In the first collection of datasets, the magnitude of gene regulation was modified, so that
| (5) |
where i indexes genes for each TF, k indexes patterns associated with each TF, p sets the relative magnitude of change in regulation of gene by a TF, and the absolute value is taken to avoid negatives. The value p ∈ {0.05, 0.10, 0.15, 0.20, 0.25} provides five different simulated levels of change in regulation in the alternative genetic context.
In the second collection of datasets, the targets for each TF were changed at random, with the number changed varied from 5% to 25% in steps of 5% generating five data sets. Specifically,
| (6) |
where Ni is the total number of targets of TF i, k′ indicates a random choice of a different gene to be regulated in the new context and p ∈ {0.05,0.10,0.15,0.20,0.25} provides for 5% to 25% of the genes to be chosen in the new context.
We refer to the original data set in each case as CO and the altered data set, with A modified by eq. 5 or 6 representing a different genetic context, as CA.
C. GIST data and transcription factor targets
The GIST expression data and TF targets from TRANSFAC [15] were preprocessed [1] and deposited as data files in the CoGAPS package [10]. Raw data is available in the Gene Expression Omnibus (GEO; accession GSE17018). The matrix factorization and gene set analyses are described in detail in the CoGAPS User’s Manual. Briefly, the data was normalized and replicates combined to give gene level estimates and associated uncertainties, Dij and Σij of eq. 1. The data set was reduced to include only genes with known TF regulators in TRANSFAC, and CoGAPS was applied. The resulting A and P matrices and associated standard deviations from MCMC sampling were used in the analyses of eqs. 2 and 3.
IV. SIMULATION RESULTS
In order to test the regulatory statistic resulting from the permutation test on the summary statistic of eq. 3, we simulated a dataset containing four TFs as described in Methods (Figure 2a). Each of these TFs (tf1 through tf4) had unique targets and targets shared with the remaining TFs (Figure 2b). The expression for the targets were set at a variety of levels when the TF was active (activity indicated in the rows P, Figure 2c). The analyses described in the following subsections assessed the accuracy of the gene-regulation statistic of eq. 3 when applied to the ground truth simulated TF target sets with varying degrees of error and different genetic contexts.
A. CoGAPS analysis recovers simulated TF activity
We first applied the GAPS matrix factorization algorithm of eq. 1 to the simulated dataset. Three simulations using the CoGAPS algorithm with four patterns successfully recovered the true A and P matrices. Moreover, each simulation had χ2 fit values (1843.7, 1844.0, and 1843.5 respectively) comparable to the true χ2 value (2010.0). The CoGAPS gene set statistic resulting from a permutation test on the Z-score statistic of eq. 2 likewise identified the patterns in which the simulated TFs were upregulated.
B. The regulatory statistic inferred set membership when the signal was above noise levels
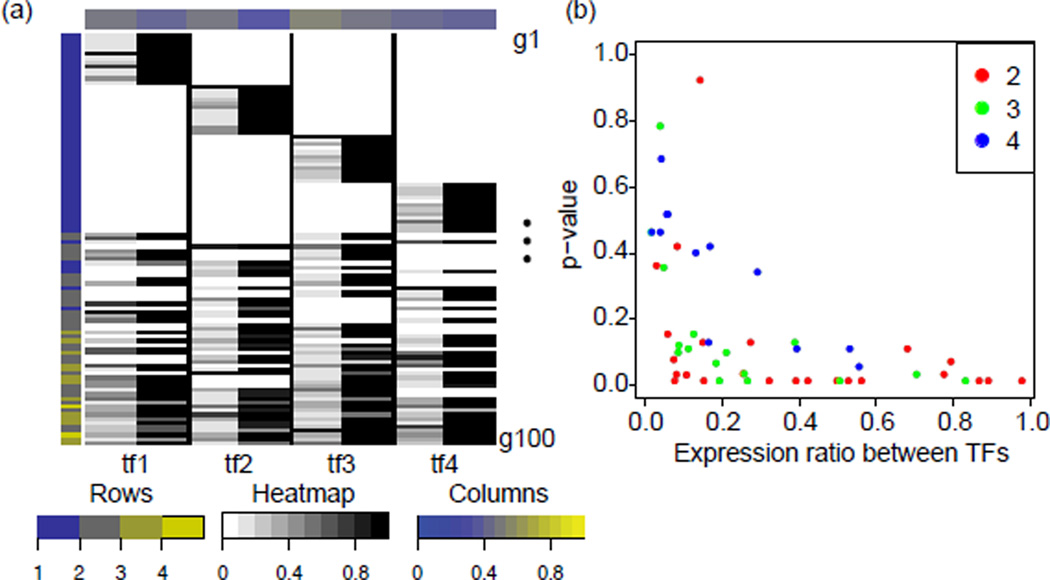
We initially validated the proposed regulatory statistic of eq. 3 in the ideal scenario for which the true members of the gene set were input as the elements of 𝒢. The regulatory statistic recovered most targets of each of the simulated TFs (Figure 3a). At a p-value threshold of 0.1, the statistic identified 85% of the targets for tf1, 73% for tf2, 89% for tf3, and 93% for tf4.
Figure 3.
Results of regulatory statistics for the simulated dataset. (a) Heatmap comparing the maximum amount of activity in a gene resulting from TF activity (left) to the estimated probability of set membership (right) for each TF. The true magnitude of gene regulation is rescaled to 0.1 at minimum and 1 at maximum for each TF. Similarly, estimated p-values are converted to probabilities of activity for plotting (1 − p). Color shading in rows and columns estimate the number of gene targets inferred at a p-value threshold of 0.1, relative to the total number of simulated genes in the case of column shading. (b) For each gene, for the TF with the smallest regulation of expression, the p-value inferred with the regulatory-statistic is plotted against the ratio between the amount that the selected TF regulates expression and the maximum expression across all TFs. Colors indicate the number of TFs that regulate each of the genes plotted, according to the color key
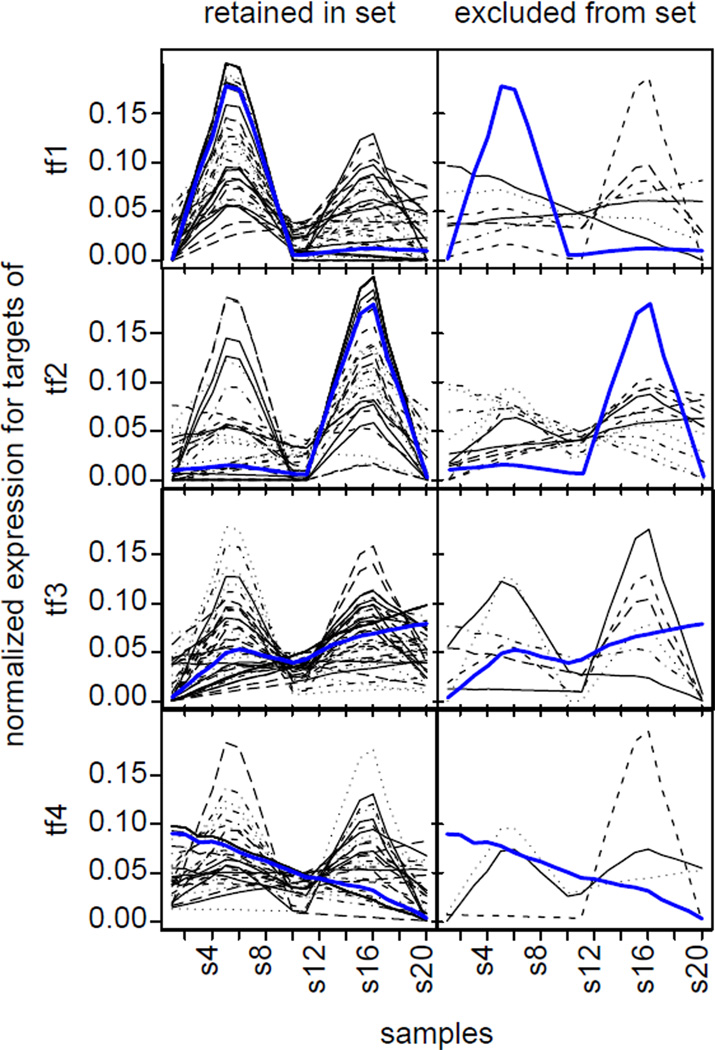
In most cases, the statistic also correctly assigned a gene to multiple TFs when that gene was multiply regulated. The statistic only missed multiply regulated genes for TFs that weakly regulated the gene, as shown in Figure 3b where weak regulation is toward the left. We hypothesized that in these cases, the algorithm could not distinguish the weak signals induced by activation of these TFs from noise in the simulated data. Further confirming this hypothesis, the genes excluded by the statistic from a TF target set had significantly different expression patterns than the pattern estimated by CoGAPS for that TF (Figure 4). Here, the pattern from the weakly regulated TF was lost due to weak signal relative to noise and to the regulation by the other TFs. In contrast genes assigned to the TF had expression patterns that at least partially matched the estimated TF pattern. In this case, the regulatory statistic inferred genes that were not purely correlated to one pattern, facilitating the successful inference of multiple regulation.
Figure 4.
Comparison of the inferred gene set activity to the retained and excluded genes for the simulated dataset. The normalized, de-noised expression profile inferred from the GAPS approximation of the gene expression data (AP) for each gene with a p-value less than 0.1 from the regulatory statistic (black lines) is compared to the inferred, normalized pattern for the gene set (blue line) in the figures on the left. Figures on the right plot similar profiles for genes with a p-value greater than 0.1. In each case the black lines represent genes that prior information declared to be regulated by the TF, which were confirmed by the algorithm (left) or which the algorithm determined not to be regulated by the TF (right). Results are plotted for each of the four TFs from top to bottom as labeled on the left.
C. The regulatory statistic is robust to moderate error in the prior for set membership
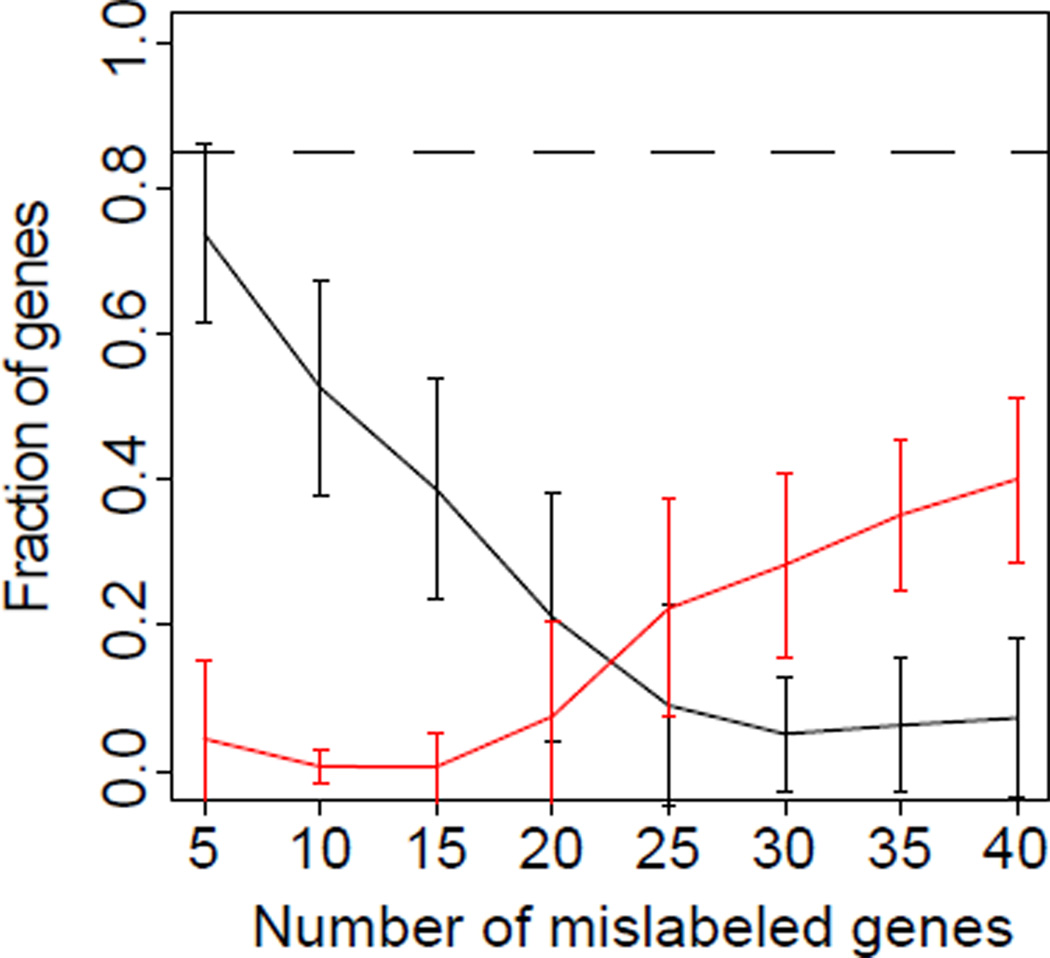
We also tested the regulatory statistic in the more realistic scenario in which the prior estimate of membership in 𝒢 was error-prone. In this case, we performed simulations in which a fixed number of genes from the true TF regulatory set were replaced with a random set of genes that were not regulated by that TF. Fifty simulations were performed for errors from 5 genes to 40 genes, representing a range of errors from 10% to 83% for tf1, 10% to 83% for tf2, 9% to 75% for tf3, and 12% to 93% for tf4. We compared the number of genes correctly inferred to the number of genes incorrectly inferred summarized across all of the TF sets (Figure 5). The statistic rapidly dropped genes from set membership (black line) as the misassignment in 𝒢 increased. However, the statistic only rarely incorrectly assigned genes to a set (red line) even for a significant error rate based on 15 genes (31% of the targets of tf1 and tf2, 28% of tf3, and 35% of tf4). Once the prior on the gene sets was dominated by incorrect genes, the statistic inferred a larger number of false gene set members than true gene set members. In contrast to the set of true genes, the number of false gene set members inferred never reached the majority of set members. Similar results were observed when analyzing the effects of gene set errors in individual TFs.
Figure 5.
Inference of set-membership with errors in each of the simulated TF sets. Mean fraction of true gene set members inferred with a p-value threshold of 0.1 for the regulatory statistic (black) and false gene set members (red) for fifty simulations with the number of genes misassigned to the gene set on the x-axis. Error bars for both curves represent the corresponding standard deviation estimated over each of the sets of fifty simulations. The dashed black line represents the percentage of true genes recovered in simulations containing no incorrect assignments in the gene set for reference.
D. Increased signal distinguished targets inferred in two simulated genetic contexts
We applied CoGAPS to the simulated datasets with altered expression (eq. 5). In each case, resulting factorizations had comparable χ2 fit values to those observed in the original context. We then computed the probability of TF regulation of each gene for each of the four TFs by applying eq. 3 independently to the factorization in the original genetic context CO and the factorization of each altered context CA. In each case, the null was made context independent by applying eq. 3 to each of the members of 𝒢C for the matrix [ACO, ACA], which was formed by concatenating the columns of the amplitude matrix in the corresponding factorizations.
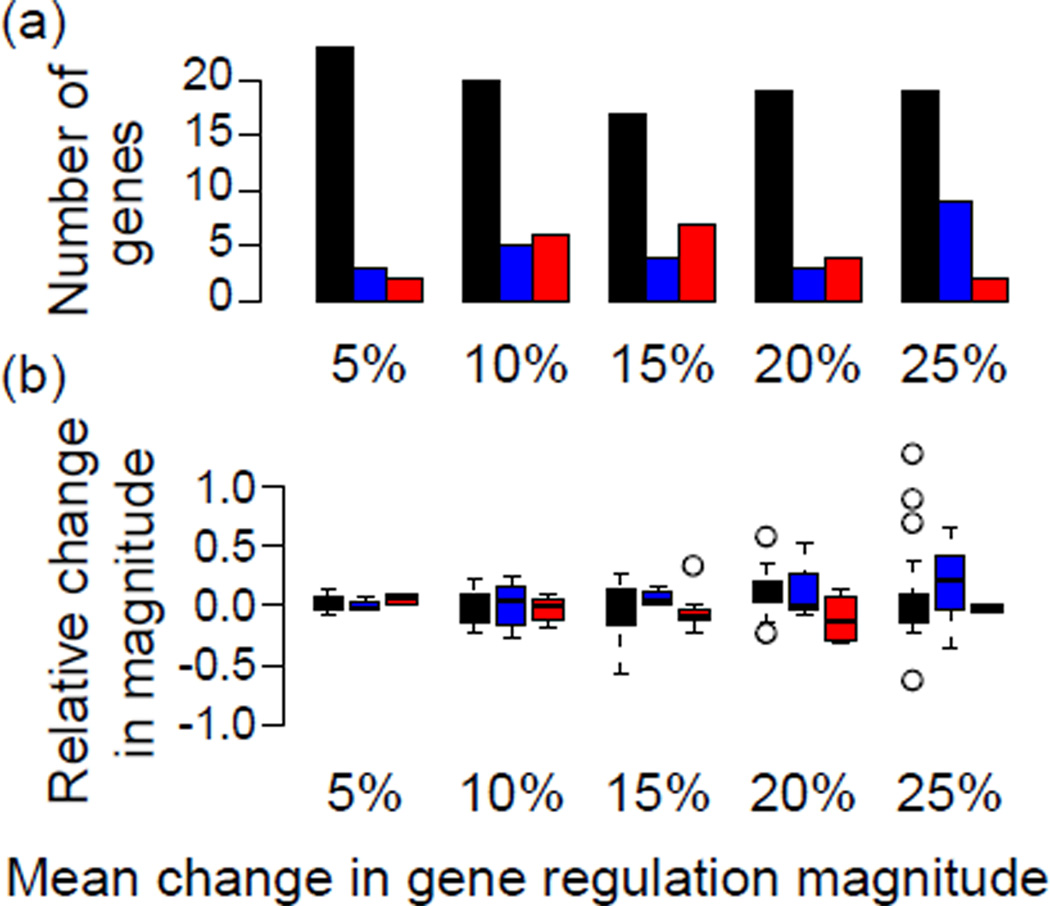
In each altered context, roughly 10% of the total 192 TF targets are filtered from the gene set, shown in Figure 6a. The total number of genes removed from both datasets decreases as the magnitude of transcription increases, supporting appropriate inference of gene regulation in at least one of the two contexts. In most cases, the inference of gene regulation in a single context was facilitated by increased signal in the inferred context, shown in Figure 6b. Genes inferred in a single context due to the corresponding change in magnitude often had p-values near the 0.1 significance threshold. Genes that did not have an increase in relative magnitude were often regulated near the noise level, and were thus more associated with one context or another due to the chance properties of the random noise added when simulating their expression. This suggests that care is needed in interpretation of context-specific regulation for genes with low overall expression.
Figure 6.
The detection of context-specific gene regulation. (a) The number of genes filtered from either genetic context is shown in black, assigned to the original context CO in blue, or assigned to the alternate context CA in red, with the magnitude of alteration (p in eq. 5) indicated on the x-axis. (b) The relative change in magnitude between the two contexts is shown, where positive values indicate larger magnitudes in the original context CO. Colors of the boxplots are as in (a).
E. The regulatory statistic infers set membership across datasets with distinct TF targets
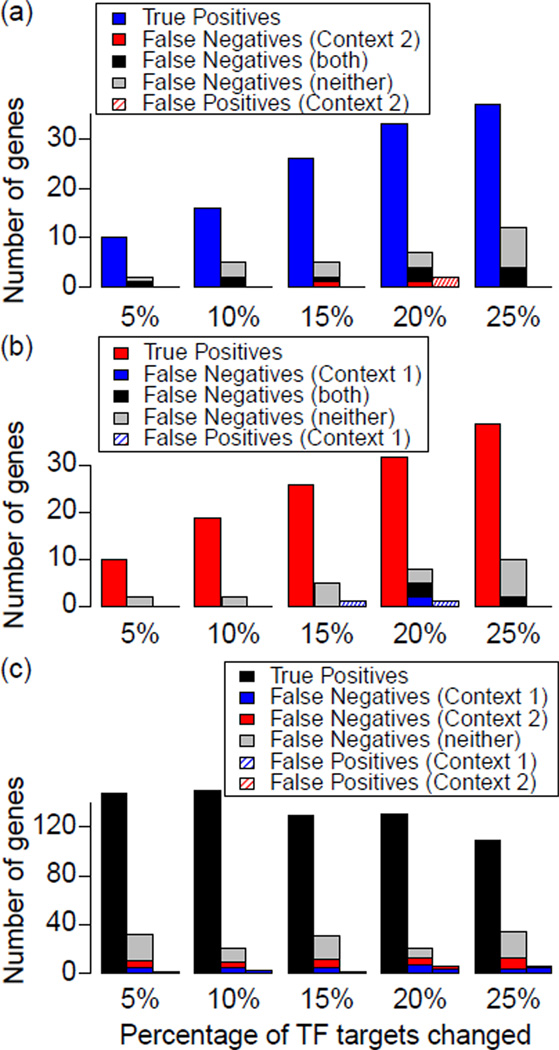
To test the ability of the approach to identify changes in context-specific TF targets, we applied CoGAPS and the statistic of eq. 3 to each of the datasets where CA was defined by eq. 6. Here, the set of putative TF targets was context independent, defined as the union of targets for each TF in the CO and CA contexts, which reflects the reporting in biological databases, where we generally have evidence of regulation but unknown contexts. The resulting inferred targets from eq. 3 had high sensitivity and specificity (Table I). Generally, the statistic was more specific than sensitive, reflecting the tendency of the statistic to filter TF targets with low overall expression relative to noise or extent of regulation by other TFs. More rarely, the statistic falsely inferred transcriptional regulation of genes in the wrong genetic context, summarized in Figure 7. Analysis of the expression profiles in these cases suggested that these false positives could be attributed to chance resemblance of the random noise added to the dataset to the profile of TF activation.
Table I.
Sensitivity and specificity of targets recalled from either CO,CA or both contexts. Here p represents the percentage of altered TF targets in CA (eq. 6).
| P | Sensitivity | Specificity | ||||
|---|---|---|---|---|---|---|
| (%) | CO | CA | both | CO | CA | both |
| 5 | 0.92 | 0.83 | 0.81 | 0.98 | 0.96 | 0.96 |
| 10 | 0.86 | 0.90 | 0.88 | 0.98 | 0.98 | 0.95 |
| 15 | 0.87 | 0.84 | 0.80 | 0.98 | 0.95 | 0.97 |
| 20 | 0.90 | 0.85 | 0.86 | 0.95 | 0.96 | 0.94 |
| 25 | 0.84 | 0.84 | 0.76 | 0.98 | 0.95 | 0.92 |
Figure 7.
The number of TF targets estimated as regulated by the TF in each context: (a) in only CO (blue), (b) in only CA (red), and (c) in both (black). False negatives represent the assignment of TF targets for genes misassigned to a different context, indicated by colors in the corresponding figure legend. False positives represent TF targets from a different context being falsely assigned to the indicated context.
The lowest sensitivity was observed for TF targets that belonged in both CO and CA. Although of comparable specificity to genes with TF targets in either CO or CA, roughly half of the missed targets in the joint group were not assigned to either context, and half were incorrectly called targets in only one of the contexts. Genes filtered from both contexts had a magnitude of regulation at the noise level or below the magnitude of regulation for other TFs regulating the same gene. On the other hand, genes assigned to a single context typically were either more strongly regulated in that context due to context-specific loss of signal from other regulatory TFs targeting that gene or had low expression relative to noise or signal from other TFs regulating that gene.
V. ANALYSIS OF GIST CELL LINE GENE EXPRESSION DATA
We applied the gene regulatory statistic from eq. 3 to the time course gene expression data of GIST cell lines treated with imatinib (IM) and TF targets from TRANSFAC for TFs downstream of the c-KIT activating mutation [1]. The CoGAPS algorithm recovered the response of TFs to therapy previously validated [1]. The matrix factorization identified patterns of gene expression that decreased in time with IM treatment, increased with IM treatment, and had a transient increase with IM treatment. The CoGAPS gene set statistic likewise inferred significant upregulation of Elk-1 in the rising pattern, upregulation of cJun, cMyc, and Elk-1 in the falling pattern, and significant upregulation of cJun and p53 in the transient pattern.
The gene regulatory statistic of eq. 3 decreased the number of targets of all TFs, regardless of the patterns to which TFs were assigned (Table II), and decreased the number of genes predicted to be multiply regulated (Table III). Due to the significant reduction, no genes were inferred to be regulated by more than two TFs. Based upon the simulated data results, we hypothesized that the reduction in genes inferred as multiply regulated arises from the general, significant decrease in context-specific targets rather than an inability of the statistic to account for multiple regulation.
Table II.
Relative number of transcription factor targets retained from the regulatory statistic with a p-value threshold of 0.1 for the GIST cell line data.
| TF | # genes | # significant genes |
|---|---|---|
| Ap1 | 99 | 10 |
| cJun | 71 | 0 |
| cMyc | 13 | 4 |
| CREB | 91 | 14 |
| E2F-1 | 24 | 4 |
| Elk-1 | 13 | 6 |
| FOXO | 9 | 4 |
| NF-kappaB | 51 | 6 |
| p53 | 27 | 10 |
| Smad4 | 19 | 2 |
| Sp1 | 398 | 42 |
| STAT3 | 22 | 5 |
Table III.
Summary of the statistics for candidate target genes that the TRANSFAC database notes as regulated by 1– 6 of the TFs considered in Table II (rows). Columns indicate the number of candidate targets from TRANSFAC number of genes not regulated with a p-value threshold of 0.1, and number of genes regulated by 1 or 2 of the TFs with a p-value threshold of 0.1.
| # TFs | # genes | 0 | 1 | 2 |
|---|---|---|---|---|
| 1 | 438 | 380 | 58 | 0 |
| 2 | 115 | 91 | 16 | 8 |
| 3 | 33 | 26 | 3 | 4 |
| 4 | 9 | 7 | 0 | 2 |
| 5 | 2 | 1 | 0 | 1 |
| 6 | 4 | 4 | 0 | 0 |
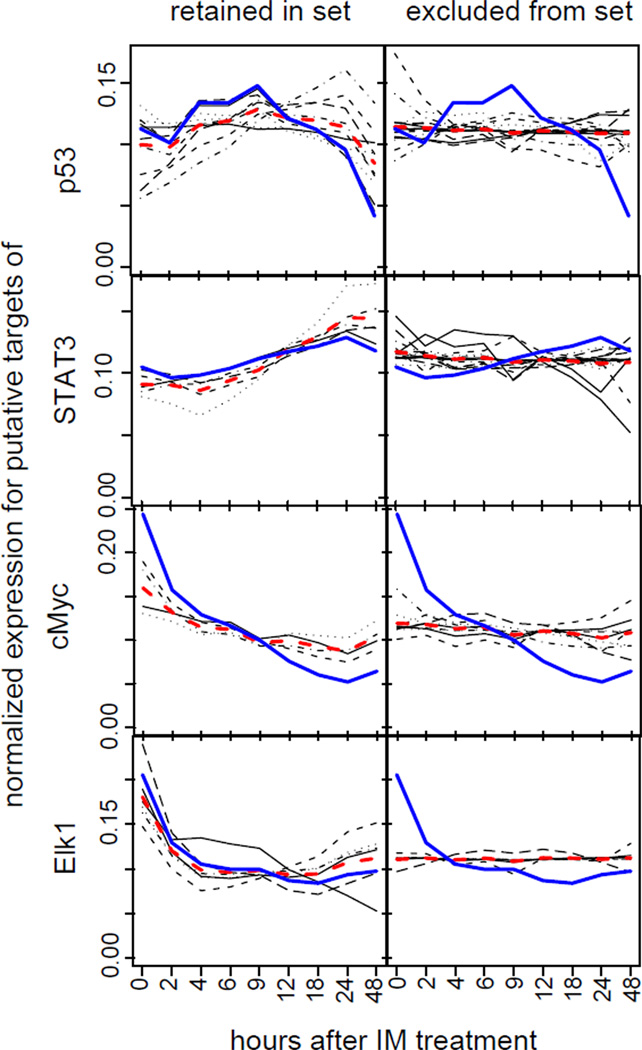
To explore this hypothesis, we compared the CoGAPS inferred expression patterns for each TF to the expression patterns of each of their target genes. In contrast to the simulated data, genes assigned to the prior regulatory set closely follow the inferred expression pattern (Figure 8; left panels), while genes removed were not correlated to the inferred patterns (Figure 8; right panels). In all panels, blue lines show the inferred pattern (rows of the P matrix) from CoGAPS, red lines are the mean of the individual genes, shown by black lines. Often, the genes that were eliminated (right panel) tended to show little expression response across the time course, suggesting that they were not regulated by these TFs in GIST cells.
Figure 8.
Summary of inferred transcription factor patterns in GIST data. Normalized, de-noised GAPS inferred expression patterns for each gene with a gene regulatory p-value less than 0.1 (black lines) and their average expression pattern (red), compared to the inferred, normalized pattern for the gene set (blue line) are plotted on the left for inferred targets of p53, STAT3, cMyc, and Elk-1 (from top to bottom). The panels on the right are similar plots for genes excluded from the set (i.e., with gene set regulatory statistics above 0.1).
We further explored the expression profile of genes for which the regulatory statistic of eq. 3 was below the 0.1 threshold in the TFs p53, STAT3, c-Myc, and Elk-1, whose activity was validated in [1] (Figure 8; left panels). In the case of p53, the inferred expression pattern reflects the transitory activity of the TF, decreasing at 9 hours, although the Western blots showed the strongest p53 phosphorylation, indicative of p53 TF activity, at 9–18 hours [1]. While the timing in the CoGAPS inferred pattern (blue line) differed from the measured TF activity, the genes that the regulatory statistic inferred to be regulated by these TFs (black lines) tended to have increased expression at 9–18 hours. Similarly, the expression in regulatory targets selected for both STAT3 and Elk-1 increased more strongly at 6 hours than the CoGAPS inferred pattern, consistent with the Western phosphorylation patterns. Unlike Elk-1, the regulatory statistic selected targets for c-Myc whose expression consistently decreased in time, agreeing with a lack of recovery of c-Myc activity in later time points. For each of these TFs, the expression profiles of excluded genes were either flat or anti-correlated to dominant gene expression profiles of putative targets for each TF (Figure 8; black lines in right panels).
VI. CONCLUSION
Context-specific transcriptional response plays an important role in biological systems, since evolution has driven reuse of genes and proteins in multiple contexts [16]. One key point where evolution plays this role is in the context-specific targets of transcription factors (TFs). Here, we have introduced a novel statistic, eq. 3, and demonstrated the recovery of context-specific TF targets in simulations and in imatinib-treated GIST cell lines. Although the summary statistic in eq. 3 could be applied to inferences from any matrix factorization (e.g., [17]) or differential expression (e.g., [18]) algorithm, the sparse atomic prior encoded in CoGAPS facilitates the removal of candidate genes. This is consistent with the fact that the retained TF targets are more robustly tied to the CoGAPS patterns than the removed targets and explains the observed tendency in the statistic to false negatives rather than false positives. The statistic may allow similar improvement in the inference of set membership when applied to a matrix factorization that uses candidate targets in the prior distribution (e.g., [11]).
The CoGAPS patterns estimate the association of common transcriptional profiles to samples, identifying patterns with significant strength (< Pi• > /sd(Pi•) > 0) in subtypes of samples (e.g., experimental conditions [13]). By comparing the regulatory statistic computed from independent decompositions for each context to a null distribution common across both contexts, the statistic for set membership of eq. 3 was extended to infer targets that were context-specific. Making the null distribution context independent facilitated the inference of targets distinguished by more subtle relative changes between contexts.
While CoGAPS factorizations were performed independently for each context-specific data set, the regulatory statistic could be modified for a factorization applied to both datasets simultaneously with
| (7) |
where s indexes each of the samples in the dataset and C indicates the context. Thus context-specific patterns provide more weight in the regulatory statistic than patterns common to samples from all contexts. To compare targets across these contexts, the null can be computed from targets of the complement to the gene set without the weights. This joint factorization will more accurately infer transcriptional activity in cases where contexts have common, overlapping samples.
If the contexts are distinct, care should be taken to insure that at least one of the patterns robustly distinguishes samples between contexts, which will insure that the contexts have been successfully distinguished in the joint factorization. Otherwise, independent factorization of samples within individual contexts should be performed using a common null computed from both factorizations. In any case, comparisons across contexts will be impossible when samples from the independent contexts are rendered incomparable, due to batch effects or measurements on distinct platforms. In these cases, the datasets should be treated as independent, computing the factorization, regulatory statistic, and null only from samples in a single context in order to avoid fitting technical artifacts as signals.
While formally similar to the mSD algorithm [19], Co-GAPS naturally accounts for the error distribution of gene expression data, unlike the sparse component analysis. As demonstrated previously [20], accounting for this uncertainty improves inference of functional gene relationships. Similarly, several databases and binding assays, such as ChiP-seq, commonly provide continuous prior probabilities for TF target membership, rather than the binary membership assumed in eq. 3. The probability information can be incorporated in our statistic by naïve assignment of genes to each of the sets 𝒢 according to a selected threshold. However, a more robust estimate for the summary statistic would be obtained by weights in eq. 3 based on prior probabilities.
Although this statistic was implemented on gene expression data measured with microarrays, the algorithm can be extended naturally for expression measured by RNA-seq or even to broader measures of common activity across samples. Computing the summary statistic resulting from permuting the prior probabilities would likely provide a robust null distribution for a modified regulatory statistic. A similar extension of the gene set statistic using small, but non-zero priors for genes that the database does not include in the target set could likewise be used to add genes as candidate targets of the TF. In this case, it may also be necessary to add a penalty term to eq. 3 to avoid overestimating candidate targets.
Acknowledgments
This work was supported by grants R21LM009382 and R01LM011000 to MFO, CA141053 to EJF, Russian Foundation for Basic Research 11-04-02016-a and JHU Framework for the Future to AVF. We thank Ludmila Danilova for helpful discussions. Code for results presented are available upon request to EJF (ejfertig@jhmi.edu).
REFERENCES
- 1.Ochs MF, Rink L, Tarn C, Mburu S, Taguchi T, Eisenberg B, Godwin AK. Detection of treatment-induced changes in signaling pathways in gastrointestinal stromal tumors using transcriptomic data. Cancer Res. 2009;vol. 69(no. 23):9125–9132. doi: 10.1158/0008-5472.CAN-09-1709. [DOI] [PMC free article] [PubMed] [Google Scholar]
- 2.Park PJ. ChIP-seq: advantages and challenges of a maturing technology. Nat Rev Genet. 2009;vol. 10(no. 10):669–680. doi: 10.1038/nrg2641. [DOI] [PMC free article] [PubMed] [Google Scholar]
- 3.ENCODE Project Consortium. An integrated encyclopedia of dna elements in the human genome. Nature. 2012;vol. 489(no. 7414):57–74. doi: 10.1038/nature11247. [DOI] [PMC free article] [PubMed] [Google Scholar]
- 4.Hannenhalli S. Eukaryotic transcription factor binding sites–modeling and integrative search methods. Bioinformatics. 2008;vol. 24:1325–1331. doi: 10.1093/bioinformatics/btn198. [DOI] [PubMed] [Google Scholar]
- 5.Sharov AA, Masui S, Sharova LV, Piao Y, Aiba K, Matoba R, Xin L, Niwa H, Ko MSH. Identification of Pou5f1, Sox2, and Nanog downstream target genes with statistical confidence by applying a novel algorithm to time course microarray and genome-wide chromatin immunoprecipitation data. BMC Genomics. 2008;vol. 9:269. doi: 10.1186/1471-2164-9-269. [DOI] [PMC free article] [PubMed] [Google Scholar]
- 6.Asif HMS, Sanguinetti G. Large-scale learning of combinatorial transcriptional dynamics from gene expression. Bioinformatics. 2011;vol. 27(no. 9):1277–1283. doi: 10.1093/bioinformatics/btr113. [DOI] [PubMed] [Google Scholar]
- 7.Vaske CJ, Benz SC, Sanborn JZ, Earl D, Szeto C, Zhu J, Haussler D, M J. Stuart, Inference of patient-specific pathway activities from multi-dimensional cancer genomics data using PARADIGM. Bioinformatics. 2010;vol. 26(no. 12):i237–i245. doi: 10.1093/bioinformatics/btq182. [DOI] [PMC free article] [PubMed] [Google Scholar]
- 8.Gonye GE, Chakravarthula P, Schwaber JS, Vadigepalli R. From promoter analysis to transcriptional regulatory network prediction using PAINT. Methods Mol Biol. 2007;vol. 408:49–68. doi: 10.1007/978-1-59745-547-3_4. [DOI] [PubMed] [Google Scholar]
- 9.Kossenkov AV, Ochs MF. Matrix factorisation methods applied in microarray data analysis. Int J Data Min Bioinform. 2010;vol. 4(no. 1):72–90. doi: 10.1504/ijdmb.2010.030968. [DOI] [PMC free article] [PubMed] [Google Scholar]
- 10.Fertig EJ, Ding J, Favorov AV, Parmigiani G, Ochs MF. CoGAPS: an R/C++ package to identify patterns and biological process activity in transcriptomic data. Bioinformatics. 2010;vol. 26(no. 21):2792–2793. doi: 10.1093/bioinformatics/btq503. [DOI] [PMC free article] [PubMed] [Google Scholar]
- 11.Kossenkov AV, Peterson AJ, Ochs MF. Determining transcription factor activity from microarray data using Bayesian Markov chain Monte Carlo sampling. Stud Health Technol Inform. 2007;vol. 129(no. Pt 2):1250–1254. [PubMed] [Google Scholar]
- 12.Sibisi S, Skilling J. Prior distributions on measure space. Journal of the Royal Statistical Society, B. 1997;vol. 59(no. 1):217–235. [Google Scholar]
- 13.Fertig EJ, Ren Q, Cheng H, Hatakeyama H, Dicker A, Rodeck U, Considine M, Ochs MF, Chung CH. Gene expression signatures modulated by epidermal growth factor receptor activation and their relationship to cetuximab resistance in head and neck squamous cell carcinoma. BMC Genomics. 2012;vol. 13:160. doi: 10.1186/1471-2164-13-160. [DOI] [PMC free article] [PubMed] [Google Scholar]
- 14.Rocke DM, Durbin B. A model for measurement error for gene expression arrays. J Comput Biol. 2001;vol. 8(no. 6):557–569. doi: 10.1089/106652701753307485. [DOI] [PubMed] [Google Scholar]
- 15.Matys V, Fricke E, Geffers R, Gössling E, Haubrock M, Hehl R, Hornischer K, Karas D, Kel AE, Kel-Margoulis OV, Kloos D-U, Land S, Lewicki-Potapov B, Michael H, Münch R, Reuter I, Rotert S, Saxel H, Scheer M, Thiele S, Wingender E. TRANSFAC: transcriptional regulation, from patterns to profiles. Nucleic Acids Res. 2003;vol. 31(no. 1):374–378. doi: 10.1093/nar/gkg108. [DOI] [PMC free article] [PubMed] [Google Scholar]
- 16.Preston J, Hileman L, Cubas P. Reduce, reuse, and recycle: Developmental evolution of trait diversification. Am J Bot. 2011;vol. 98:397–403. doi: 10.3732/ajb.1000279. [DOI] [PubMed] [Google Scholar]
- 17.Kim PM, Tidor B. Subsystem identification through dimensionality reduction of large-scale gene expression data. Genome Res. 2003;vol. 13(no. 7):1706–1718. doi: 10.1101/gr.903503. [DOI] [PMC free article] [PubMed] [Google Scholar]
- 18.Smyth GK. Linear models and empirical bayes methods for assessing differential expression in microarray experiments. Stat Appl Genet Mol Biol. 2004;vol. 3 doi: 10.2202/1544-6115.1027. p. Article3. [DOI] [PubMed] [Google Scholar]
- 19.Gong T, Xuan J, Chen L, Riggans RB, Li H, Hoffman EP, Clarke R, Wang Y. Motif-guided sparse decomposition of gene expression data for regulatory module identification. BMC Bioinformatics. 2011;vol. 11 doi: 10.1186/1471-2105-12-82. [DOI] [PMC free article] [PubMed] [Google Scholar]
- 20.Wang G, Kossenkov AV, Ochs MF. LS-NMF: a modified non-negative matrix factorization algorithm utilizing uncertainty estimates. BMC Bioinformatics. 2006;vol. 28:175. doi: 10.1186/1471-2105-7-175. [DOI] [PMC free article] [PubMed] [Google Scholar]


