Abstract
We characterized flame retardant (FR) morphologies and spatial distributions in 7 consumer products and 7 environmental dusts to determine their implications for transfer mechanisms, human exposure, and the reproducibility of gas chromatography-mass spectrometry (GC-MS) dust measurements. We characterized individual particles using scanning electron microscopy / energy dispersive x-ray spectroscopy (SEM/EDS) and Raman micro-spectroscopy (RMS). Samples were screened for the presence of 3 FR constituents (bromine, phosphorous, non-salt chlorine) and 2 metal synergists (antimony and bismuth). Subsequent analyses of select samples by RMS enabled molecular identification of the FR compounds and matrix materials. The consumer products and dust samples possessed FR elemental weight percents of up to 36% and 31%, respectively. We identified 24 FR-containing particles in the dust samples and classified them into 9 types based on morphology and composition. We observed a broad range of morphologies for these FR-containing particles, suggesting FR transfer to dust via multiple mechanisms. We developed an equation to describe the heterogeneity of FR-containing particles in environmental dust samples. The number of individual FR-containing particles expected in a 1-mg dust sample with a FR concentration of 100 ppm ranged from <1 to >1000 particles. The presence of rare, high-concentration bromine particles was correlated with decabromodiphenyl ether concentrations obtained via GC-MS. When FRs are distributed heterogeneously in highly concentrated dust particles, human exposure to FRs may be characterized by high transient exposures interspersed by periods of low exposure, and GC-MS FR concentrations may exhibit large variability in replicate subsamples. Current limitations of this SEM/EDS technique include potential false negatives for volatile and chlorinated FRs and greater quantitation uncertainty for brominated FR in aluminum-rich matrices.
Keywords: flame retardants, electron microscopy, Raman, exposure assessment
1. Introduction
With the influx of plastics to the global marketplace following World War II, hundreds of different flame retardants (FR) have been used in an increasing variety of products that are made from flammable petroleum-based polymers (Hindersinn, 1990). FRs can be regarded as either inorganic or organic products, with each class making up roughly half of the global FR production volume (van Esch, 1997). Inorganic FRs, including aluminum trihydroxide, magnesium hydroxide, and antimony trioxide are used alone or as synergists in combination with organic FRs. Organic FRs can be further categorized as either organohalogenated products containing chlorine (e.g., chlorinated paraffins) or bromine [e.g., polybrominated diphenyl ethers (PBDEs)] or as organophosphorous products containing phosphorous (e.g., phosphate esters) (van Esch, 1997). Other organic FRs may contain both a halogen and phosphorous [e.g., tris(chloropropyl)phosphates] or neither (e.g., the nitrogen-based FR, melamine cyanurate) (van Esch, 1997). Halogenated FRs are of particular interest due to their tendency to bioaccumulate in the food chain, and their association in human and animal studies with endocrine disruption, immunotoxicity, reproductive toxicity, effects on child development, and cancer (Shaw et al., 2010).
Numerous surveys of residential dust have shown that FRs containing bromine (Harrad et al., 2010; Covaci et al., 2011; Whitehead et al., 2011), chlorine (Zhu et al., 2007; Friden et al., 2011; Wang et al., 2011) and phosphorous (van der Veen et al., 2012) are ubiquitous contaminants in homes around the world and that residential dust is a likely source of human exposure to FRs. A typical U.S. home will contain numerous consumer goods treated with FRs, including furniture, carpets, draperies, televisions, and computers (Hindersinn, 1990). Investigators have observed that FR concentrations in residential dust are correlated with the number of household items treated with FRs (Allen et al., 2008). This observation suggests that FRs can migrate from household items into residential dust, but the mechanism of transfer is unclear. Webster et al. (2009) proposed that PBDEs transferred from polymers to dust particles by volatilization would be found homogeneously distributed on all dust particles, whereas a FR transferred to dust via weathering or abrasion would remain attached to the original polymer particles and be heterogeneously distributed within the dust. For less volatile FRs [e.g., decabromodiphenyl ether (BDE-209)] or FRs that are chemically bonded to polymers (e.g., tetrabromobisphenol A), polymer weathering may be the dominant transfer mechanism, whereas more volatile, additive FRs (e.g., hexabromocyclododecane) are more likely to leach to the polymer surface (Alaee et al., 2003) and may be more readily available for transfer to dust via volatilization.
Halogenated FRs are intended to suppress or slow flame events by liberating free radicals which interfere with exothermic reactions that otherwise would sustain fire (European Flame Retardants Association, 2011). To select a viable FR for use in a particular plastic, manufacturers must consider not only a product’s ability to slow fire, but also the effect of the FR on the mechanical properties of the polymer (i.e., polymer strength, flexibility, color, and purity), the thermal stability of the FR, and the likelihood that the FR will migrate to the polymer surface (Organisation for Economic Co-Operation and Development 1994). Thus, while some FRs can be used as “general purpose” FRs in a wide variety of materials, others are used to treat specific polymers, [e.g., the Penta-brominated diphenyl ether (Penta-BDE) mixture used primarily to treat polyurethane foam for cushioned furniture in the U.S. (Organisation for Economic Co-Operation and Development 1994)]. Moreover, a specific polymer (e.g., foam) may have a unique particle morphology that can be recognized amongst particles present in an environmental dust sample. Thus, given a particle’s morphology and chemical composition, it may be possible, in some cases, to deduce the source material and the mechanism by which the FR was transferred to the dust.
FR concentrations in environmental dust can be measured using gas chromatography/mass spectroscopy (GC/MS) with differing amounts of measurement variability, depending on the characteristics of the FR. For example, among the major PBDE congeners, BDE-209 has exhibited approximately 3 times higher variability than that measured for both BDE-47 and BDE-99 in replicate quality control samples (Whitehead et al, 2013). It may be possible to attribute the degree of measurement variability in FR concentrations to the morphology and spatial distribution of FR-containing particles within a given dust sample.
Scanning electron microscopy / energy-dispersive x-ray spectroscopy (SEM/EDS) is a useful technique for determining the morphology and chemistry of bulk materials and individual particles (Casuccio et al., 1983; Lioy et al. 2002; Wagner et al, 2012). The ability of SEM/EDS to characterize PBDE FR materials has been demonstrated in recent works by Webster et al. (2009), who used SEM/EDS to analyze three environmental dust samples, and Holbrook et al. (2012), who analyzed a plastic television case by several techniques, including SEM/EDS.
Raman micro-spectroscopy (RMS) offers molecular level compositional information for bulk materials as well as single particles and is suitable for identifying components within a heterogeneous sample with micrometer scale spatial resolution (Ghosal and Wagner, 2013). The combined use of SEM/EDS and RMS has been shown to be an attractive tool for the characterization of complex samples (Nelson et al., 2001; Stefaniak et al, 2009).
The objective of this study was to characterize the morphology, spatial distribution, and semi-quantitative FR concentrations of particles from common household products and various environmental dusts using combination of SEM/EDS and RMS. Based on our observations, we describe the likely mechanisms by which FRs are transferred from FR-containing items to environmental dust. We discuss how the heterogeneous distribution of FR-containing particles in environmental dust may impact human exposure to FRs and the reproducibility of FR dust measurements using GC-MS.
2. Material and Methods
2.1 Sample Collection
Seven potential FR source materials were collected by the authors from a range of common household and automotive items historically known to contain FRs (Table 1). These items had been subjected to frequent use and were of unknown manufacture date, but they are estimated to have originated between the years 1985–2000. Samples on the order of 1 mm2 were extracted from each material using a clean scalpel blade. Extracted samples which existed in an unambiguous spatial orientation in the product (i.e., all except the individual van seat upholstery fibers and the two PUF foam samples) were split in half to enable simultaneous analyses of the exposed outer surface and the inner matrix material. The samples were then mounted on double-sided carbon tab substrates on standard, aluminum SEM stubs and inspected with a low-power stereozoom microscope with digital camera (SD-6 microscope and DFC320 camera, both Leica Microsystems, Wetzlar, Germany).
Table 1.
Average FR weight percents (wFR, avg), particle size (dFR, avg), and morphology for various sources and environmental dusts. Standard deviations not calculated for wFR, avg < 1% (EDS single-particle quantitation limit).
| wFR, avg (st. dev.)[%]
|
Br distrib. (region size) | Avg. metal synergist conc. (st dev)[%] | Metal synergist (region size) | dFR, avg (gross morphology) | inorganic matrix elementsc | Typical SEM/BSE Image (80 um wide) | |||
|---|---|---|---|---|---|---|---|---|---|
| P [%]a | Cl [%]a,b | Br [%] | |||||||
| Source Materials | |||||||||
| Van seat upholstery coating | <1 | 8.6 (2.2) | 10 (2.0) | discrete (1–5 um) | 3.3 (1.1) | Sb (0.1–2 um) | 10–100um (uniform mixture) | salt |

|
| VCR | -- | <1 | 7 (1.9) | continuous | <1 | Bi-Cl (0.1–2 um) | -- (bulk polymer) | Ca, Ti, K |

|
| Television | -- | -- | 15 (1.7) | discrete (<1 um) | 2.9 (0.4) | Sb (0.1–2 um) | -- (bulk polymer) | (Si, Ti, Fe) d |

|
| Computer monitor/CRT | 2.3 (0.9) | <1 | -- | -- | <1 | Sb (0.1–2 um) | -- (bulk polymer) | Ti, K, F |

|
| Car visor covering | -- | 36 (2.4) | -- | -- | <1 | Sb (2–10 um) | -- (bulk polymer) | Ca, Ti |

|
| Van seat PUF | <1 | -- | 7 (1.7) | continuous | -- | -- | -- (porous foam) |

|
|
| Car visor PUF | <1 | 3.3 (0.3) | -- | -- | -- | -- | -- (porous foam) | Ca |

|
| FR Particle Types in Environmental Dusts (# observed) | |||||||||
| A (3) | <1 | 1.5 (1.3) | 31 (12) | discrete (1–5 um) | 10.9 (3.0) | Sb (0.1–2 um) | 30–50 um (uniform mixture) | crustal/soil |

|
| B (1) | <1 | 1.7 (1.4) | 6 (8.3) | discrete (1–5 um) | 15.8 (1.0) | Sb (0.1–2 um) | 100 um (uniform mixture) | crustal/soil |

|
| C (8) | -- | -- | 5 (6.4) | discrete (1–5 um) | 1.8 (0.8) | Sb (0.1–2 um) | 40–100 um (smooth, angular fractures) | crustal/soil, Ti |

|
| D (2) | -- | 15 (4.8) | -- | -- | 9.9 (3.7) | Sb (0.1–2 um) | 20 × 900 um (synthetic fiber) | N |

|
| E (2) | -- | -- | 12 (10) | discrete (5–7 um) | 3.1 (1.1) | Sb (0.1–2 um) | 100 um (heterogeneous agglomerate) | crustal/soil, Ti |

|
| F (2) | -- | -- | 3 (4) | discrete (1–2 um) | <1 | Sb (0.1–2 um) | 80–100 um (heterogeneous agglomerate) | crustal/soil, salt, Ca, K |

|
| G (1) | -- | 3.0 (0.1) | 11 (14) | discrete (1–5 um) | 6.1 (0.6) | Sb (0.1–2 um) | 20 um (loosely attached to agglomerate) | crustal/soil |

|
| H (2) | -- | <1 | -- | -- | 5.6 (2.1) | clusters of Sb (0.1–2 um) | 10–20 um (loosely attached to agglomerate) | crustal/soil, Ti |

|
| I (3) | -- | -- | -- | -- | 1.8 (1.8) | single attached Sb (1–2 um) | 20–30 um (heterogeneous agglomerate) | crustal/soil, Ca, K |

|
continuous distribution in matrix; homogeneously mixed
Cl weight percent in excess of 1:1.5 Na:Cl ratio
crustal/soil elements = Al, Si, K, Fe, Mg, S, Na, Cl; specific elements denoted when in excess of 95%CI of crustal/soil avg Si ratio
outer surface of front case only
Seven environmental dust samples were obtained from two recent public health studies. The major focus of this work was dust which was collected in 2010 using household vacuum cleaners from homes participating in the Northern California Childhood Leukemia Study (NCCLS), a large, case–control study of childhood leukemia conducted in the San Francisco Bay area and California Central Valley (Whitehead et al., 2013). Six dust samples with relatively high concentrations of PBDEs as measured by GC/MS were obtained from the NCCLS, with 2–6 SEM subsamples prepared from each. In addition, a brief survey was conducted of one subsample from the second study, dust which was collected in 2010 using a standard microvac cassette vacuum method from working firehouses in Southern California (Das and Israel, 2012).
For each subsample, dusts were extracted randomly from the sample vial using tweezers, weighed gravimetrically, then spread into an approximate monolayer across double-sided carbon tab substrates mounted on standard aluminum SEM stubs. Typical dust masses per subsample ranged from 1–2 mg. Initial subsamples were prepared without the gravimetric weighing step. To enable inclusion of these initial samples in the calculations presented in Section 2.3, digital stereozoom images were acquired at 6.3x from the initial subsamples, as well as six dust subsamples on SEM stubs that had been weighed gravimetrically. These images were converted to quantitative dust areas via image analysis with Photoshop (Adobe, San Jose) and ImageJ (National Institutes of Health) software. The resulting empirical correlation between dust deposit area and gravimetric mass (Pearson correlation rp = 0.65) was used to estimate the masses of the initial subsamples.
2.2 Scanning Electron Microscopy
SEM analyses were conducted with an FEI XL30 Environmental SEM (Eindhoven, The Netherlands) with a back-scattered electron (BSE) detector, tungsten emission source, and an energy-dispersive X-ray spectroscopy (EDS) analyzer with 30 mm2 silicon drift x-ray detector (Noran System Seven, Thermo Fisher Scientific, Middleton, WI).
Samples were analyzed at a working distance of 10 mm and an accelerating voltage of 20 kV. To improve resolution and minimize charging effects with the relatively large, non-conductive consumer product samples, 0.5 mbar of water vapor was injected into the SEM chamber. In addition, the environmental dust particles required a coating of approximately 10 nm of carbon before analyses using a high-vacuum evaporative coater with double-carbon thread attachment (Bal-Tec MED-020, Liechtenstein) to improve stability under the beam.
The FR elements considered in this study were bromine (Br), phosphorus (P), and chlorine (Cl), along with 2 metal synergists, antimony (Sb), and bismuth (Bi). Manual SEM/EDS scans were performed at 600× magnification to search for sample regions containing Br, Sb, or Bi, which appeared brighter than the carbon-dominated sample matrices when using the atomic number (Z)-sensitive BSE detector. Cl and P did not possess high enough Z to provide good contrast for BSE screening, and thus were only detected in FR particles when they were co-present with Br, Sb, or Bi, or were from a source already expected to contain FR. The use of the term “FR” in these SEM/EDS analyses thus refers to the presence of FR-associated elements, and assumes that such species were utilized at least partially for their FR properties. The C- and O-based matrix of all analyzed FR materials and dust particles could only be identified as a carbonaceous material by SEM/EDS. In some samples, subsequent RMS analysis was used to determine the actual molecular identity of the FR compound and the carbonaceous matrix.
For each FR particle, X-rays were acquired while rastering across the entire particle, and then average EDS elemental weight percents were calculated using the instrument’s Proza algorithm. The single-particle-averaged quantitation limit was a function of the EDS system sensitivity and was set at 1%. The single-particle-averaged detection limit depends upon the relationship between the size of the FR particle and the size and number of sub-regions in which the FR is concentrated, but is typically much lower than the 1% quantification limit. For a dust in which only a fraction of the particles contain FR, the dust-averaged FR detection limit, or analysis sensitivity, would be correspondingly lower (see Section 2.3).
The single-particle quantitation accuracy of the EDS system was calibrated against a 0.3 – 30μm glass microsphere standard (SRM 2066, National Institute of Standards and Technology, Gaithersburg, MD) and was determined to be accurate to within 3% weight percent for particles >10 um. Because the predominant Br-L peak at 1.48 keV is nearly coincident with the aluminum (Al)-L peak at 1.49 keV, positive Br identifications were only made when the smaller, Br-Kα1 (11.9 keV) and K-β1 (13.3 keV) peaks were also measurable. To minimize any contribution from an aluminum background, colloidal graphite was applied to any aluminum stub edge regions not covered by the carbon tab. A 98% BDE-209 powder (#194425-100g, Sigma Aldrich, St. Louis) was used to confirm Br peak identification by SEM/EDS and molecular identification by RMS.
Quantitative EDS results from 51 manual analyses were tabulated to group particles into similar FR types and detect similarities and differences in morphology and composition. When known soil/crustal matrix elements (silicon with smaller amounts of Al, potassium, iron, magnesium, sulfur, sodium [Na], and chlorine [Cl]) were found together in a particle, they were identified automatically by an automated algorithm (Microsoft Excel, Redmond, WA). In addition, mean crustal/soil elemental ratios to silicon were calculated for the FR-containing environmental dust particles measured in this study, and the 95% CI’s about these mean values were then used to automatically flag excess amounts of any of these elements beyond the typical crustal values.
Non-salt chlorine was quantified by determining the amount of Cl present in excess of a 1.5:1 Cl:Na mass ratio (assuming a 1:1 molar, [35.5 g ]: [23 g] ratio). Detected non-salt Cl was assumed to either be present as a FR additive, or as part of a chlorinated polymer matrix. The Cl in the latter case was still considered to be a FR compound, since chlorinated polymers have a FR effect and are often employed by manufacturers with this functionality in mind (European Flame Retardants Association, 2011).
The accuracy of Br quantitation for particles that also contain Al (most commonly, those with crustal/soil elements present) depends upon the method used by the EDS system to extract and separate the Br and Al peaks. The uncertainty of this quantitation was estimated by employing two standard peak-fitting routines (Gaussian and Filter fit) for each EDS acquisition and calculating the standard deviation between the results. This “peak fit” variability was calculated for all FR elements measured in this study, though the variability was anticipated to be much lower for the other peaks that had no problematic, overlapping elemental lines.
Spatial variability of FR species concentrations was also calculated for FR source materials in terms of variations in EDS weight percent measured in different source material regions. For the environmental dusts, differences between single dust particles of the same FR dust type were assessed. A combined standard deviation was then calculated for each FR type: scombined = [speak fit2 + sspatial2]0.5. Standard deviations were not calculated for concentrations below the EDS single-particle quantitation limit of 1%.
For select FR particles, EDS spectra were acquired at each pixel of an image to create spectral imaging (SI) maps of X-ray intensities for specific elements. These SI maps were used to elucidate differing Br distributions within particles.
2.3 Dust-averaged FR Quantitation and Predicted FR Heterogeneity
Mass concentrations of FR species in the NCCLS environmental dusts were calculated using
| (1) |
where the index k indicates a sum over FR-containing particles only, KFR is the total number of detected FR particles, mk, FR is the mass of FR species in particle k, Mdust, scanned is the scanned dust mass, wk, FR is the weight percent of the FR species in particle k as measured by SEM/EDS, mk is the mass of particle k (mk = ρk,avg π dk3 / 6), dk is the volume-equivalent diameter of particle k [assumed to be approximately equal to the projected-area-equivalent diameter, (dk = 4 × Ak / π)0.5], Ak is the projected area of particle k as measured by image analysis with ImageJ, ρk,avg is the density of particle k assumed to be equal to an average dust particle density of 2.0 g/cm3 (as in Wagner and Leith, 2001), fscanned is the fraction of the subsample that was scanned, and Mdust is the total dust mass of the subsample measured gravimetrically. For this study, fscanned = 0.2–0.8, yielding a total analyzed dust mass per sample of 1–4 mg.
The analysis sensitivity is defined as the value of CFR when KFR=1 and mk, FR = the average single-particle FR mass detected in this work (31 ng). The analysis sensitivity is thus a function of Mdust scanned. Blank CFR values were not determined here, due to the fact that unused vacuum cleaner bags from the NCCLS study were not available.
To model simplified cases, if one assumes that one type of FR source is dominant in a dust, such that the KFR particles in the dust would be well characterized by an average FR weight percent (wFR, avg) and particle diameter dFR, avg), and that fscanned =1, then Equation 1 becomes
| (2) |
Rearranging, one can predict the number of FR-containing particles in a given Mdust with a known CFR:
| (3) |
2.4 Raman Micro-spectroscopy
RMS measurements were performed using a Renishaw inVia Raman microscope (Renishaw Plc., Old Town, Wotton-under-Edge, Gloucestershire, U.K.) equipped with 785 nm and 532 nm lasers. Samples were excited using 1–100 mW of laser light focused onto the sample, typically through a 20× or 50× objective with signal acquisition times of 60–120 s per measurement. A GRAMS WiRE software package (Galactic Industries Corp., 395 Main St., Salem, NH) was used for instrument control and data acquisition. A more detailed description is presented elsewhere (Ghosal and Wagner, 2013).
3. Results
3.1 Consumer Product as Potential FR Source Materials
Table 1 summarizes the morphology and composition of 7 different types of FR-containing consumer products as determined by SEM/EDS, including bulk polymers and porous foam structures. Each material was characterized in 1–6 regions, for a total of 23 independent measurements.
Maximum P, non-salt Cl, and Br compositions measured in the consumer product materials were 2.3%, 36%, and 15%, respectively.
Metal synergists were detected in 5 of the 7 materials. All of them consisted of Sb except one which contained Bi-Cl particles. The maximum metal synergist concentration in these source materials was 3.3%.
Measured P variability for the computer monitor sample was 0.9 weight percent, or 40% of the P concentration. Measured Cl standard deviations within source materials ranged from 0.3–2.4 weight percent, or 7–25% of the average Cl concentrations. Peak-fit and spatial variability each contributed approximately 50% of the total P and Cl variability. Measured Br variability was comparable to that of Cl, with overall standard deviations within each source material of 1.7–2.0 weight percent, or 12–27% of the average Br concentrations. The contribution from Br peak fit variability was much less than from Br spatial variability, averaging only 6% of the total.
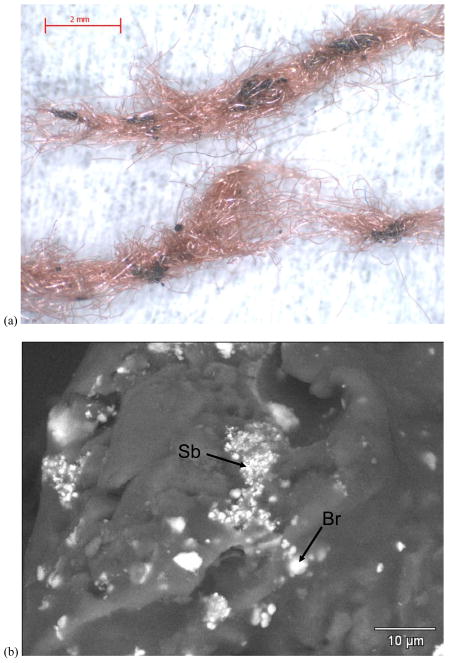
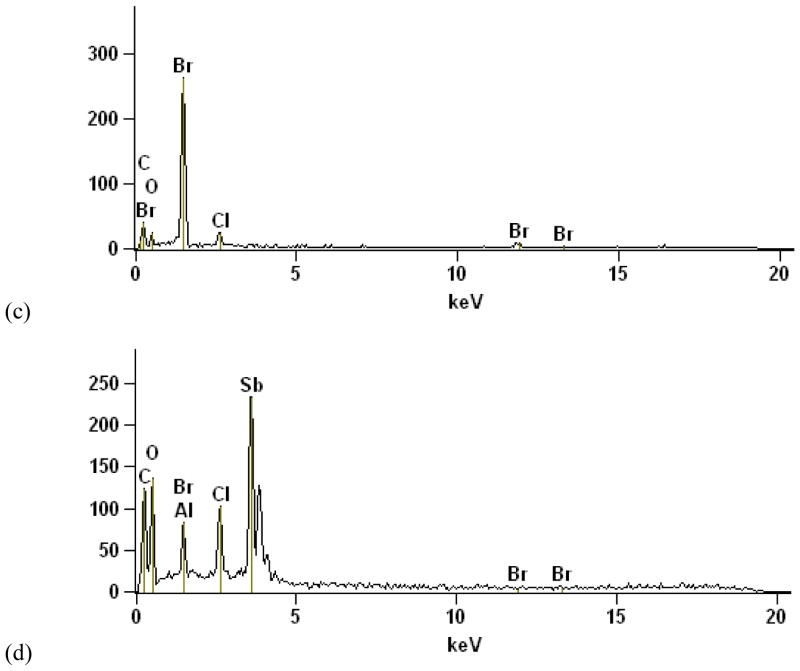
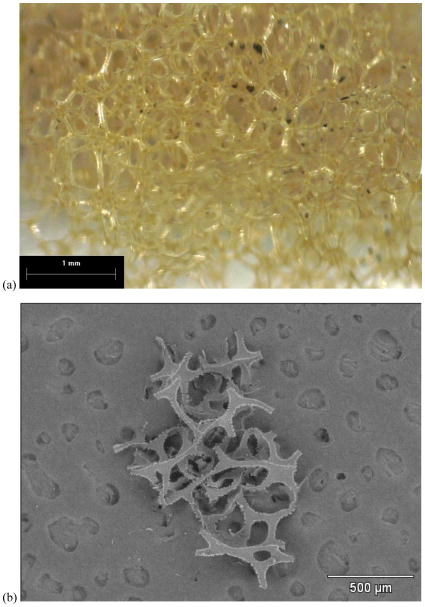
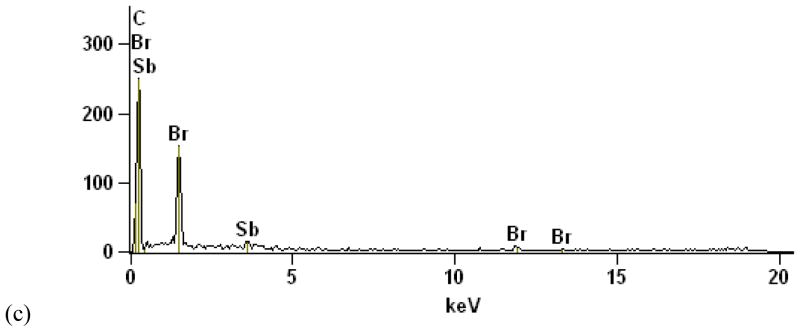
The aged van seat upholstery (Figure 1a) consisted of red fibers with black, FR-enriched particle agglomerates which appear to be loosely attached to the fibers. The SEM BSE image and EDS data [Figures 1(b) – (d)] from one of these black particle agglomerates show 1–5μm Br regions and 0.1–1μm Sb regions (bright spots). Figure 2 shows porous foam from the same van seat exhibiting a homogeneous distribution of a lower-concentration Br species. The dissimilar morphology and Br distribution in the foam implies a second type of FR in this van seat. Black FR-enriched particles from the upholstery were also found scattered in the foam (Figure 2(a). RMS identified the FR in the upholstery particles as BDE-209 and Sb2O3, confirmed that the foam FR was a second, distinct species, and identified the fiber and foam polymer matrices (Ghosal and Wagner, 2013).
Figure 1.
FR particles from van seat upholstery. a) 12.5× stereozoom image showing black FR particles attached to red upholstery fibers. b) 3200× SEM BSE image of black FR particle showing 1–5 um Br regions and 0.1–1 um Sb regions. c) EDS from Br region. d) EDS from Sb region.
Figure 2.
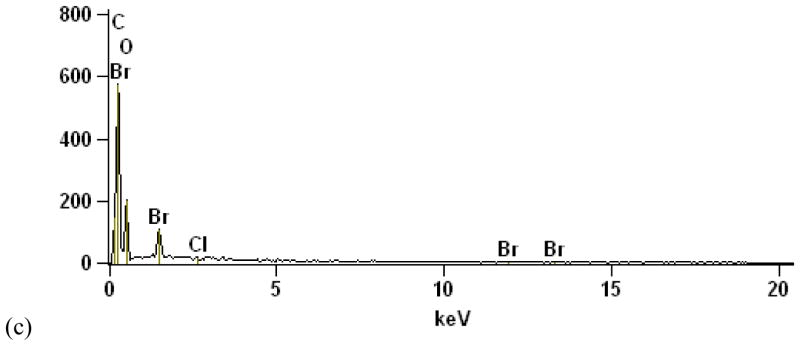
FR-containing porous foam from van seat. a) 20× stereozoom image. This subsample was extracted from immediately beneath the upholstery and exhibits dislodged upholstery FR particles (see Figure 1) as well. b) 95× SEM BSE image showing uniform distribution of Br throughout (i.e., no bright spots). c) EDS averaged over entire PUF particle, showing small Br peaks.
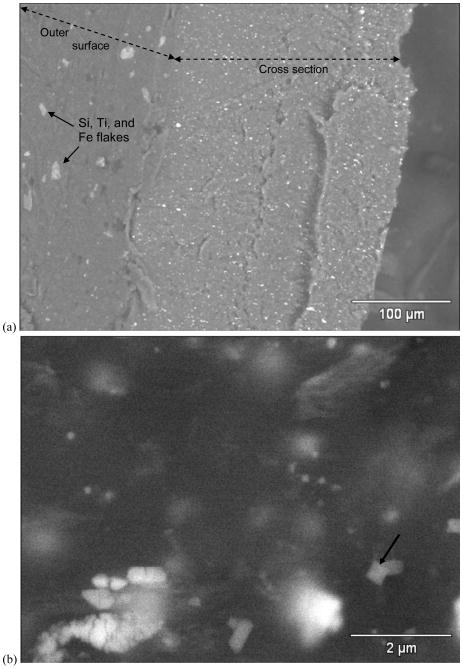
The plastic television case shown in Figure 3 was identified as high-impact polystyrene (HIPS) by RMS (Ghosal and Wagner, 2013). Nearly all SEM/EDS analyses of the front and back television case surfaces and cross-sections revealed uniformly distributed Br, as well as distinct Sb regions that were approximately 0.3–2μm in size and 1–10μm apart. The only exception was the outermost 5–15μm of the front case, which was uniformly absent of FR-particles and embedded with Si, Ti, and Fe flakes (Figure 3a). At SEM BSE magnifications >10,000x, bright, submicron regions separated by 0.1–1μm were visible throughout the low-intensity polymer matrix (Figure 3b). The limited Br-K x-ray spatial resolution of 5–10μm for a 20 kV beam (Willis et al., 2002; Holbrook et al., 2012) precludes the unique attribution of the Br x-rays to these closely-spaced, submicron regions. However, since the bright, submicron regions exhibited no other high-Z EDS peaks besides Br, the evidence suggests that they are in fact extremely fine, brominated particles. The brominated species was identified as BDE-209 by RMS (Ghosal and Wagner, 2013).
Figure 3.
HIPS plastic from television. a) 500× SEM BSE image of front case sample viewed on end. Si, Ti, and Fe were embedded in the outer surface (light gray flakes in left third of image), while FR particles (smaller bright spots) dominated the remainder of the cross section. b) 26,000× SEM BSE image of rear case plastic showing irregular FR particles (bright spots), some as small as 100 nm. b) EDS acquired at arrow in (b), showing Br and Sb peaks.
3.2 FR in Environmental Dusts
3.2.1 Particle Characterizations
Table 1 lists SEM/EDS-determined particle characteristics and approximate FR concentrations for nine different types of FR-containing particles (“A” – “I”) observed in the seven environmental dust samples analyzed in this study. The Type D particles were observed in the sample from the firehouse study; all other types were observed in the NCCLS samples. The FR-containing particles appeared in a variety of forms including uniform mixtures, mixed-source agglomerates, smooth-surfaced particles with angular fractures, and fibers. The number of particles observed within each dust type ranged from 1–8 particles. 24 different FR particles were analyzed plus 4 replicate acquisitions, for a total of 28 dust particle acquisitions.
Maximum P, Cl, and Br compositions measured in the FR-containing environmental dust particles were comparable to the tested FR-treated materials, <1%, 15%, and 31%, respectively. Sb metal synergists were found in all nine FR-containing dust particle types, with a maximum Sb concentration of 16%.
The measured uncertainty in FR quantitation was higher for the dust samples than for the consumer products. Measured Cl variability within each dust type ranged from 1.3–4.8 weight percent, or 30–90% of the average Cl concentrations. Measured Br variability within each dust type ranged from 6.4–12 weight percent, or 40–130% of the average concentrations. The contribution from peak fit variability was negligible for Cl (averaging 2% of the total Cl variability), but was the major contributor to Br variability (averaging 90% of the total Br variability). The uncertainty in Br peak measurement in these aluminum-silicate dusts was expected due to the presence of the interfering Al peak.
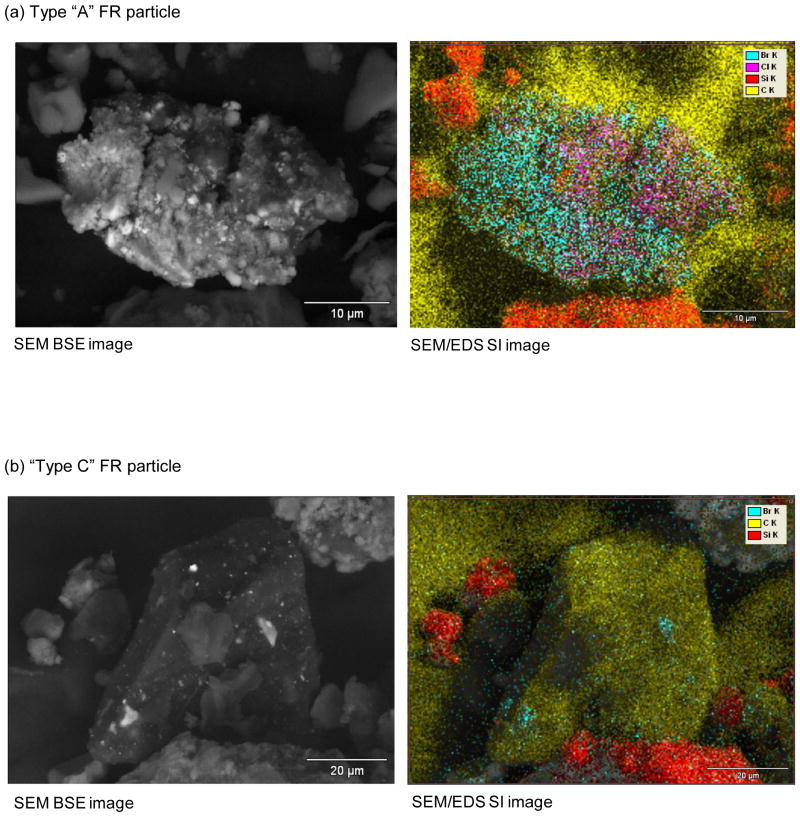
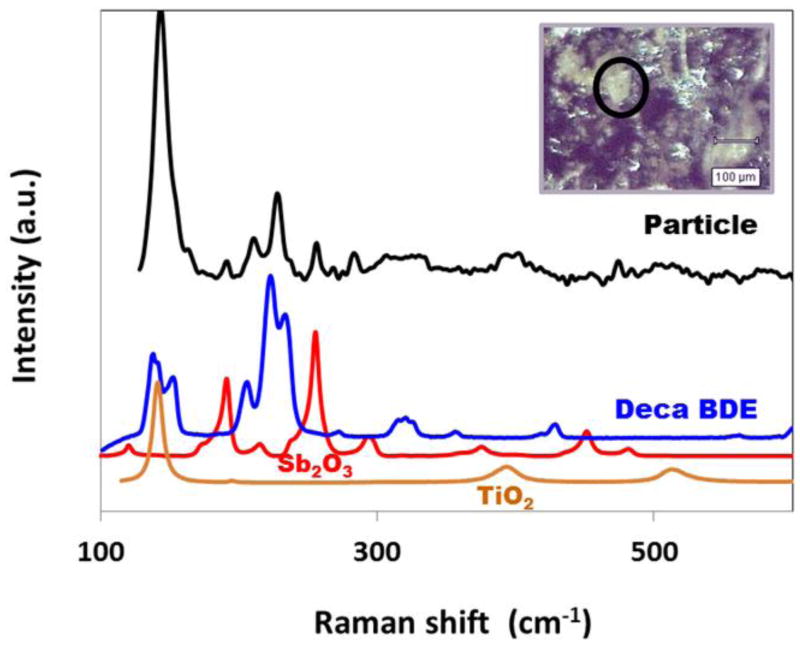
Type A–D (Table 1) FR particles all possessed relatively homogeneous distributions of distinct Br and Sb hot spots. In contrast, Type E-I FR particles showed relatively indistinct, heterogeneously-mixed regions of FR. Within the former group, SEM/EDS SI images of Type A and Type C dust particles in Figure 4 show distinct differences in Br and Sb distribution and morphology, thereby implying their origin from two different FR source materials. Figure 5 shows RMS analyses of another Type C dust particle, which identified the primary FR components as BDE-209 and antimony trioxide, and the carbonaceous matrix as polyethylene. MS also identified titanium dioxide (TiO2) in the matrix (Figure 5), consistent with the titanium detected by SEM/EDS (Type C, Table 1).
Figure 4.
SEM BSE and SEM/EDS SI images showing differing Br distributions within two different types of FR particles observed in the NCCLS dust samples.
Figure 5.
RMS identification of FR and matrix components in a Type C particle from a NCCLS dust sample. Raman spectrum of the dust particle is compared with reference Raman spectra of BDE-209 (Deca BDE), antimony trioxide (Sb2O3), and titanium dioxide (TiO2). Inset shows 5× reflected light image of the analyzed FR particle.
“Type D” dust particles consisted of fibers with Cl throughout and Sb regions embedded within the fiber itself, unlike the FR regions associated with the upholstery fibers, which were contained in particles loosely attached to the fiber surfaces.
Two of the detected FR particle types (types H and I) were notable in that they exhibited distinct clusters or single Sb regions, but little or no other FR related elements.
3.2.2 Heterogeneity of FR in Dust
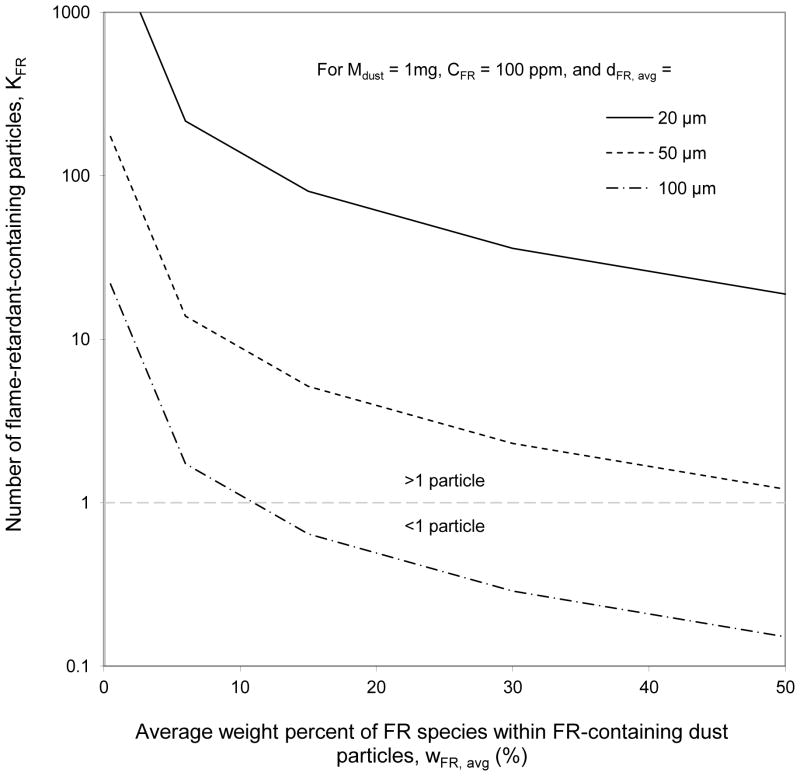
Equation 3 was used to predict the expected number of Br-containing particles (KFR) in 1-mg of dust with 100 ppm Br for a range of FR dust morphologies (Figure 6). The input ranges of measured FR elemental weight percents (wFR, avg) and FR-containing dust particle sizes (dFR, avg) were selected based on the observed values in Table 1.
Figure 6.
Number of flame-retardant-containing particles (KFR) in 1mg of 100 ppm FR dust as a function of average FR species weight percent within these FR-containing dust particles, (wFR, avg), for three different average FR-containing dust particle sizes (dFR, avg).
3.2.3 Dust-averaged Br concentrations
Table 2 presents a comparison between the PBDE congener concentrations in the NCCLS dust samples as measured by GC-MS (Whitehead et al., 2013) and the corresponding SEM/EDS, dust-averaged Br concentrations calculated with Equation 1. The SEM/EDS analysis sensitivity ranged from 8–23 ppm Br for the six NCCLS dust samples. The number of Br-containing dust particles detected by SEM/EDS per NCCLS sample ranged from 0–9 particles. The SEM/EDS-measured Br concentrations ranged from 0–73 ppm and correlated most strongly with the GC-MS-measured BDE-209 concentrations, which ranged from 1–91 ppm (rp = 0.66). An obvious outlier in this correlation was Sample 3; when this sample was excluded, the correlation between SEM/EDS Br and GC-MS BDE-209 was rp = 0.98.
Table 2.
Dust-averaged Br concentration by SEM/EDS in NCCLS dust samples. compared to PBDE congener distribution as determined by GC-MS (Whitehead et al, 2010). SEM/EDS results are given in parentheses when below the analysis sensitivity. Pearson correlations (rp) between SEM/EDS and GC-MS results are presented with and without the outlier Sample 3.
| Sample ID | 1 | 2 | 3 | 4 | 5 | 6 | rp (SEM/EDS vs. GC- MS) | rp without Sample 3 |
|---|---|---|---|---|---|---|---|---|
| SEM/EDS (ppm) | ||||||||
| Br | (0) | 73 | 64 | 18 | 31 | (20) | -- | -- |
| Analysis sensitivity | 16 | 12 | 11 | 8 | 23 | 22 | -- | -- |
| GC-MS (ppm) | ||||||||
| BDE-209 | 0.56 | 91 | 3.3 | 5.4 | 31 | 8.7 | 0.66 | 0.98 |
| BDE-47 + BDE-99 | 26 | 2.7 | 76 | 120 | 2.1 | 0.71 | -0.07 | -0.33 |
| BDE-47 + BDE-99 + BDE-209 | 27 | 94 | 80 | 130 | 33 | 9.4 | 0.44 | 0.40 |
4. Discussion
4.1 FR Transfer Mechanisms from FR-Treated Materials to Dust
With the exception of two of the source materials (the VCR and van seat PUF), all of the Br regions observed in this work were discrete and presumably added as non-volatile solids. Non-volatile FRs are most likely to be liberated from FR-containing materials via mechanical separation (i.e., weathering and abrasion) and will result in a heterogeneous distribution of FR-containing particles in dust (Webster et al., 2009). The morphology of the loosely attached van seat upholstery particles (Figure 1) suggests an extremely friable (i.e., easily-pulverized) FR source material, as confirmed by the presence of several such particles in the underlying foam of the van seat (Figure 2a). In fact, the morphology of the FR-enriched source particles in Figure 1 appear to be quite similar to dust particles observed by Webster et al. (2009) in the interior of a car, which the authors of that study hypothesized to have originated from abraded car upholstery. Other FR-treated consumer product types, such as rigid plastics with embedded Br regions (e.g., the television case in Table 1, Figure 3), would be expected to be less friable. However, the observed smooth surfaces and angular fractures of the Type C dust particles (Table 1, Figure 4) suggest that cracking and abrasion of plastics is also a plausible source of FR-enriched dusts.
The relatively uniform morphologies of Type A-D dust particles (Table 1, Figure 4) suggest they each originated primarily from a single source material, and were subsequently intermixed with minor amounts of common crustal constituents. As such, these dust particles are hypothesized to have been either relatively invulnerable to further disintegration (non-friable), or newly separated from their source materials. In contrast, the heterogeneous Type E-I dust agglomerates (Table 1) suggest more friable dusts, or longer histories of disintegration and intermixing between FR fragments and other residential dust constituents. The smallest, least-uniform of these dusts appear to contain Sb regions completely disassociated from their original FR elements (Types H and I). Alternatively, it is possible that these Sb particles had non-FR sources, though such sources are relatively rare outside of lead-acid battery and industrial applications (Butterman and Carlin, 2004). These morphologically-derived insights into the relative ages of FR particles could prove useful for retrospective exposure studies in which the historical prevalence of FR-containing dust is desired.
Two Br-containing source materials and all of the Cl- and P-containing source materials exhibited continuous distributions of these elements throughout the material, suggesting that the elements were either a) a constituent of the source matrix material, b) a homogeneously-distributed, solid-phase FR additive with a particle size not resolvable by our SEM/EDS techniques (<0.1 μm) or c) a liquid-phase FR additive. For liquid-phase FR additives, volatilization could be the predominant transfer mechanism, resulting in a homogeneous spatial distribution of FRs in dust.
4.2 Spatial Distribution of FR Particles and Human Exposure
Table 1 illustrates that for many of the analyzed dust samples, a large portion of the FR load was concentrated in a very small number of heavily contaminated FR particles. As demonstrated in Figure 6, the FR spatial distribution will be most heterogeneous when the FR-containing particles are relatively large, or have relatively high wFR, avg. Values of wFR, avg as high as 31% were observed in environmental dusts (Table 1). The chemical formula for pure BDE-209 implies an upper bound for FR materials of wBr, avg = 83%. The lowest measured FR source material concentrations in Table 1 were on the order of 1%, but FR-containing environmental dust particles could be expected to possess much lower concentrations, especially if they resulted from vapor-phase re-deposition. The wide range of possible single-particle FR concentrations can lead to very different exposure situations for dusts with the same bulk dust FR concentration values.
For example, Figure 6 shows that if, on average, each FR containing dust particle is 50% FR by weight and has a 50μm diameter, each 1-mg portion of “100 ppm FR” dust would contain only one FR-containing particle. In this scenario, ingestion of the FR-containing particle would represent an instantaneous exposure to 50%, or 500,000 ppm of FR, four orders of magnitude higher than the average exposure based on the bulk dust FR concentration. Depending on the individual’s kinetics of uptake and cellular repair for a given FR compound, this particle may represent an acute exposure in addition to the chronic exposure.
In contrast, Figure 6 also demonstrates that if, on average, each FR-containing dust particle is 1% FR by weight and has a 20μm diameter, each 1-mg portion of “100 ppm FR” dust would contain ≫ 103 particles. These thousands of particles potentially represent a far smaller instantaneous dosage to the individual, depending on the duration of the exposure.
In this way, Equation 3 effectively allows one to predict the spatial distribution of FR-containing particles in dust. In situations where abrasion from a known or suspected source is expected to be the dominant FR transfer mechanism, an upper bound for wFR in Equation 3 would be the concentration of FR in the source material.
4.3 Spatial Distribution of FR Particles and GC-MS Measurement Variability
All Br species detected by SEM/EDS in the NCCLS environmental dusts appeared within relatively few, high-concentration particles, heterogeneously distributed in the dust (<10 particles / mg dust). With the exception of dust Sample 3 (Table 2), the samples with the highest SEM/EDS-measured Br were those in which Whitehead et al (2013) measured the highest BDE-209 concentrations. If these rare, concentrated-Br particles did consist of BDE-209 (as was shown to be the case for the Type C dust particle in Figure 5), the resulting spatial heterogeneity could explain the greater observed variability of GC-MS BDE-209 concentrations in replicate dust samples compared to other, more volatile PBDEs.
We hypothesize that rare, high-concentration Br dust particles create variability in GC-MS results. Poisson statistics predicts that the variability in the mean number of FR particles, KFR, avg, contained in a dust subsample extracted for a given GC-MS injection is KFR, avg 1/2. If KFR averaged 10 FR particles per subsample for a given dust, the expected coefficient of variation in repeated subsamples would be (KFR, avg 1/2/ KFR, avg) = 32%. In contrast, a more homogeneous dust with KFR, avg = 1000 would exhibit only 3.2% variability. Thus, depending on the spatial distribution of FR particles, the measurement variability can be expected to range substantially. This phenomenon may be relevant to household dust studies in which proximity to FR sources did not sufficiently explain the observed spatial and temporal variability (Muenhor and Harrad, 2012).
The explanation for the anomalously high number of distinct Br particles detected in Sample 3 is unclear. 7 of the 9 Br-containing particles detected in this sample were found together in just one SEM subsample, and it is possible that all7 broke apart from the same original particle (all had very similar Type C morphologies.) If true, this sample would be an illustration of the extreme spatial and measurement variability that is possible from a single, large FR dust particle.
4.4 Advantages and Limitations of Technique
Screening with the SEM/EDS BSE detector proved to be a convenient and rapid analysis technique amenable to minimal sample preparation. The SEM’s high depth of field and wide magnification range enabled analyses of large dust particles and source materials on the order of 1 mm in size, but also capable of detecting FR sub-regions down to 0.1 μm. The BSE detector enabled rapid visual detection of low concentrations (<100 ppm) of heavy atoms such as Br and metal synergists in FR materials. In general, SEM/EDS is most useful for measuring dusts with discrete, solid-phase FR (e.g., from BDE-209 applications). Subsequent analysis by RMS enables molecular identification of matrix materials and FR-associated elements detected by SEM/EDS, information which can be used for more accurate assessments of potential FR sources and health effects.
The SEM/EDS technique currently possesses several limitations. The detection of liquid-phase or otherwise continuously-distributed FR compounds (e.g., Penta-BDE) in dusts is challenging, since no ‘hot spots’ would be visible in the BSE screening. In this case, such a FR would only likely be detected if it was present in a mechanically-dislodged, morphologically recognizable source fragment such as porous foam. Volatilization of liquid-phase FR from source materials and subsequent reabsorption onto dust surfaces would typically result in very low concentrations (ppm or ppb), which are below the single-particle detection limit of the EDS system. In the NCCLS dusts, no particles were detected with continuous distributions of Br throughout. Continuously-distributed, chlorinated FR compounds may be particularly difficult to recognize in environmental dusts with SEM/EDS BSE, both due to their relatively low atomic number, and due to the common occurrence of Cl in other household compounds and natural sources. The co-presence of solid-phase metal synergists can aid FR detection, though metal synergists are not employed in all FR materials, and would not be transferred to the dust if the transfer mechanism is thermal rather than mechanical.
Because the SEM/EDS elemental concentrations presented in this work exhibited variability on the order of 1–10% within a given type of FR-treated material or FR dust particle, they should be considered as semi-quantitative only. For the lower-concentration dusts, this variability represented a large relative uncertainty, on the same order of magnitude as the average FR weight percents. The largest uncertainties in this study were caused by EDS peak coincidence when both Al and Br were present. Future work will develop a range of in-house EDS standards to better calibrate the EDS detector for Al- and Br-bearing particles. Nevertheless, for the purposes of this study, an accuracy of 5% is adequate for comparing the relative FR levels present in various types of source materials and FR-containing dusts.
5. Conclusion
The FR particle morphologies, elemental distributions and concentrations measured in this work all represent fingerprints which can be used to help identify the sources of FR-containing particles in environmental dust. The observed source material morphologies suggested varying transfer mechanisms and subsequent spatial distribution of FR particles. The range of observed FR dust morphologies and degree of intermixing with non-FR dust are hypothesized to be due to differing degrees of source material friability or different dust particle ages.
The micro-spectroscopic analyses presented here revealed the localized presence of high-concentration FR particles within dust samples, suggesting the potential for acute human exposure to these chemicals. This information is not directly available in typical bulk analyses of dust samples by GC-MS but may be responsible for some of the observed variability in GC-MS concentration measurements. In addition, heterogeneously-distributed, high-concentration FR particles may explain the spatial and temporal FR concentration variability observed within some residences. Therefore, the spatial distribution of FR particles should be considered when sampling and analyzing environmental dusts.
Future work will continue to build libraries of known FR source materials and FR-containing environmental dusts. Uncertainties in the semi-quantitation of FR in individual particles and total dust samples by SEM/EDS will be addressed further, especially for samples with extremely rare, high concentration particles.
Highlights.
FR characterized with scanning electron microscopy and Raman micro-spectroscopy.
7 consumer products and 24 FR-containing dust particles were characterized.
FR particle morphology implied mixing state and source-to-dust transfer mechanisms.
Observed FR were distributed in rare, highly concentrated particles in dust.
Heterogeneous FR dusts can cause high transient exposures and GC-MS variability.
Acknowledgments
Dust collection in the Northern California Childhood Leukemia Study (NCCLS) was supported by the National Institute of Environmental Health Sciences grant number R01ES015899). The authors thank Sandy McNeel and Rupali Das from the CDPH Environmental Health Investigations Branch and Leslie Israel from UC Irvine for providing the firehouse dust sample.
Footnotes
Note: The findings and conclusions in this report are those of the authors) and do not necessarily represent the views of the California Department of Public Health and the National Institutes of Health.
Publisher's Disclaimer: This is a PDF file of an unedited manuscript that has been accepted for publication. As a service to our customers we are providing this early version of the manuscript. The manuscript will undergo copyediting, typesetting, and review of the resulting proof before it is published in its final citable form. Please note that during the production process errors may be discovered which could affect the content, and all legal disclaimers that apply to the journal pertain.
Contributor Information
JEFF WAGNER, Email: Jeff.Wagner@cdph.ca.gov.
SUTAPA GHOSAL, Email: Sutapa.Ghosal@cdph.ca.gov.
TODD WHITEHEAD, Email: toddpwhitehead@berkeley.edu.
CATHERINE METAYER, Email: cmetayer@berkeley.edu.
References
- Alaee M, Arias P, Sjodin A, Bergman A. An overview of commercially used brominated FRs, their applications, their use patterns in different countries/regions and possible modes of release. Environ Int. 2003;29:683–9. doi: 10.1016/S0160-4120(03)00121-1. [DOI] [PubMed] [Google Scholar]
- Allen JG, McClean MD, Stapleton HM, Webster TF. Linking PBDEs in house dust to consumer products using X-ray fluorescence. Environ Sci Technol. 2008;42:4222–8. doi: 10.1021/es702964a. [DOI] [PubMed] [Google Scholar]
- Butterman W, Carlin J. US Geological Survey Open-file Report 03-0319. 2004. Mineral Commodity Profiles: Antimony. [Google Scholar]
- Casuccio G, Janocko P, Lee R, Kelly J, Dattner S, Mgebroff J. The Use of Computer Controlled Scanning Electron Microscopy in Environmental Studies. Journal of the Air Pollution Control Association. 1983;33:937–943. [Google Scholar]
- Choel M, Deboudt K, Flament P, Lecornet G, Perdrix E, Sobanska S. Fast evolution of tropospheric Pb- and Zn-rich particles in the vicinity of a lead smelter. Atmos Environ. 2006;40:4439–49. [Google Scholar]
- Covaci A, Harrad S, Abdallah MA, Ali N, Law RJ, Herzke D, de Wit C. Novel brominated FRs: A review of their analysis, environmental fate and behaviour. Environ Int. 2011;37:532–56. doi: 10.1016/j.envint.2010.11.007. [DOI] [PubMed] [Google Scholar]
- Das R, Israel L. Firefighter Occupational Exposures: Advancing Biomonitoring. Presented at ICOH Congress; 2012; Cancun. 2012. [Google Scholar]
- European Flame Retardants Association. [accessed April 2012];Keeping Fire in Check: An Introduction to Flame Retardants Used in Electrical and Electronic Devices. 2011 http://www.cefic-efra.com/images/stories/IMG-BROCHURE-2.4/EFRA_E&E_brochure_oct2011_v04.pdf.
- Friden UE, McLachlan MS, Berger U. Chlorinated paraffins in indoor air and dust: Concentrations, congener patterns, and human exposure. Environ Int. 2011;37:1169–74. doi: 10.1016/j.envint.2011.04.002. [DOI] [PubMed] [Google Scholar]
- Frost R, Stefaniak E, Alsecz A, Mathe Z, Sajo I, Torok S, Worobiec A, vanGrieken R. The combined application of SEM/EDX and micro-Raman spectroscopy to analyse uranium minerals from a former uranium mine. Journal of Hazardous Materials. 2009;168:416–423. doi: 10.1016/j.jhazmat.2009.02.057. [DOI] [PubMed] [Google Scholar]
- Ghosal S, Wagner J. Correlated Raman Micro-spectroscopy and Scanning Electron Microscopy Analyses of Flame Retardants in Environmental Samples: A Micro-Analytical Tool for Probing Chemical Composition, Origin and Spatial Distribution. Analyst. 2013 doi: 10.1039/c3an00501a. accepted. [DOI] [PubMed] [Google Scholar]
- Godoi R, Potgieter-Vermaak S, DeHoog J, Kaegi R, Van Grieken R. Substrate selection for optimum qualitative and quantitative single atmospheric particles analysis using nano-manipulation, sequential thin-window electron probe X-ray microanalysis and micro-Raman spectrometry. Spectrochimica Acta Part B. 2006;61:375–388. [Google Scholar]
- Harrad S, de Wit CA, Abdallah MA, Bergh C, Bjorklund JA, Covaci A, Darnerud P, de Boer J, Diamond M, Huber S, Leonards P, Mandalakis M, Östman C, Haug L, Thomsen C, Webster T. Indoor contamination with hexabromocyclododecanes, polybrominated diphenyl ethers, and perfluoroalkyl compounds: An important exposure pathway for people? Environ Sci Technol. 2010;44:3221–31. doi: 10.1021/es903476t. [DOI] [PubMed] [Google Scholar]
- Hindersinn R. Historical aspects of polymer fire retardance. In: Nelson G, editor. Fire and polymers hazard identification and prevention. 1990. [Google Scholar]
- Holbrook R, Davis J, Scott K, Szakal C. Detection and speciation of brominated FRs in high-impact polystyrene HIPS) polymers. J Microsc. 2012;246:143–52. doi: 10.1111/j.1365-2818.2012.03602.x. [DOI] [PubMed] [Google Scholar]
- Lioy P, Freeman N, Millette J. Dust: a metric for use in residential and building exposure assessment and source characterization. Environ Health Perspect. 2002;110:969–983. doi: 10.1289/ehp.02110969. [DOI] [PMC free article] [PubMed] [Google Scholar]
- Muenhor D, Harrad S. Within-room and within-building temporal and spatial variations in concentrations of polybrominated diphenyl ethers (PBDEs) in indoor dust. Environment International. 2012;47:23–27. doi: 10.1016/j.envint.2012.06.001. [DOI] [PubMed] [Google Scholar]
- Nelson M, Zugates C, Treado P, Casuccio G, Exline D, Schlaegle S. Combining Raman Chemical Imaging and Scanning Electron Microscopy to Characterize Ambient Fine Particulate Matter. Aerosol Science and Technology. 2001;34:108–117. [Google Scholar]
- Organisation for Economic Co-Operation and Development. OECD Environment Monograph Series No. 102, ed. Paris: 1994. Risk reduction monograph no. 3: Selected brominated FRs, background and national experience with reducing risk. [Google Scholar]
- Potgieter-Vermaak S, Worobiec A, Darchuk L, Van Grieken R. Micro-Raman Spectroscopy for the Analysis of Environmental Particles. Fundam Appl Aerosol Spectrosc. 2011:193–208. [Google Scholar]
- Shaw SD, Blum A, Weber R, Kannan K, Rich D, Lucas D, et al. Halogenated FRs: Do the fire safety benefits justify the risks? Rev Environ Health. 2010;25:261–305. doi: 10.1515/reveh.2010.25.4.261. [DOI] [PubMed] [Google Scholar]
- Stefaniak E, Buczynska A, Novakovic V, Kuduk R, Van Grieken R. Determination of chemical composition of individual airborne particles by SEM/EDX and micro-Raman spectrometry: A review. J Phys: Conf Ser. 2009;162:012019. [Google Scholar]
- van der Veen I, de Boer J. Phosphorus FRs: Properties, production, environmental occurrence, toxicity and analysis. Chemosphere. 2012;10:1119–53. doi: 10.1016/j.chemosphere.2012.03.067. [DOI] [PubMed] [Google Scholar]
- van Esch GJ. FRs: A general introduction. Geneva, Switzerland: World Health Organization; 1997. Report No.: Environmental Health Criteria 192. [Google Scholar]
- Wagner J, Leith D. Passive aerosol sampler. Part I: Principle of operation. Aerosol Sci Technol. 2001;34:186–192. [Google Scholar]
- Wagner J, Naik-Patel K, Wall S, Harnly M. Measurement of ambient particulate matter concentrations and particle types near agricultural burns using electron microscopy and passive samplers. Atmospheric Environment. 2012;54:260–271. [Google Scholar]
- Wang J, Tian M, Chen SJ, Zheng J, Luo XJ, An TC, Mai B. Dechlorane plus in house dust from E-waste recycling and urban areas in South China: Sources, degradation, and human exposure. Environ Toxicol Chem. 2011;30:1965–72. doi: 10.1002/etc.587. [DOI] [PubMed] [Google Scholar]
- Webster T, Harrad S, Millette J, Holbrook R, Davis J, Stapleton H, Allen J, McClean M, Ibarra C, Abdallah M, Covac A. Identifying transfer mechanisms and sources of decabromodiphenyl ether BDE 209) in indoor environments using environmental forensic microscopy. Environ Sci Technol. 2009 May 1;43(9):3067–3072. doi: 10.1021/es803139w. [DOI] [PMC free article] [PubMed] [Google Scholar]
- Whitehead T, Metayer C, Buffler P, Rappaport SM. Estimating exposures to indoor contaminants using residential dust. J Expo Sci Environ Epidemiol. 2011;21(6):549–64. doi: 10.1038/jes.2011.11. [DOI] [PubMed] [Google Scholar]
- Whitehead T, Brown F, Metayer C, Park J, Does M, Petreas M, Buffler P, Rappaport S. Polybrominated Diphenyl Ethers in Residential Dust: Sources of Variability. Environment International. 2013;57–58:11–24. doi: 10.1016/j.envint.2013.03.003. [DOI] [PMC free article] [PubMed] [Google Scholar]
- Willis R, Blanchard F, Conner T. Guidelines for the Application of SEM/EDX Analytical Techniques to Particulate Matter Samples. National Exposure Research Laboratory, Office of Research and Development, U.S. Environmental Protection Agency; Research Triangle Park, NC: 2002. EPA # 600/R-02/070. [Google Scholar]
- Worobiec A, Stefaniak E, Kontozova V, Samek L, Karaszkiewicz P, VanMeel K, Van Grieken R. Characterization of individual atmospheric particles within the Royal Museum of the Wawel Castle in Cracow, Poland. e-Preservation Science. 2006;3:63–69. [Google Scholar]
- Worobiec A, Stefaniak E, Kiro S, Oprya M, Bekshaev A, Spolnik Z, Potgieter-Vermaak S, Ennan A, Van Grieken R. Comprehensive microanalytical study of welding aerosols with x-ray and Raman based methods. X-Ray Spectrom. 2007;36:328–335. [Google Scholar]
- Zhu J, Feng YL, Shoeib M. Detection of dechlorane plus in residential indoor dust in the city of Ottawa, Canada. Environ Sci Technol. 2007;41:7694–8. doi: 10.1021/es071716y. [DOI] [PubMed] [Google Scholar]


