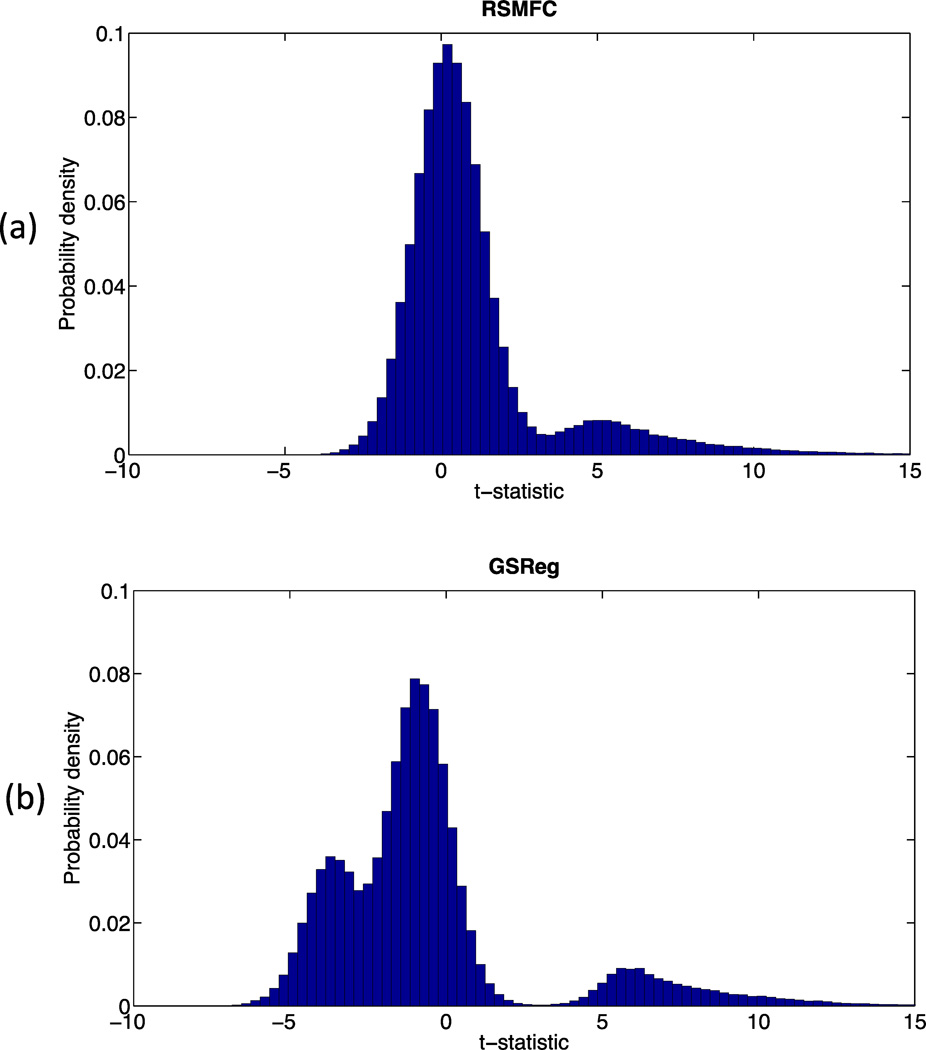
Figure 6. Comparison of normalized histograms of group-level whole-brain t-statistics on the simulated dataset.
Distribution of voxel-wise t-statistics with (a) RSMFC and (b) GSReg. Unlike GSReg in which a major portion of the distribution had negative values, RSMFC has a distribution centered at zero. This indicates successful suppression of the added global artifacts and no significant negative correlations. RSMFC = random subspace method functional connectivity. GSReg = global signal regression method.

