Abstract
Copy number variation (CNV) contributes to disease and has restructured the genomes of great apes. The diversity and rate of this process, however, have not been extensively explored among great ape lineages. We analyzed 97 deeply sequenced great ape and human genomes and estimate 16% (469 Mb) of the hominid genome has been affected by recent CNV. We identify a comprehensive set of fixed gene deletions (n = 340) and duplications (n = 405) as well as >13.5 Mb of sequence that has been specifically lost on the human lineage. We compared the diversity and rates of copy number and single nucleotide variation across the hominid phylogeny. We find that CNV diversity partially correlates with single nucleotide diversity (r2 = 0.5) and recapitulates the phylogeny of apes with few exceptions. Duplications significantly outpace deletions (2.8-fold). The load of segregating duplications remains significantly higher in bonobos, Western chimpanzees, and Sumatran orangutans—populations that have experienced recent genetic bottlenecks (P = 0.0014, 0.02, and 0.0088, respectively). The rate of fixed deletion has been more clocklike with the exception of the chimpanzee lineage, where we observe a twofold increase in the chimpanzee–bonobo ancestor (P = 4.79 × 10⁻⁹) and increased deletion load among Western chimpanzees (P = 0.002). The latter includes the first genomic disorder in a chimpanzee with features resembling Smith-Magenis syndrome mediated by a chimpanzee-specific increase in segmental duplication complexity. We hypothesize that demographic effects, such as bottlenecks, have contributed to larger and more gene-rich segments being deleted in the chimpanzee lineage and that this effect, more generally, may account for episodic bursts in CNV during hominid evolution.
Sequence and assembly of great ape reference genomes have consistently revealed that copy number variation (CNV) affects more base pairs than single nucleotide variation (SNV) (Cheng et al. 2005; The Chimpanzee Sequencing and Analysis Consortium 2005; Locke et al. 2011). Segmental duplications, in particular, have disproportionately affected the African great ape (human, chimpanzee, and gorilla) lineages, where they appear to have accumulated at an accelerated rate (Cheng et al. 2005; Marques-Bonet et al. 2009). This has led to speculation that differences in fixation and copy number polymorphism may have contributed to the phenotypic “plasticity” and species-specific differences between humans and great apes (Olson 1999; Varki et al. 2008). While there is some evidence that fixed deletions and duplications contribute to morphological differences between humans and great apes (McLean et al. 2011; Charrier et al. 2012; Dennis et al. 2012), a comprehensive assessment of these differences at the level of the genome has not yet been performed. Previous studies of CNV have been predominated by array comparative genomic hybridization (CGH) experiments (Fortna et al. 2004; Perry et al. 2006; Dumas et al. 2007; Gazave et al. 2011; Locke et al. 2011), which provide limited size resolution, are imprecise in absolute copy number differences, and are biased by probes derived from the human reference genome. Comparisons of reference genomes have been complicated by assessments of a single individual and distinguishing CNVs from assembly errors (The Chimpanzee Sequencing and Analysis Consortium 2005; Locke et al. 2011; Ventura et al. 2011; Prüfer et al. 2012). Here, we compare the evolution and diversity of deletions, duplications, and SNVs in 97 great ape individuals sequenced to high coverage (median ∼25×) (Prado-Martinez et al. 2013). The set includes multiple individuals from the four great ape genera, including Bornean and Sumatran orangutans, each of the four recognized chimpanzee subspecies, bonobos, and both Eastern and Western gorillas, in addition to 10 diverse humans and a high-coverage archaic Denisovan individual. This data set provides unprecedented genome-wide resolution to interrogate multiple forms of genetic variation and a unique opportunity to directly compare mutational processes and patterns of diversity in great apes.
Results
Patterns and diversity
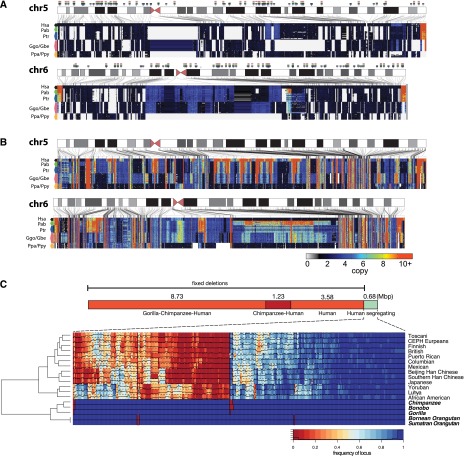
We constructed maps of deletions and segmental duplications by measuring sequence read-depth in 500-bp unmasked windows across the genome (Sudmant et al. 2010). We used a scale-space filtering algorithm to identify deletion and duplication breakpoints (Fig. 1A,B; Supplemental Section 3). In addition to the breakpoints of deletions and duplications, read-depth genotyping allows us to determine the absolute copy number of loci at an individual genome level. We partitioned CNVs into three categories: fixed (i.e., the deletion or duplication was seen as a homozygous event in most individuals), copy number polymorphic, and private (observed only once) (see Supplemental Material for definitions). Fixed lineage-specific (events occurring on edges between nodes in the species tree) segmental duplications are nonrandomly distributed (P < 0.0002, permutation test) with >20% mapping within 5 kb of shared ancestral duplications (Supplemental Section 7)—a phenomenon we previously described as duplication shadowing (Cheng et al. 2005; Marques-Bonet et al. 2009). Deletions, in contrast, are randomly distributed across great ape genomes with respect to one another (P > 0.2, permutation test).
Figure 1.
Duplication and deletion landscape. (A) Ideograms of human autosomes 5 and 6 overlaid with copy number heat maps of the deletion landscape of great apes across seven species and 11 distinct populations. Each row represents one of 97 individuals sorted by species; each column shows the estimated copy number in each of these individuals for deleted loci in 500-bp unmasked windows. Arrows above the chromosome ideogram indicate deletions identified along the lineages leading to the human species, the African great ape, chimpanzee–human, and human lineages, respectively. (B) Ideograms of human autosomes 5 and 6 overlaid with copy number heat maps of the duplication landscape of great apes. (C) Breakdown of the number of base pairs lost along the lineage leading to humans identified by screening sequence absent from the human reference genome yet present in the orangutan, gorilla, or chimpanzee reference genomes against the 97 great apes sequenced in this study. A total of 13.54 Mb has been lost in these lineages since the divergence of African great apes and orangutans. We find that an additional 680 kb (316 loci) of sequence absent from the human reference genome (4.8% of the total) is fixed in all nonhuman great apes and segregating in humans. For these loci a hierarchically clustered heat map is shown. Colors indicate the frequency of sequences absent in the human reference genome assessed in 624 diverse individuals from 13 different populations sequenced to low coverage by the 1000 Genomes Project and found to be segregating with ≥5% frequency in at least one population. The hierarchical clustering recapitulates all the relationships between the individual human populations and the different great ape species assessed in this study. We identify 53.8 kb of sequence segregating exclusively in African populations compared to only 1.4 kb of sequence segregating specifically in Europeans.
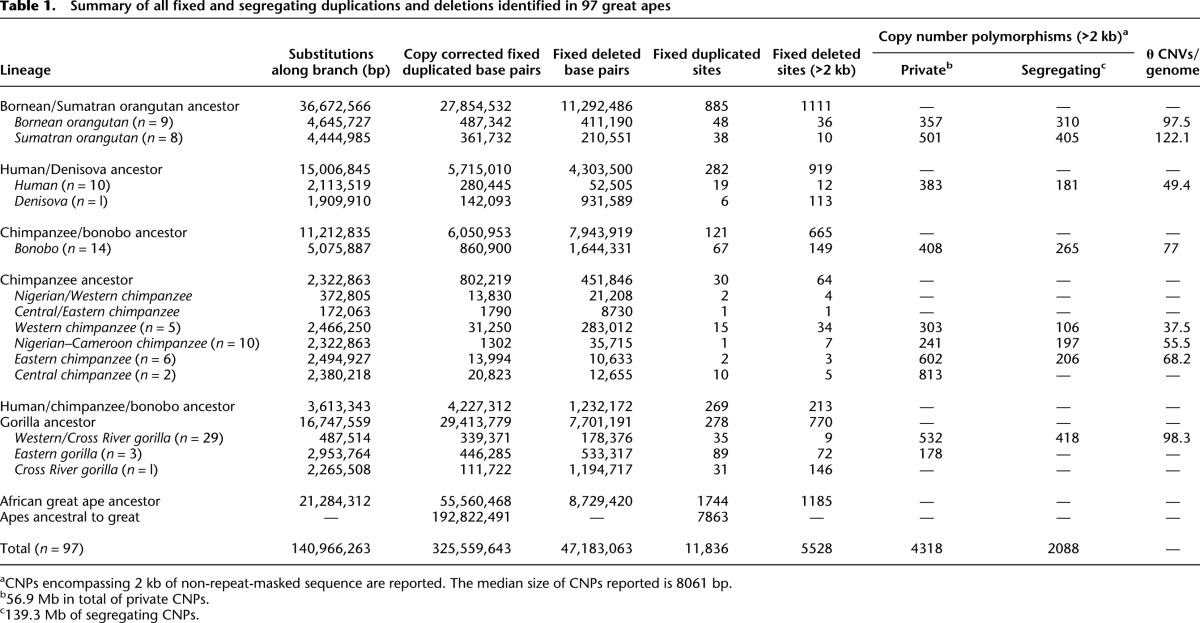
We parsimoniously assigned fixed events to ancestral branches based on comparisons between populations. In total, we identify 469 Mb of CNVs (Table 1). This set includes 11,836 fixed duplicated loci (325 Mb; median length of 3778 bp), 5528 fixed deletions (47 Mb; median size = 4227 bp), and 6406 private and segregating copy number variants (96.2 Mb) (Table 1; Supplemental Section 3). To assess the accuracy of these calls, we performed 104 fluorescent in situ hybridization (FISH) experiments confirming 102 of the loci tested (98.1%). We also designed three custom duplication and deletion array comparative genomic hybridization (CGH) microarrays confirming 85.1% of CNPs (1294/1520 of events >2 kb), 96.9% (3660/3776) of fixed duplications, and 98.6% (3966/4021) of fixed deletions (Supplemental Section 4). As part of our assessment of deletions, we also screened sequence absent from the human reference genome yet present in one or more of the great ape reference genomes (Supplemental Section 6). Since these “missing sequences” may represent artifacts or polymorphisms, we additionally estimated the frequency of each segment in 624 diverse humans from 13 different populations (The 1000 Genomes Project Consortium 2012). We assigned 13.54 Mb of human deletions unambiguously to specific time intervals during the evolution of our species. Notably, ∼5% of these deleted sequences are still segregating in the human population, consistent with known population relationships among extant humans (Fig. 1C).
Table 1.
Summary of all fixed and segregating duplications and deletions identified in 97 great apes
Since fixed deletions are less likely than duplications to be subjected to recurrent mutation events, we assessed whether they might serve as reliable genetic markers for phylogenetic reconstruction of ape populations. The resulting neighbor-joining tree of deletion genotypes (Fig. 2A) accurately recapitulates the ape phylogeny, including separation of Bornean and Sumatran orangutans, Eastern and Western gorillas, and bonobos and chimpanzees with high confidence. In contrast, however, to trees built from mitochondrial haplotypes or autosomal single nucleotide polymorphism (SNP) data from the same population (Prado-Martinez et al. 2013), Central chimpanzees emerge as an outgroup to the other chimpanzee subspecies (96% support). Interestingly, we observed a slight distortion toward increased branch length for the chimpanzee–bonobo ancestral lineage, which becomes more pronounced for larger deletions (see the section below, Rates and CNV Load) (Supplemental Section 9). Principal component analysis (PCA) of segregating structural variants also captures the subspecies relationships in addition to interpopulation diversity (Fig. 2B). Our analysis shows that estimates of SNP diversity and segregating copy number variants (as measured by Watterson's θ) are correlated (r2 = 0.5 Pearson, P = 0.02).
Figure 2.
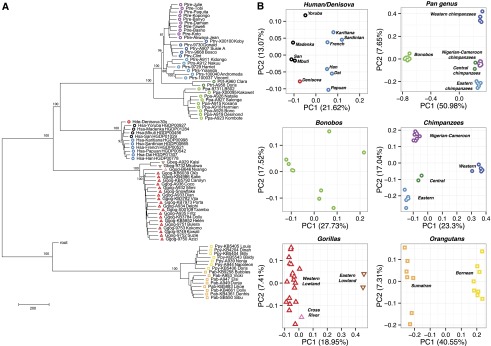
Hominid deletion phylogeny. (A) Neighbor-joining tree constructed from pairwise edit distance of genotypes for fixed and segregating deletions >5 kb. Branch length confidence estimates were generated by repeatedly subsampling 50% of the variants and regenerating the topology. All species and subspecies relationships are reconstructed with high confidence and are concordant with the topology identified from SNPs with the exception of Central chimpanzees, which form an outgroup to the other chimpanzee subspecies as a result of their increased diversity. SNP-based trees cluster Central and Eastern chimpanzees on a single clade. Among chimpanzees, the three individuals Yolanda, Andromeda, and Vincent, the Eastern-most individuals assessed in this study from Gombe National Reserve in Tanzania, cluster together with strong support. Additionally, the individuals Tobi and Julie, a distinct subpopulation of Nigerian chimpanzees by SNP analysis, cluster together. Eastern lowland gorillas form an outgroup to the gorilla clade and the Cross River gorilla clusters as an outgroup to Western lowland gorillas. The archaic Denisova individual clusters as an outgroup to all humans with 97% support. (B) PCA of segregating deletion genotypes recapitulates intrapopulation relationships and additionally the relative diversity within the populations assessed.
Genes
The availability of multiple sequenced genomes allows us to generate a comprehensive list of fixed deletions and duplications that disrupt genes along each branch of the ape lineage (see Supplemental Section 5). We identified 407 lineage-specific gene duplications and 340 deletions with complete or partial exon loss (Fig. 3A–C) with an excess of gene duplication events in the African great ape and chimpanzee–human ancestor. Lineage-specific duplications include a chimpanzee expansion of PRDM7, a high-identity paralog of PRDM9, in common chimpanzees (10–20 copies) and bonobos (35–40 copies) that is stratified among chimpanzee populations; a 75-kb gorilla-specific expansion of C1QTNF and AMACR—genes important in brain and skeletal development; and 33 genes duplicated specifically in human since divergence from chimpanzee. This includes two genes that appear to have been duplicated, or to have increased in frequency, in the human lineage after the divergence from Denisova, ∼700 thousand years ago (kya) (Meyer et al. 2012), with the caveat that only a single Denisovan individual was assessed. These potential Homo sapiens–specific genes include BOLA2, which resides just inside the critical region of the 16p11.2 locus, the deletion of which results in developmental delay, intellectual disability, and features of autism (Kumar et al. 2008; Weiss et al. 2008).
Figure 3.
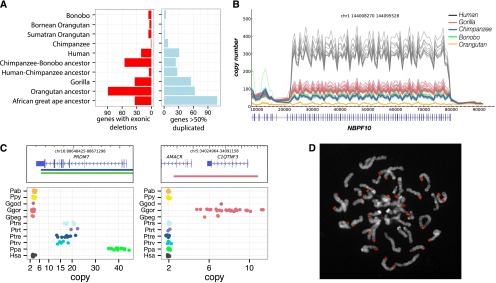
Genic variation. (A) Summary of the number of genes with exonic deletions and genes duplicated in each of the lineages assessed in this study. We identify 340 genes lost throughout the great ape lineage. While orangutans show the highest number of gene-exon-loss events (89), strikingly, the second highest number of gene-exon-loss events was in the chimpanzee–bonobo ancestral lineage, where 55 were lost. (B) A line plot of the copy number over the DUF1220 domain of NBPF10. This domain has expanded specifically in the African great ape lineage with human exhibiting ∼300 copies compared to 50–100 in chimpanzee, bonobo, and gorilla. (C) Lineage-specific great ape duplication events encompassing genes. Gene models are drawn with the duplication breakpoints shown below colored by lineage and dot-plots of the copy number in all individuals assessed in this study. PRDM7 is a close paralog of PRDM9, the binding of which associates with recombination hotspots in humans. We find that PRDM7 is specifically duplicated in the Pan genus and highly stratified; Nigerian–Cameroon chimpanzees have 10–15 copies, while Eastern and Central chimpanzees have 16–20. Bonobos exhibit 30–40 copies of the gene. FISH assays demonstrate the extra copies to be the result of subtelomeric duplicative transposition (D). AMACR and C1QTNF3 are also specifically duplicated in gorillas. Mutations in AMACR have been shown to result in adult-onset neurological disorders (Ferdinandusse et al. 2000), and C1QTNF plays a key role in skeletal development, inducing increased growth of murine mesenchymal cells with overexpression (Maeda et al. 2001).
Among the 340 exonic gene-loss events, orangutans show the highest number (90), commensurate with their divergence from African great apes ∼16 million years ago (mya). Strikingly, the second highest number of gene-loss events occurs in the chimpanzee–bonobo ancestral lineage, where 57 genes exhibit exonic deletions. As expected, we find a massive enrichment for olfaction genes (96/340) in addition to fixed deletions of immunity (IL36, IL37 in chimp; CCL26 in gorilla), drug detoxification (CYP3A43 in Denisova; CYP2C18 in humans and chimps), and sperm surface membrane genes (ADAM2 in gorilla; ADAM3A in gorilla and Pan genus). Some genes appear to have undergone both lineage-specific duplication and loss. Of note is the carboxyl-esterase gene family (CES1, 2, 3), which appears to have expanded independently in all great ape lineages with the exception of human, where it remains diploid or alternatively has been subjected to deletion.
We were also interested in genes that were lost in the human lineage and therefore absent from the human genome, since these have been hypothesized to contribute disproportionately to the evolution of human adaptive traits (Olson 1999). We, thus, analyzed the 13.54 Mb of human fixed deletions (see above) for the presence of open reading frames (ORFs) where there was also support for a multi-exon spliced transcript from RNA-seq data from multiple nonhuman primate tissues (Brawand et al. 2011; Supplemental Section 6). By this definition, we identified 86 putative gene losses along the branches leading to the human lineage—40 since divergence from chimpanzee. A search of these ORFs against the RefSeq protein database yielded not only previously annotated gene-loss events, such as the human-specific SIGLEC13 (Wang et al. 2012) and CLECM4 (Ortiz et al. 2008) deletions, but 42 previously unannotated or only predicted protein-coding genes with homology with other genes, 28 of which intersect highly conserved elements (HCEs) (Siepel et al. 2005). In total we identified 180 kb of highly conserved sequence within these fixed deletions, a marked depletion compared to the 3%–8% of the human reference genome encompassed by HCEs. However, 18% and 12% of regions were located within introns or within 10 kb upstream of or downstream from annotated genes, respectively, suggesting that some of these loci may have a potential regulatory impact as has been previously suggested (McLean et al. 2011).
Rates and CNV load
Comparing deletions and duplications among different great ape lineages (>2 kb), we find that the number of base pairs added by duplication significantly exceeds that of deletions by a factor of 2.8, although this ratio varies considerably depending on the specific lineage (Table 1). In this analysis, we considered only those base pairs added by new duplication excluding the ancestral locus. Overall, we find that the contribution of fixed base pairs by deletion and duplication is ∼1.4-fold greater than that of single-base-pair substitutions. We estimated rates of duplication and deletion throughout great ape evolution by normalizing the number of fixed base pairs that were lost or gained as a function of genetic branch length as well as divergence time (Fig. 4A,B). All analyses were additionally computed in units of the number of events per millions of years (Supplemental Table 9.1) and exhibited the same observed trends. Although there was an acceleration of duplicated base pairs along the ancestral African great ape lineage (P = 9.786 × 10⁻¹²), we predict that the rate of fixation subsequently declined in the ancestral lineage of human and chimpanzee and at a slower rate in the gorilla lineage. Our analysis shows that the rate of duplication in base pairs exceeds by threefold the rate of substitution in the African great ape lineage and is about sevenfold higher than the rate of duplication in the human lineage. This results in a significant excess of fixed gene duplication events occurring at this time point (Fig. 4C) (P = 1.66 × 10⁻²⁰).
Figure 4.
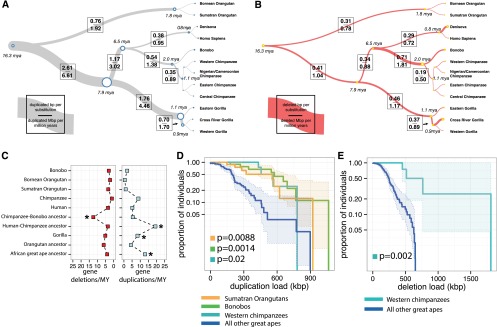
CNV rates and polymorphism. Rates of duplication (A) and deletion accumulation (B) as a function of the number of substitutions along each branch of the great ape phylogeny. Tree branch lengths are scaled proportionally to the number of substitutions, while tree widths are scaled proportionally to the number of duplicated base pairs per substituted base pair. Duplicated base pairs were added ∼2.6-fold the rate of substitution along the African great ape ancestral branch, which rapidly declined in the chimpanzee–human ancestral lineage and more slowly in the gorilla lineage. In contrast, the rate of deletion in the great ape lineage is fairly consistent along all branches (mean of 0.32 deleted base pairs per substitution) with the exception of the chimpanzee–bonobo ancestral lineage, where an approximate twofold increase in the rate of deletion is observed (0.71 deleted base pairs per substitution). (C) The rate of genic deletion events and gene duplication events per million years plotted for each of the lineages assessed in this study. The rate of gene deletion events is significantly higher in the chimpanzee–bonobo ancestor (P = 5.262 × 10⁻⁹). An acceleration in the number of gene duplications is observed in the African great ape ancestor, the human–chimpanzee ancestor, and the ancestral gorilla lineage (P = 1.663 × 10⁻²⁰). (D) A survival curve of the total load of segregating duplications >30 kb in Western chimpanzees, Sumatran orangutans, and bonobos compared to all other great apes shows that these three populations harbor an increased total number of duplicated base pairs (results significant for each individual population and combined). (E) A survival curve for the total load of deletions >30 kb in Western chimpanzees compared to all other great apes shows a significant excess of deletions in this population. Western chimpanzee populations show the lowest diversity of any of the populations assessed in this study and the most fixed deletions of all chimpanzee species assessed.
The corresponding analysis for deletions shows a markedly different pattern, with the rate occurring in a more clocklike manner throughout most of the tree with the notable exception of the ancestral lineage of chimpanzees and bonobos. We observe an approximate twofold increase in the rate of deleted base pairs leading to a distortion specifically along this branch (P = 4.79 × 10⁻⁹). This increase results from an excess of large (>5 kb) chimpanzee–bonobo ancestral deletions, which affect significantly more genes when compared with all other great ape lineages (Fig. 4C) (P = 4.397 × 10⁻⁸). Notably, this excess of deletions corresponds to a predicted collapse in the ancestral chimpanzee–bonobo effective population size (Ne) ∼3 mya (Prado-Martinez et al. 2013; Supplemental Section 5).
Because demography may have played a significant role in the excess rate of deletion in the chimpanzee–bonobo ancestor, we sought to estimate the relative burden of segregating duplications (Fig. 4D) and deletions (Fig. 4E) in each of the great ape populations by comparing CNV and SNP diversity (Methods). Specific populations showed an increased burden of CNV load, both in the total number of base pairs affected and in the number of events (Supplemental Section 10), although humans were not remarkable in this regard as has been hypothesized (Varki et al. 2008). Western chimpanzees, bonobos, and Sumatran orangutans all showed an excess of segregating duplications >30 kb, consistent with an increased duplication burden in these populations (P = 0.02, 0.0014, and 0.0088, respectively) (Supplemental Section 9). Western chimpanzees were the only population to show an additional excess of segregating deletions >30 kb (P = 0.002). All of these populations are predicted to have experienced striking collapses in their effective population sizes during recent evolution (Prado-Martinez et al. 2013; Supplemental Section 5). Western chimpanzees, in particular, exhibit the lowest overall nucleotide diversity and effective population size (8 × 10⁻⁴ Het/bp, Ne = 9800) among all populations assessed. This subspecies also harbors the largest number of fixed deletions (34 events encompassing 276 kb), consistent with a population that experienced a severe bottleneck.
A putative chimpanzee genomic disorder
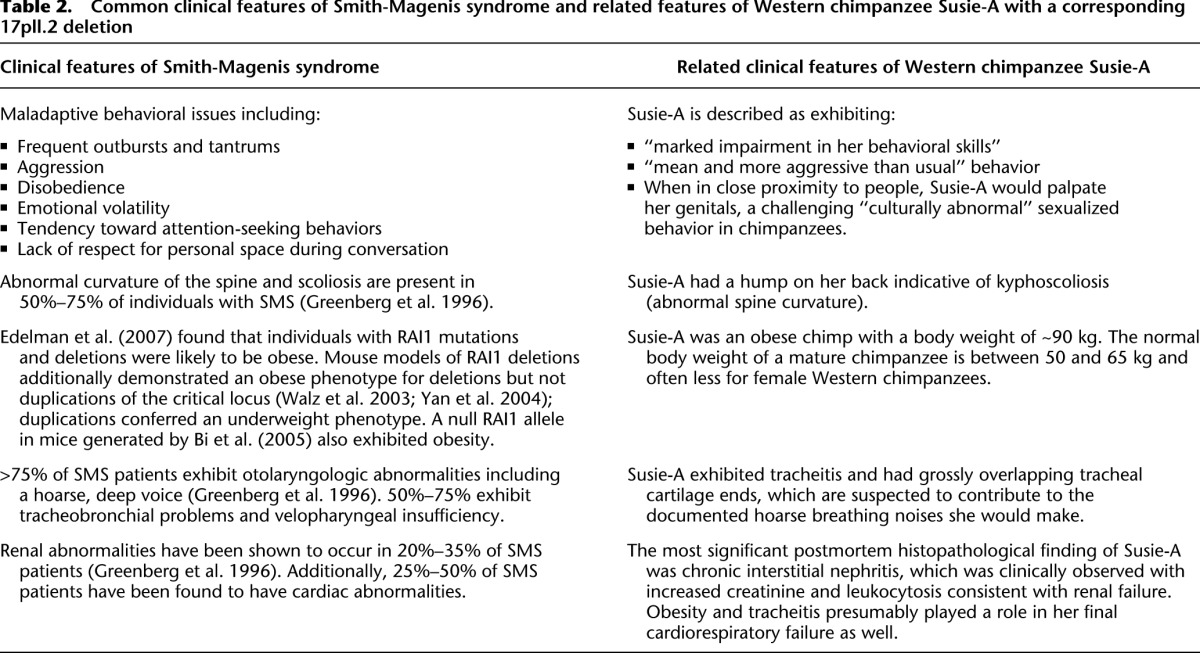
Among the Western chimpanzees assessed, we identified one particularly striking private structural variant—an ∼1.7-Mb microdeletion on 17p11.2 in the individual Susie-A (BPRC) (Fig. 5A). This deletion encompasses 29 genes, including RAI1 (retinoic acid-induced 1). In humans, deletions of this locus cause Smith-Magenis syndrome (SMS). SMS is a rare syndrome with an incidence of 1 in 15,000–25,000 (Elsea and Girirajan 2008), resulting in severe behavioral abnormalities, mental retardation, and developmental delay. The clinical features of this chimpanzee bear striking similarity to many of the phenotypes observed in SMS patients (Table 2), including common SMS maladaptive behaviors such as aggression and disobedience, obesity, a humped back indicative of kyphoscoliosis, renal abnormalities, and velopharyngeal insufficiency (Supplemental Section 10). The chimpanzee deletion is flanked by multiple loci that have undergone expansion in the Pan genus (Fig. 5B). The typical human SMS deletion spans an additional 2 Mb and has breakpoints mapping to different locations and different segmental duplication blocks (Fig. 5C). To resolve the chimpanzee duplication organization, we sequenced to high quality a total of 20 large-insert BAC clones (2.9 Mb, ∼1.73 Mb nonredundant sequence) identifying ∼765 kb of sequence absent from panTro3. We find that these blocks have increased in size and complexity in the chimpanzee lineage with at least an additional 600 kb of duplicated sequence compared to human (Fig. 5D). These results predict that the chimpanzee genome harbors a novel 17p11.2 architecture whose more complex organization predisposes to a deletion resulting in an SMS-like phenotype. This identifies the first chimpanzee-specific genomic disorder mediated by lineage-specific expansion and restructuring of segmental duplications creating a putative chimpanzee-specific hotspot for deletion.
Figure 5.
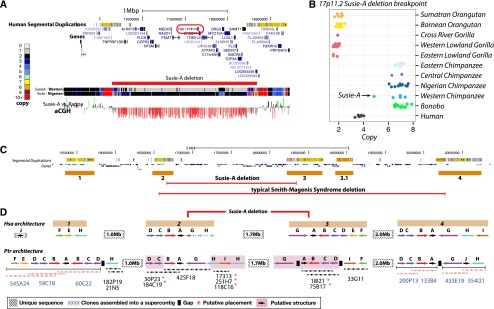
A chimpanzee genomic disorder. (A) A genome browser snapshot of the 17p11.2 Smith-Magenis syndrome (SMS) critical region with a copy number heat map of the Western chimpanzee Susie-A and the Nigerian–Cameroon chimpanzee Koto. Susie-A has a 1.7-Mb deletion of this locus, which encompasses RAI1, the critical gene associated with the SMS phenotype. We confirm this deletion by array CGH. (B) Copy number of great apes assessed in this study over the Susie-A deletion breakpoint 2 H-duplicon. (C) Organization of the 17p11.2 SMS locus and 17p12 in humans with four blocks of segmental duplication. The typical human SMS deletion spans ∼3.7 Mb with different breakpoints from the Susie-A deletion (Elsea and Girirajan 2008). (D) Segmental duplication architecture of the 17p11.2 locus as represented in the human reference genome and constructed in chimpanzees from high-quality sequencing of 22 BAC clones. We were able to assemble and anchor 11 of these clones into seven contigs. The remaining 11 contigs were placed at their most likely locations and orientations based on their underlying duplication architecture and read-depth analysis of Susie-A compared to normal chimpanzees. We hypothesize that a nonallelic homologous recombination event between the directly oriented chimpanzee G duplicons resulted in Susie-A's deletion.
Table 2.
Common clinical features of Smith-Magenis syndrome and related features of Western chimpanzee Susie-A with a corresponding 17pll.2 deletion
Discussion
We present the first genome-wide assessment of duplication and deletion diversity where single nucleotide substitutions have been used to calibrate CNV accumulation over the course of great ape evolution. There are three novel findings in this study. First, chimpanzees show an excess of large deletions early in their history. This is in stark contrast to almost every other population of great ape, where deletions have accumulated in a more clocklike fashion. The ancestral human lineage does not show an excess in the number of duplicated or deleted base pairs despite previous predictions (Olson 1999; Varki et al. 2008). Second, specific populations of great apes show an excess of copy number polymorphic duplications, notably Western chimpanzees, bonobos, and Sumatran orangutans. Only the Western chimpanzee shows evidence of increased deletion polymorphism. These three populations stand out in that they are predicted to have experienced sudden rises and crashes in effective population size. The Western chimpanzees are the most extreme in this regard, showing the strongest signal of genetic drift and the largest excess of ancestry-informative markers—consistent with the strongest bottleneck.
One possibility may be that CNPs (both duplications and deletions), in general, increase with small effective population sizes but that a severe bottleneck is necessary in order to result in an increase in deletion burden as a result of strong selection against deletions. The neutral nature of the vast majority of SNPs suggests that reductions in diversity may, in some cases, have little effect on overall fitness, in contrast to large structural variants. Human investigations as well as Drosophila studies have additionally shown that deletions affecting genes are significantly more deleterious than duplications (Emerson et al. 2008; Cooper et al. 2011). Indeed, analyses of the theoretical relationship between Ne and rates of deletion and duplication have suggested that fluctuations in effective population size may play a significant role in overall variations in genome size among organisms (Lynch 2007). These findings would explain the excess of deletions specifically in the ancestral chimpanzee branch because this species shows the most drastic decline in effective population size when compared to orangutan, human, and gorilla. Humans once again are similar to other great apes with respect to CNP burden and do not particularly stand out, although the number of genomes compared are few.
Finally, we report the first evidence of a genomic disorder in the chimpanzee lineage. The phenotype is remarkably similar to SMS, but the breakpoints are not shared with the common recurrent deletion seen in humans. Our sequencing analysis shows that the chimpanzee 17p11.2 breakpoints have radically changed in structure and content facilitating nonallelic homologous recombination. Owing to the evolution of this chimpanzee-specific architecture, we predict that this locus represents a chimpanzee genomic hotspot of mutation and that additional recurrent microdeletions may be encountered among the chimpanzee population. It is somewhat surprising that Susie-A was captured from the wild, albeit as a young chimp. In light of her behavioral anomalies, it is unlikely that she would have survived to adulthood outside of captivity. This raises the intriguing possibility that additional cases, and perhaps novel recurrent genomic disorders, may be encountered as apes continue to be bred in captivity. Most comparative sequencing studies of human genomic disorder breakpoint regions have reported increasing complexity in the human lineage as a predisposing factor to rearrangement associated with disease (Rochette et al. 2001; Antonacci et al. 2010; Boettger et al. 2012). Our results show that loci of increasing complexity are present in other great ape lineages creating species-specific hotspots prone to deletion and disease.
Methods
Read-depth profiles were initially constructed from whole-genome sequence from 120 great ape individuals. We assessed the quality of each of these genomes by assessing the sequence read-depth in regions of the genome (1.1 Gbp) regarded as copy number invariant (Supplemental Section 1). We excluded 23 individual genomes that showed considerable heterogeneity in their read-depth presumably due to nonuniformity (Supplemental Fig. 1.1). We report analysis on the remaining 97 genomes: 75 were sequenced as part of the Great Ape Genome Diversity Project (Prado-Martinez et al. 2013) to a mean coverage of ∼25× on an Illumina HiSeq 2000, while an additional nine orangutans, 10 humans, and the Denisovan individual were sequenced as part of the Orangutan Genome Project and the Denisova Genome Project (Locke et al. 2011; Meyer et al. 2012). Individuals sequenced as part of the Great Ape Genome Project were originally selected to best represent wild natural diversity by focusing on captive individuals of known wild-born origin in addition to individuals from protected areas in Africa (Supplemental Table S1). Individual genome subspecies designations were assigned as reported by sample sources and confirmed by SNP genotyping and PCA analysis. All reads were first divided into their 36-bp constituents and mapped to the human reference genome (NCBI36) using the mrsFASTc read aligner (Hach et al. 2010). Read-depth estimates across the genome were corrected for the underlying GC content, and a calibration curve from regions of known copy number was used to assign copy number estimates to windows of the genome. These regions were then segmented using a scale-space filtering algorithm (Supplemental Section 3).
Briefly, the scale-space filtering algorithm transforms the windowed copy number waveform, f(x), into a set of waveforms, f(x,σ), where values of σ represent the standard deviation of a Gaussian smoothing kernel applied to the original waveform. Contours of this transform are then traversed from large values of σ as σ → 0, and the resulting segments are hierarchically clustered. We also masked regions of high GC content (>57%, corresponding to 2.23% of the genome). Array CGH validation experiments were performed in duplicate for every sample tested with Cy3 and Cy5 labeling dyes swapped. Probes giving opposite signals in the dye swap experiment were discarded. Only loci with at least three probes were considered for validation. CNV load comparisons were performed using Kaplan-Meier survival curves, and statistical tests were corrected for sample size. BAC clones were selected from the chimpanzee BAC library CHORI-251 corresponding to the male chimpanzee Clint. Clones were sequenced using a PacBio RS system using standard protocols. The library was prepared with a 10-kb insert size and sequence generated with C2 chemistry in 90-min movies.
Data access
Copy number maps for the 97 individuals assessed in this study are available online (http://eichlerlab.gs.washington.edu/greatape-cnv). All lineage-specific and segregating copy number variants are additionally reported in Supplemental Tables S2–S11. All structural variants have been deposited into the database of genomic structural variation (dbVAR; http://www.ncbi.nlm.nih.gov/dbvar/) under accession number nstd82. Underlying raw sequence reads have been deposited in the NCBI Sequence Read Archive (SRA; http://www.ncbi.nlm.nih.gov/sra/) under accession number SRP018689. See also BioProject (PRJNA189439; http://www.ncbi.nlm.nih.gov/bioproject).
Competing interest statement
E.E.E. is on the scientific advisory boards for Pacific Biosciences, Inc., SynapDx Corp., and DNAnexus, Inc.
Acknowledgments
P.H.S. is supported by a Howard Hughes International Student Fellowship. T.M.B. is supported by an ERC Starting Grant (260372). T.M.B. is an ICREA Research Investigator (Institut Catala d'Estudis i Recerca Avancats de la Generalitat de Catalunya). This work was supported, in part, by U.S. National Institutes of Health (NIH) grant HG002385 to E.E.E., BFU2009-13409-C02-02 to J.P.M., and MICINN (Spain) BFU2011-28549 to T.M.B. E.E.E. is an investigator of the Howard Hughes Medical Institute.
Footnotes
[Supplemental material is available for this article.]
Article published online before print. Article, supplemental material, and publication date are at http://www.genome.org/cgi/doi/10.1101/gr.158543.113.
References
- The 1000 Genomes Project Consortium 2012. An integrated map of genetic variation from 1,092 human genomes. Nature 491: 56–65 [DOI] [PMC free article] [PubMed] [Google Scholar]
- Antonacci F, Kidd JM, Marques-Bonet T, Teague B, Ventura M, Girirajan S, Alkan C, Campbell CD, Vives L, Malig M, et al. 2010. A large and complex structural polymorphism at 16p12.1 underlies microdeletion disease risk. Nat Genet 42: 745–750 [DOI] [PMC free article] [PubMed] [Google Scholar]
- Bi W, Ohyama T, Nakamura H, Yan J, Visvanathan J, Justice MJ, Lupski JR. 2005. Inactivation of Rai1 in mice recapitulates phenotypes observed in chromosome engineered mouse models for Smith-Magenis syndrome. Hum Mol Genet14: 983–995. [DOI] [PubMed] [Google Scholar]
- Boettger LM, Handsaker RE, Zody MC, McCarroll SA 2012. Structural haplotypes and recent evolution of the human 17q21.31 region. Nat Genet 44: 881–885 [DOI] [PMC free article] [PubMed] [Google Scholar]
- Brawand D, Soumillon M, Necsulea A, Julien P, Csárdi G, Harrigan P, Weier M, Liechti A, Aximu-Petri A, Kircher M, et al. 2011. The evolution of gene expression levels in mammalian organs. Nature 478: 343–348 [DOI] [PubMed] [Google Scholar]
- Charrier C, Joshi K, Coutinho-Budd J, Kim J-E, Lambert N, de Marchena J, Jin W-L, Vanderhaeghen P, Ghosh A, Sassa T, et al. 2012. Inhibition of SRGAP2 function by its human-specific paralogs induces neoteny during spine maturation. Cell 149: 923–935 [DOI] [PMC free article] [PubMed] [Google Scholar]
- Cheng Z, Ventura M, She X, Khaitovich P, Graves T, Osoegawa K, Church D, DeJong P, Wilson RK, Pääbo S, et al. 2005. A genome-wide comparison of recent chimpanzee and human segmental duplications. Nature 437: 88–93 [DOI] [PubMed] [Google Scholar]
- The Chimpanzee Sequencing and Analysis Consortium 2005. Initial sequence of the chimpanzee genome and comparison with the human genome. Nature 437: 69–87 [DOI] [PubMed] [Google Scholar]
- Cooper GM, Coe BP, Girirajan S, Rosenfeld JA, Vu TH, Baker C, Williams C, Stalker H, Hamid R, Hannig V, et al. 2011. A copy number variation morbidity map of developmental delay. Nat Genet 43: 838–846 [DOI] [PMC free article] [PubMed] [Google Scholar]
- Dennis MY, Nuttle X, Sudmant PH, Antonacci F, Graves TA, Nefedov M, Rosenfeld JA, Sajjadian S, Malig M, Kotkiewicz H, et al. 2012. Evolution of human-specific neural SRGAP2 genes by incomplete segmental duplication. Cell 149: 912–922 [DOI] [PMC free article] [PubMed] [Google Scholar]
- Dumas L, Kim YH, Karimpour-Fard A, Cox M, Hopkins J, Pollack JR, Sikela JM 2007. Gene copy number variation spanning 60 million years of human and primate evolution. Genome Res 17: 1266–1277 [DOI] [PMC free article] [PubMed] [Google Scholar]
- Edelman EA, Girirajan S, Finucane B, Patel PI, Lupski JR, Smith ACM, Elsea SH. 2007. Gender, genotype, and phenotype differences in Smith-Magenis syndrome: a meta-analysis of 105 cases. Clin Genet71: 540–550. [DOI] [PubMed] [Google Scholar]
- Elsea SH, Girirajan S 2008. Smith–Magenis syndrome. Eur J Hum Genet 16: 412–421 [DOI] [PubMed] [Google Scholar]
- Emerson JJ, Cardoso-Moreira M, Borevitz JO, Long M 2008. Natural selection shapes genome-wide patterns of copy-number polymorphism in Drosophila melanogaster. Science 320: 1629–1631 [DOI] [PubMed] [Google Scholar]
- Ferdinandusse S, Denis S, Clayton PT, Graham A, Rees JE, Allen JT, McLean BN, Brown AY, Vreken P, Waterham HR, et al. 2000. Mutations in the gene encoding peroxisomal α-methylacyl-CoA racemase cause adult-onset sensory motor neuropathy. Nat Genet 24: 188–191 [DOI] [PubMed] [Google Scholar]
- Fortna A, Kim Y, MacLaren E, Marshall K, Hahn G, Meltesen L, Brenton M, Hink R, Burgers S, Hernandez-Boussard T, et al. 2004. Lineage-specific gene duplication and loss in human and Great Ape evolution. PLoS Biol 2: E207. [DOI] [PMC free article] [PubMed] [Google Scholar]
- Gazave E, Darré F, Morcillo-Suarez C, Petit-Marty N, Carreño A, Marigorta UM, Ryder OA, Blancher A, Rocchi M, Bosch E, et al. 2011. Copy number variation analysis in the Great Apes reveals species-specific patterns of structural variation. Genome Res 21: 1626–1639 [DOI] [PMC free article] [PubMed] [Google Scholar]
- Greenberg F, Lewis RA, Potocki L, Glaze D, Parke J, Killian J, Murphy MA, Williamson D, Brown F, Dutton R, et al. 1996. Multi-disciplinary clinical study of Smith-Magenis syndrome (deletion 17p11.2). Am J Med Genet62: 247–254. [DOI] [PubMed] [Google Scholar]
- Hach F, Hormozdiari F, Alkan C, Hormozdiari F, Birol I, Eichler EE, Sahinalp SC 2010. mrsFAST: A cache-oblivious algorithm for short-read mapping. Nat Methods 7: 576–577 [DOI] [PMC free article] [PubMed] [Google Scholar]
- Kumar RA, KaraMohamed S, Sudi J, Conrad DF, Brune C, Badner JA, Gilliam TC, Nowak NJ, Cook EH Jr, Dobyns WB, et al. 2008. Recurrent 16p11.2 microdeletions in autism. Hum Mol Genet 17: 628–638 [DOI] [PubMed] [Google Scholar]
- Locke DP, Hillier LW, Warren WC, Worley KC, Nazareth LV, Muzny DM, Yang S-P, Wang Z, Chinwalla AT, Minx P, et al. 2011. Comparative and demographic analysis of orangutan genomes. Nature 469: 529–533 [DOI] [PMC free article] [PubMed] [Google Scholar]
- Lynch M. 2007. The origins of genome architecture. Sinauer, Sunderland, MA. [Google Scholar]
- Maeda T, Abe M, Kurisu K, Jikko A, Furukawa S 2001. Molecular cloning and characterization of a novel gene, CORS26, encoding a putative secretory protein and its possible involvement in skeletal development. J Biol Chem 276: 3628–3634 [DOI] [PubMed] [Google Scholar]
- Marques-Bonet T, Kidd JM, Ventura M, Graves TA, Cheng Z, Hillier LW, Jiang Z, Baker C, Malfavon-Borja R, Fulton LA, et al. 2009. A burst of segmental duplications in the genome of the African Great Ape ancestor. Nature 457: 877–881 [DOI] [PMC free article] [PubMed] [Google Scholar]
- McLean CY, Reno PL, Pollen AA, Bassan AI, Capellini TD, Guenther C, Indjeian VB, Lim X, Menke DB, Schaar BT, et al. 2011. Human-specific loss of regulatory DNA and the evolution of human-specific traits. Nature 471: 216–219 [DOI] [PMC free article] [PubMed] [Google Scholar]
- Meyer M, Kircher M, Gansauge M-T, Li H, Racimo F, Mallick S, Schraiber JG, Jay F, Prüfer K, de Filippo C, et al. 2012. A high-coverage genome sequence from an archaic Denisovan individual. Science 338: 222–226 [DOI] [PMC free article] [PubMed] [Google Scholar]
- Olson MV 1999. When less is more: Gene loss as an engine of evolutionary change. Am J Hum Genet 64: 18–23 [DOI] [PMC free article] [PubMed] [Google Scholar]
- Ortiz M, Kaessmann H, Zhang K, Bashirova A, Carrington M, Quintana-Murci L, Telenti A 2008. The evolutionary history of the CD209 (DC-SIGN) family in humans and non-human primates. Genes Immun 9: 483–492 [DOI] [PMC free article] [PubMed] [Google Scholar]
- Perry GH, Tchinda J, McGrath SD, Zhang J, Picker SR, Cáceres AM, Iafrate AJ, Tyler-Smith C, Scherer SW, Eichler EE, et al. 2006. Hotspots for copy number variation in chimpanzees and humans. Proc Natl Acad Sci 103: 8006–8011 [DOI] [PMC free article] [PubMed] [Google Scholar]
- Prado-Martinez J, Sudmant PH, Kidd JM, Li H, Kelley JL, Lorente-Galdos B, Veeramah KR, Woerner AE, O'Connor TD, Santpere G, et al. 2013. Great ape genetic diversity and population history. Nature. doi: 10.1038/nature12228. [DOI] [PMC free article] [PubMed] [Google Scholar]
- Prüfer K, Munch K, Hellmann I, Akagi K, Miller JR, Walenz B, Koren S, Sutton G, Kodira C, Winer R, et al. 2012. The bonobo genome compared with the chimpanzee and human genomes. Nature 486: 527–531 [DOI] [PMC free article] [PubMed] [Google Scholar]
- Rochette CF, Gilbert N, Simard LR 2001. SMN gene duplication and the emergence of the SMN2 gene occurred in distinct hominids: SMN2 is unique to Homo sapiens. Hum Genet 108: 255–266 [DOI] [PubMed] [Google Scholar]
- Siepel A, Bejerano G, Pedersen JS, Hinrichs AS, Hou M, Rosenbloom K, Clawson H, Spieth J, Hillier LW, Richards S, et al. 2005. Evolutionarily conserved elements in vertebrate, insect, worm, and yeast genomes. Genome Res 15: 1034–1050 [DOI] [PMC free article] [PubMed] [Google Scholar]
- Sudmant PH, Kitzman JO, Antonacci F, Alkan C, Malig M, Tsalenko A, Sampas N, Bruhn L, Shendure J, 1000 Genomes Project, et al. 2010. Diversity of human copy number variation and multicopy genes. Science 330: 641–646 [DOI] [PMC free article] [PubMed] [Google Scholar]
- Varki A, Geschwind DH, Eichler EE 2008. Explaining human uniqueness: Genome interactions with environment, behaviour and culture. Nat Rev Genet 9: 749–763 [DOI] [PMC free article] [PubMed] [Google Scholar]
- Ventura M, Catacchio CR, Alkan C, Marques-Bonet T, Sajjadian S, Graves TA, Hormozdiari F, Navarro A, Malig M, Baker C, et al. 2011. Gorilla genome structural variation reveals evolutionary parallelisms with chimpanzee. Genome Res 21: 1640–1649 [DOI] [PMC free article] [PubMed] [Google Scholar]
- Walz K, Caratini-Rivera S, Bi W, Fonseca P, Mansouri DL, Lynch J, Vogel H, Noebels JL, Bradley A, Lupski JR. 2003. Modeling del(17)(p11.2p11.2) and dup(17)(p11.2p11.2) contiguous gene syndromes by chromosome engineering in mice: Phenotypic consequences of gene dosage imbalance. Mol Cell Biol23: 3646–3655. [DOI] [PMC free article] [PubMed] [Google Scholar]
- Wang X, Mitra N, Secundino I, Banda K, Cruz P, Padler-Karavani V, Verhagen A, Reid C, Lari M, Rizzi E, et al. 2012. Specific inactivation of two immunomodulatory SIGLEC genes during human evolution. Proc Natl Acad Sci 109: 9935–9940 [DOI] [PMC free article] [PubMed] [Google Scholar]
- Weiss LA, Shen Y, Korn JM, Arking DE, Miller DT, Fossdal R, Saemundsen E, Stefansson H, Ferreira MAR, Green T, et al. 2008. Association between microdeletion and microduplication at 16p11.2 and autism. N Engl J Med 358: 667–675 [DOI] [PubMed] [Google Scholar]
- Yan J, Keener VW, Bi W, Walz K, Bradley A, Justice MJ, Lupski JR. 2004. Reduced penetrance of craniofacial anomalies as a function of deletion size and genetic background in a chromosome engineered partial mouse model for Smith-Magenis syndrome. Hum Mol Genet13: 2613–2624. [DOI] [PubMed] [Google Scholar]


