

Abstract
DNA methylation plays key roles in diverse biological processes such as X chromosome inactivation, transposable element repression, genomic imprinting, and tissue-specific gene expression. Sequencing-based DNA methylation profiling provides an unprecedented opportunity to map and compare complete DNA methylomes. This includes one of the most widely applied technologies for measuring DNA methylation: methylated DNA immunoprecipitation followed by sequencing (MeDIP-seq), coupled with a complementary method, methylation-sensitive restriction enzyme sequencing (MRE-seq). A computational approach that integrates data from these two different but complementary assays and predicts methylation differences between samples has been unavailable. Here, we present a novel integrative statistical framework M&M (for integration of MeDIP-seq and MRE-seq) that dynamically scales, normalizes, and combines MeDIP-seq and MRE-seq data to detect differentially methylated regions. Using sample-matched whole-genome bisulfite sequencing (WGBS) as a gold standard, we demonstrate superior accuracy and reproducibility of M&M compared to existing analytical methods for MeDIP-seq data alone. M&M leverages the complementary nature of MeDIP-seq and MRE-seq data to allow rapid comparative analysis between whole methylomes at a fraction of the cost of WGBS. Comprehensive analysis of nineteen human DNA methylomes with M&M reveals distinct DNA methylation patterns among different tissue types, cell types, and individuals, potentially underscoring divergent epigenetic regulation at different scales of phenotypic diversity. We find that differential DNA methylation at enhancer elements, with concurrent changes in histone modifications and transcription factor binding, is common at the cell, tissue, and individual levels, whereas promoter methylation is more prominent in reinforcing fundamental tissue identities.
The haploid human genome contains ∼28 million CpGs that exist in methylated, hydroxymethylated, or unmethylated states. The methylation status of cytosines in CpGs influences protein–DNA interactions and chromatin structure and stability, and consequently plays a vital role in the regulation of biological processes such as transcription, X chromosome inactivation, genomic imprinting, host defense against endogenous parasitic sequences, and embryonic development, as well as possibly playing a role in learning and memory (Watt and Molloy 1988; Boyes and Bird 1991; Khulan et al. 2006; Suzuki and Bird 2008; Laird 2010; Day and Sweatt 2011; Jones 2012). Recent genome-wide studies revealed that DNA methylation patterns in mammals are tissue-specific (Eckhardt et al. 2006; Khulan et al. 2006; Kitamura et al. 2007; Illingworth et al. 2008; Maunakea et al. 2010), as has been reported for individual genes. However, our current understanding of the regulatory role of tissue-specific DNA methylation remains incomplete. Until recently, this has been limited by our ability to comprehensively and accurately assess the genomic distribution of tissue-specific DNA methylation (Laird 2010; Bock 2012) and by the lack of methylome maps of many human tissues and primary cell types.
Sequencing-based DNA methylation profiling methods provide an opportunity to map complete DNA methylomes. These technologies include whole-genome bisulfite sequencing (WGBS, MethylC-seq [Cokus et al. 2008; Lister et al. 2009] or BS-seq [Laurent et al. 2010]), reduced-representation bisulfite-sequencing (RRBS) (Meissner et al. 2005, 2008), enrichment-based methods (MeDIP-seq [Weber et al. 2005; Maunakea et al. 2010], MBD-seq [Serre et al. 2009]), and methylation-sensitive restriction enzyme based methods (HELP [Suzuki and Greally 2010], MRE-seq [Maunakea et al. 2010]). These methods yield largely concordant results but differ significantly in the extent of genomic CpG coverage, resolution, quantitative accuracy, and cost (Bock et al. 2010; Harris et al. 2010). For example, WGBS-based methods produce the most comprehensive and high-resolution DNA methylome maps, but typically require sequencing to 30× coverage which is still expensive for the routine analysis of many samples, particularly those with a large methylome (e.g., human). Additionally, bisulfite-based methods, including WGBS and RRBS, conflate methylcytosine (mC) and hydroxymethylcytosine (hmC) (Huang et al. 2010) unless combined with additional experiments (Booth et al. 2012; Yu et al. 2012).
Because MeDIP-seq generates cost-effective and whole-genome methylation data, it is currently a widely used sequencing-based method for whole-methylome analysis. MeDIP-seq relies on an anti-methylcytidine antibody to immunoprecipitate methylcytosine-containing randomly sheared genomic DNA fragments. Therefore, MeDIP-seq read density is proportional to the DNA methylation level in a given region. The anti-methylcytidine antibody used in MeDIP does not bind hmC, although DNA fragments with both mC and hmC could be immunoprecipitated in this protocol. Importantly, local methylated CpG density also influences MeDIP enrichment and must be accounted for in analyzing MeDIP data (Pelizzola et al. 2008; Laird 2010; Robinson et al. 2010). Several computational tools have been developed for analyzing MeDIP data using a CpG coupling factor to normalize MeDIP signal across regions with differing mCpG densities. These include Batman (Down et al. 2008), which implements a Bayesian deconvolution strategy, and MEDIPS (Chavez et al. 2010), which produces similar results as Batman but with higher computational efficiency.
MRE-seq is a complementary approach to MeDIP-seq that identifies unmethylated CpG sites in the restriction sites for multiple methylation-sensitive restriction enzymes (Harris et al. 2010; Maunakea et al. 2010). By using simple heuristics, we demonstrated that the combination of these two methods showed promise in identifying differentially methylated regions (DMRs) as well as intermediate or monoallelic methylation (Harris et al. 2010). Here, we further explore and leverage the complementary nature of MeDIP-seq and MRE-seq by integrating them in a statistical framework. Our approach is based on the principle that all observed genome-wide measurements (MeDIP-seq, MRE-seq, WGBS, etc.) are derived from methylation states of the sample. We infer methylation states from the observed data, which are sequencing reads aligned to the reference genome. However, all current approaches to assessing DNA methylation have their own inherent errors and biases. Because MeDIP-seq and MRE-seq are independent, complementary measurements of the same methylation states, our confidence in inferring methylation states should increase when results from these two methods are integrated (Stevens et al. 2013). For example, a decrease of MeDIP-seq signal could reflect a biological event (we infer that this region is demethylated) or could be a methodological artifact; but if it is corroborated by an increase of MRE-seq signal, then the inference of demethylation is much more likely to be accurate. Thus, integrating MeDIP-seq and MRE-seq is expected to improve our ability to detect DMRs accurately.
Here, we describe a novel statistical framework which we call “M&M” (for integration of MeDIP-seq and MRE-seq) that detects DMRs. M&M explicitly models the relationship between DNA methylation level, CpG content, and expected MeDIP and MRE reads in any given genomic context. By analyzing WGBS, MeDIP-seq, and MRE-seq data for the same DNA samples, we show that M&M outperforms MEDIPS in detecting DMRs. We applied M&M to 19 human samples representing nine cell types from four tissues (embryonic stem cells, breast, blood, and brain) which we assayed with MeDIP-seq and MRE-seq. Our results revealed a large, definitive panel of known and mostly novel tissue type-, cell type-, and individual-specific DNA methylation differences. Consistent with expectations, we identified enrichment of DMRs in promoter regions of genes with tissue-specific functions. Importantly, we identified a large number of DMRs that were undermethylated in tissues where the same local region also harbored enhancer chromatin signatures. These enhancer-marked DMRs comprised 30% of the tissue-specific DMRs, >70% of the cell type-specific DMRs, and >40% of the individual-specific DMR landscape.
Results
Summary of the M&M algorithm
Differentially methylated regions (DMRs) are defined as any genomic region where the overall CpG methylation levels are statistically significantly different between cell populations of two samples being compared. The M&M algorithm identifies DMRs by computing a probability score for the difference in DNA methylation for any given genomic region based on observed MeDIP-seq and MRE-seq measurements. We made several simple assumptions and definitions. First, we only considered CpG methylation and made the reasonable assumption that all signals obtained from MeDIP-seq and MRE-seq are the result of CpG methylation. We note that methylation of cytosines in the non-CpG context (i.e., CHG and CHH) is rare in somatic cells but is more common in embryonic stem cells, albeit at low levels at any given site, and is associated with highly methylated CpGs (Lister et al. 2009). The biological significance of CHG and CHH methylation in mammalian cells is yet to be determined. Our statistical model is general enough to incorporate non-CpG cytosine methylation, but to facilitate comparisons with existing tools, we only considered CpG methylation in this study. Second, we assumed that MeDIP-seq signal is proportional to the number of methylated CpGs in any given region. This assumption was made by previously published tools (Pelizzola et al. 2008; Chavez et al. 2010; Maunakea et al. 2010), and we confirmed that the rule, in general, holds (Supplemental Fig. S1A). Third, we assumed that MRE-seq signal is proportional to the number of unmethylated CpGs at the enzyme recognition sites (defined as MRE sites) (Supplemental Fig. S1B). We further assumed that, within the same region of interest, methylation levels of CpGs in MRE sites reflect levels of nearby CpGs that are not within the MRE sites. Finally, we defined methylation level (μ) as the proportion of methylated CpGs versus total CpGs in a given region. Thus, observed MeDIP-seq and MRE-seq data become a function of methylation level, CpG content, and MRE site content of a given genomic region. MeDIP-seq signal and MRE-seq signal are related by the methylation level, μ, of the region, with their expectations proportional to μ and (1−μ), respectively. When comparing two samples in the same genomic region, we are testing the null hypothesis that methylation levels are the same between the samples. This hypothesis is conditioned on the observed MeDIP-seq and MRE-seq data, given the CpG content and MRE-site content; CpG and MRE-site content are fixed for any specific genomic region when SNP, mutation, or copy number differences are not considered. When genetic variation data is available for the sample, corrections can be made to reflect known variation. To better formulate the problem, we illustrate the algorithm by taking a window-based approach and partitioning the reference genome into B equally spaced, nonoverlapping windows (typically 500 bp in size). We only considered windows that contain CpG sites. For the ith  window, let mi denote the number of CpGs and ki denote the number of CpGs in MRE sites. Let X1i and X2i denote the MeDIP-seq read counts of the two samples being compared. Since many CpGs are not in MRE sites, MRE-seq read counts are not on the same scale as MeDIP-seq read counts. To integrate the two signals into the same framework, we normalized the raw MRE-seq read counts by multiplying a scaling factor
  , and call the normalized MRE-seq read counts Y1i and Y2i. We then assumed that X1i, X2i, Y1i, and Y2i are mutually independent Poisson random variables with expected values
  and
and  , where
  refers to the two samples being compared. Let
  and
and  . We then modeled the expected values of Xji and Yji as
 |
where  ,
,  , and μ1i and μ2i are the unknown methylation levels of the two samples in the ith window.
Under this model, we detected DMRs by testing for all  ,
,
which is equivalent to testing
 |
From Equation 1, we can rewrite Equation 3 as
where  and
and 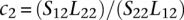 can be estimated from the data. Note that Lj1 and Lj2 can be estimated from the observed read counts, whereas Sj1 and Sj2 cannot be directly estimated, but their ratio can. We then used a conditional test based on the test statistic:
Let ni be the sum of the observed MeDIP-seq and MRE-seq read counts in the ith bin. Based on Agresti (2007), given ni, the joint distribution of X1i, X2i, Y1i, and Y2i is a multinomial distribution (Supplemental Notes), which allows deriving the P-value defined as
where ti is the observed value of Ti. For windows in which only MeDIP-seq data are available, let 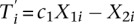 . Then, the P-value is given by
 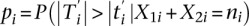 with
with  being the observed value of
  . In this case, our method reduces to the SAGE test (Robinson and Oshlack 2010). When the total read count ni is large, we can achieve accurate analytical approximation to the discrete P-value in Equation 5 by normal approximation to estimate P-values analytically (Lehmann and Romano 2005) (Supplemental Notes).
Finally, since we applied M&M to genomic windows genome-wide, the genome-wide false discovery rate (FDR) was controlled using the group Benjamini-Hochberg method previously described in Hu et al. (2010).
The overall flow of the M&M algorithm is illustrated in Supplemental Figure S2 to facilitate understanding. Additional details of the M&M algorithm are described in Supplemental Notes.
Benchmarking M&M’s performance
Because M&M implements a novel test statistic, we evaluated its sensitivity, specificity, and reproducibility on multiple DNA methylomes from human tissues and populations of cells strongly enriched for individual cell types. We tested the performance of M&M against MEDIPS.
We generated complete DNA methylome data for 19 human samples (Supplemental Table 1) as a part of the NIH Roadmap Epigenomics project (Bernstein et al. 2010). Tissue and primary cell types included embryonic stem cells (H1 ESCs), fetal brain tissue, neural stem cells (neurosphere cultured cells, ganglionic eminence derived), adult breast epithelial cells (luminal epithelial cells, myoepithelial cells, and a stem cell-enriched population), unfractionated peripheral blood mononuclear cells (PBMCs), and adult immune cells (CD4+ naive and memory and CD8+ naive cells). All samples were assayed by both MeDIP-seq and MRE-seq. For H1 ESC, two biological replicates were obtained. In addition, we obtained WGBS data for H1 ESCs (Lister et al. 2009). We also generated a second WGBS data set for short-term cultured human fetal neural stem cells (HuFNSC02, neurosphere cultured cells [NSCs], ganglionic eminence derived, fetal age of 21 wk) for which we also generated MeDIP-seq and MRE-seq data. We compared M&M’s performance against that of MEDIPS by applying M&M and MEDIPS (which uses MeDIP-seq data only) for pairwise comparisons between the two H1 ESC replicates and between H1 ESCs and fetal NSCs. All tests were performed on 500-bp-sized, nonoverlapping windows genome-wide (a total of 5,313,352 windows; windows without CpGs in the hg19 build of the human genome were not considered). In each pairwise comparison, M&M and MEDIPS generated a P-value for each window, which was used to determine if the region within the window exhibited differential methylation between the two samples. In addition, for each DMR, the relative methylation status for the two samples was also determined, i.e., which sample was relatively hypermethylated and which sample was relatively hypomethylated.
We then examined the distribution of P-values across the different comparisons. In Figure 1A, we plotted histograms of all P-values generated by M&M when comparing the two H1 ESC biological replicates and when comparing H1 ESCs and fetal NSCs. The x-axis denotes negative log10 transformed P-values, and the y-axis denotes the log10 transformed number of DMRs at each P-value cutoff. Similarly, in Figure 1B, we plotted P-values from the same comparisons made by MEDIPS. At any reasonable cutoff, M&M and MEDIPS both predicted more DMRs between H1 ESCs and fetal NSCs than between the two H1 ESC replicates, consistent with our expectations. Because the H1 ESC samples are biological replicates, this comparison can be used to estimate the number of false positives at any P-value cutoff. At a P-value less than 1 × 10⁻¹⁰, M&M reported 70 DMRs, while MEDIPS reported 2066 DMRs. Thus, the false positives rate was 0.43% for M&M and 18.51% for MEDIPS. Using the same P-value cutoff for the comparison between two different cell types, i.e., H1 ESCs and fetal NSCs, M&M reported 16,398 DMRs, while MEDIPS reported 11,162; only about 70 DMRs called by M&M from the H1 vs. fetal NSC comparison were expected to be false positives, while about 2066 of the DMRs called by MEDIPS could be false positives. These numbers suggest that M&M has higher specificity compared to MEDIPS.
Figure 1.

Benchmarking the performance of M&M. (A) The distribution of P-values generated by M&M when comparing two H1 ESC biological replicates (blue area) and when comparing H1 ESC and fetal NSC (red area). At a P-value cutoff of less than 1 × 10⁻¹⁰ (green line), M&M predicted 70 DMRs between the two H1 samples, and 16,398 DMRs between H1 ESC and fetal NSC. (B) The distribution of P-values generated by MEDIPS for the same comparisons as in A. At a P-value cutoff of less than 1 × 10⁻¹⁰ (green line), MEDIPS predicted 2066 DMRs between the two H1 ESC replicates, and 11,162 DMRs between H1 ESC and fetal NSC. (C) Whole-genome bisulfite sequencing (WGBS) data were used to validate DMRs predicted by M&M between H1 ESC and fetal NSC. DMRs predicted by M&M were ranked according to their P-values, then average DNA methylation levels for each of the top 1000 significantly hypermethylated DMRs (red) and the top 1000 significantly hypomethylated DMRs (blue) in fetal NSC were computed using WGBS data from the same two samples (H1 ESC and fetal NSC). Distribution of the DNA methylation level differences was plotted for hypermethylated DMRs and hypomethylated DMRs separately. The gray area represents the distribution of DNA methylation differences in the whole-genome background, calculated at 500-bp-window resolution using the same WGBS data sets. (D) Same as C, except that DMRs were predicted by MEDIPS. (E) DNA methylation differences between H1 ESC and fetal NSC were calculated using WGBS data for individual CpGs within the top 500, 1000, 2000, 5000, and 10,000 hypermethylated and hypomethylated DMRs (predicted by M&M, at varying cutoffs). These values were plotted as a boxplot. (F) Same as E, except that DMRs were predicted by MEDIPS. (G) Concordance between M&M (red) or MEDIPS (blue) predicted DMRs and differential methylation for these regions calculated from WGBS data. DMRs predicted by M&M and MEDIPS were ranked based on their P-values. At different cutoffs, DMRs were determined to be concordant with WGBS data (if differences in WGBS data were greater than 0.1 and were in the correct direction). (H) Reproducibility of DMR predictions in M&M (red) and MEDIPS (blue). DMR discovery was performed between two cell types from the same individual and repeated in a second individual. DMRs identified in each individual were ranked according to their P-values and intersected between the two individuals. The percentages of overlapping DMRs at different cutoffs were plotted.
To compare the sensitivities of the methods, we examined the enrichment of individual CpGs with significantly different methylation levels within the predicted DMRs. We focused again on the comparison between H1 ESC and fetal NSC samples because WGBS was available for both samples from which we could derive methylation levels at single CpG resolution. In this pairwise comparison, we used M&M or MEDIPS to define any DMR in which fetal NSCs had a higher methylation level than H1 ESC as a hypermethylated DMR, and any DMR in which fetal NSCs had a lower methylation level than H1 ESC as a hypomethylated DMR. Based on ranked P-values, we used the top 1000 predicted hypermethylated DMRs and top 1000 hypomethylated DMRs for this comparison. Using the WGBS data, we derived methylation levels for individual CpGs located within the predicted DMRs. We then calculated methylation level differences by subtracting the individual CpG methylation values in H1 ESCs from their values in fetal NSCs. The histograms of individual CpG methylation level differences were plotted for both hypermethylated DMRs and hypomethylated DMRs, as shown in Figure 1, C and D for M&M and MEDIPS, respectively. Compared to the background methylation level differences between the two cell types, the top 2000 DMRs predicted by M&M were enriched for differentially methylated CpGs. While MEDIPS also enriched for differentially methylated CpGs, it did so to a much lesser degree than M&M. The trend remained the same when we compared differing numbers of top predicted DMRs (Fig. 1E,F).
We then analyzed the concordance between these DMR predictions with the WGBS data. For any predicted DMR, we defined it as concordant if it was predicted as a hypermethylated (or hypomethylated) DMR by M&M or MEDIPS and the averaged differences of WGBS methylation values across all CpGs in the DMR were greater than 0.1 (or less than −0.1; fetal NSC WGBS values minus H1 ESC WGBS values). Otherwise, the predicted DMR was called a discordant prediction. The rates of concordance for both M&M and MEDIPS were plotted for the top DMRs generated at increasingly relaxed statistical cutoffs (Fig. 1G). The high concordance between M&M’s prediction and actual CpG methylation differences inferred from WGBS data was robust regardless of the P-value used. Furthermore, M&M’s concordance rate was higher than that of MEDIPS.
We also examined the reproducibility of DMR predictions between biological replicates. We performed comparisons using the same two cell types isolated from two different individuals—breast luminal epithelial cell samples (RM066BreLum and RM070BreLum) and breast myoepithelial cell samples (RM066BreMyo and RM070BreMyo). The comparison between two cell types from one individual should enrich for DMRs underlying cell type specificity, and these DMRs should be identified again in the comparison between the same two cell types of another individual. We examined reproducibility by intersecting the DMRs from both individuals at multiple P-value cutoffs. M&M had three- to fourfold higher reproducibility than MEDIPS in this analysis (Fig. 1H).
In addition to these evaluations, we also examined the agreement among DMRs detected by M&M, MEDIPS, and by WGBS, between H1 ESC and fetal NSC (Methods). Of the top 10,000 DMRs predicted by each method, M&M and WGBS overlapped by 4224, while MEDIPS and WGBS overlapped by 2979 (Supplemental Fig. S3A). As expected, the average DNA methylation difference (calculated by using WGBS data) was the greatest for the DMRs predicted by two methods; interestingly, DMRs predicted by M&M only and DMRs predicted by WGBS only had almost identical average DNA methylation differences, while those predicted by MEDIPS only had smaller DNA methylation differences (Supplemental Fig. S3B).
Overall, we conclude that M&M has high specificity, sensitivity, and reproducibility, and exhibits superior performance in terms of these metrics when compared to a recently published MeDIP-seq analysis method, MEDIPS. We hypothesize that the improved prediction of DMRs when using the M&M algorithm likely results from the integration of complementary measurements of the underlying methylation state. We note that the comparison between M&M and MEDIPS was on different grounds. Adding MRE-seq data to MEDIPS did not further improve MEDIPS’ performance (Supplemental Notes; Supplemental Fig. S4); however, MEDIPS was not designed to work on MRE-seq data. M&M’s superior performance is likely due to both having complementary data sets and a new statistical model designed specifically for this scenario.
Detecting tissue-specific DMRs across four tissue types
We applied M&M to understand how DNA methylation underlies identity at three levels: tissue types, different cell types within tissues, and matched cell types from different individuals. We generated 19 methylomes from embryonic stem cells, adult blood cells, adult breast cells, and fetal brain cells, representing four tissue types. We plotted the P-value distributions generated by each pairwise, genome-wide M&M comparison on 500-bp-sized windows (Fig. 2A; Supplemental Fig. S5). These distributions suggested that methylation differences between tissues outnumber differences between cell types of the same tissue or between the same cell types from two individuals, at least in the context of the current study.
Figure 2.

M&M analyses of DNA methylation differences across multiple tissue types, cell types, and individuals. (A) P-value distributions of M&M predictions between tissue types (green lines), cell types (blue lines), and individuals (red lines). (B) Biclustering analysis of tissue-specific DMRs. (Left panel) Based on RPKM values of MeDIP-seq; (right panel) based on RPKM values of MRE-seq.
We used a subset of the above pairwise comparisons to define known and novel tissue-specific DMRs. We identified genomic windows in which DNA methylation levels were similar between cell types from the same tissue but different from all cell types from the three other tissues. We required a window to have a Q-value of less than 1 × 10⁻⁵ in all comparisons between any cell type of one tissue to all cell types in the three other tissues but to have a Q-value of greater than 1 × 10⁻⁵ in all intra-tissue cell-type comparisons. Based on these criteria, a total of 2775 DMRs were defined as tissue-specific DMRs (Table 1; supporting website http://epigenome.wustl.edu/MnM/). Methylation levels of these DMRs clearly delineated the tissue types, as illustrated by biclustering analysis of MeDIP-seq and MRE-seq in these DMRs (Fig. 2B).
Table 1.
Tissue-specific DMRs
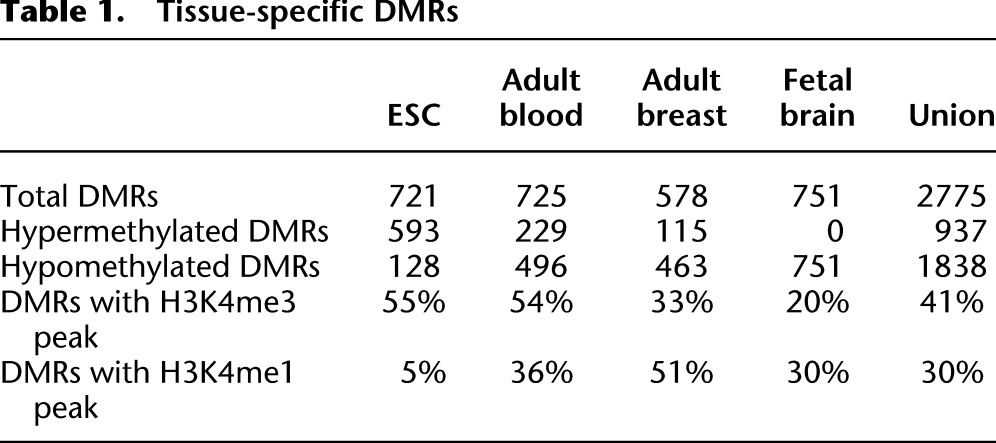
We hypothesized that these tissue-specific DMRs underlie important tissue-specific functions. Therefore, we examined their genomic distribution, chromatin patterns, and the functional enrichment of genes near or containing these DMRs. Of the 721 H1 ESC-specific DMRs, >80% were hypermethylated (Fig. 3A). Forty-eight percent of these overlapped CpG islands, and 23% overlapped gene promoters (Fig. 3A). By our definition, H1 ESC hypermethylated DMRs were hypomethylated in blood, breast, and fetal brain samples. Intriguingly, when we examined the histone modification profiles at H1 ESC-hypermethylated DMRs in blood, breast, and brain samples, we found that >50% were enriched for H3K4me3 signal (a promoter-associated histone modification), while only a small fraction (5%) was enriched for H3K4me1 signal (an enhancer-associated histone modification) (Fig. 4A; Table 1). This suggested that many H1 ESC hypermethylated DMRs were associated with genes that were expressed in differentiated cells but repressed in H1 ESC cells. The apparent gain of H3K4me3, in the absence of gain of H3K4me1, in differentiated cells suggested that the up-regulation of expression of these genes relies on a key mechanism that is promoter-, rather than enhancer-, dependent. These DMRs represent a class of DNA-methylation-silenced promoters that are not marked by bivalent domains in H1 ESC. Genes associated with H1 ESC-specific hypermethylated DMRs enriched for zinc finger DNA binding proteins based on GREAT analysis (Fig. 3B; McLean et al. 2010), while H1 ESC-specific hypomethylated DMRs enriched for “target of Nanog” (Fig. 3C) and enriched for H3K4me3 in ESC (Fig. 4A). Some of the H1 ESC-specific hypermethylated genes may encode general differentiation factors (Supplemental Fig. S6). Interestingly, H1 ESC-specific hypermethylated DMRs displayed a moderate level of H3K4me1 enrichment, which may correlate with a transcriptionally poised state (Fig. 4A).
Figure 3.
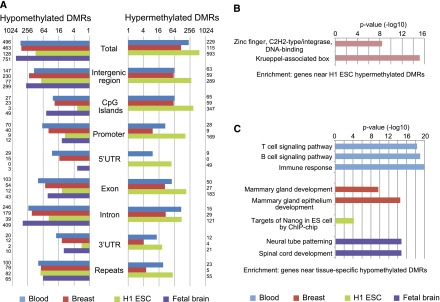
Genomic distribution and functional enrichment of tissue-specific DMR. (A) Genomic distribution of tissue-specific DMRs. (B) Functional enrichment of H1 ESC-specific hypermethylated DMRs by GREAT analysis. (C) Functional enrichment of tissue-specific hypomethylated DMRs by GREAT analysis.
Figure 4.
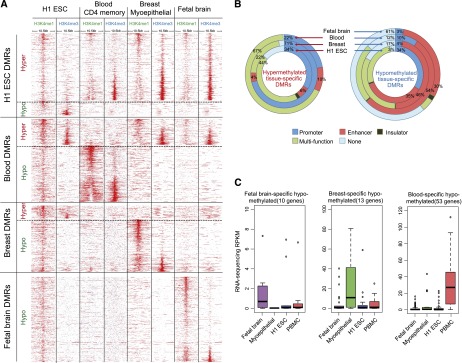
Tissue-specific DMRs are enriched for regulatory histone modifications. (A) H3K4me1 and H3K4me3 profiles at tissue-specific DMRs in H1 ESCs, CD4 memory T cells, breast myoepithelial cells, and fetal brain tissue. (B) ChromHMM regulatory function annotation of tissue-specific DMRs. (C) Expression of genes near tissue-specific DMRs in samples representing different tissues.
In contrast to ESCs, the majority of tissue-specific DMRs identified in blood, breast, and fetal NSC samples were hypomethylated (Table 1; Fig. 3A). Analysis of histone modification profiles for these regions revealed enrichment of H3K4me3 and H3K4me1 in the corresponding samples. GREAT analysis revealed that genes associated with tissue-specific DMRs strongly enriched for functions relevant to each tissue type (Fig. 3C). For example, fetal brain hypomethylated DMRs enriched for “neural tube patterning” (P < 1 × 10⁻¹⁴) and “spinal cord development” (P < 1 × 10⁻¹⁴), whereas breast hypomethylated DMRs enriched for “mammary gland epithelium development” (P < 1 × 10⁻¹⁴) and blood hypomethylated DMRs enriched for “immune response” (P < 1 × 10⁻¹⁹) (Fig. 3C). Interestingly, blood hypermethylated DMRs displayed enrichment of H3K4me3 and H3K4me1 signals in ESC, breast, and fetal brain samples, suggesting that these DMRs were regulatory regions that were specifically turned off in blood cells but were active or permissive for activity in other cell types (Fig. 4A). Representative genes included HOXA5 and ISYNA1 (Supplemental Fig. S7).
These data suggested a strong connection between tissue-specific DNA methylation and tissue-specific gene activity. When hypomethylated, DMRs were almost always associated with tissue-specific gene regulatory elements. As expected, many DMRs in tissue-specific genes occurred at promoters, while others appeared to be associated with enhancers. The majority of tissue-specific DMRs were hypermethylated in embryonic stem cells. They became unmethylated in differentiated cell types, and 41% acquired a promoter-associated histone mark (H3K4me3), while 30% acquired an enhancer-associated histone mark (H3K4me1) (Fig. 4A). These epigenetic changes underscored the importance of DNA methylation in tissue differentiation.
This result was further supported by chromatin state annotation of genomic sequences predicted to be tissue-specific DMRs (Fig. 4B). We obtained chromatin state transition maps generated by chromHMM using nine cell lines (Ernst et al. 2011; Ernst and Kellis 2012; Methods). Almost all tissue-specific DMRs across ESC, fetal brain, breast, and blood were annotated as regulatory elements, including promoters, enhancers, and insulators. The only exception was fetal brain-specific hypomethylated DMRs—while most of these were marked by H3K4me1 in fetal brain samples, 60% did not have chromHMM annotation. This may be explained by the lack of a neural cell type among the nine cell lines used to produce the chromatin state map (Methods). Interestingly, promoters were more enriched in hypermethylated DMRs, while epigenetically defined enhancers dominated the hypomethylated DMR list (Fig. 4B).
Finally, gene expression data also supports a strong association between tissue-specific DNA methylation and tissue-specific gene activity. By using RNA-seq, we profiled transcriptomes of a subset of the samples. Expression levels of genes near tissue-specific DMRs were significantly higher in samples that were hypomethylated at these DMRs (Fig. 4C).
Tissue-specific DMRs that span large chromosomal domains
The majority of the tissue-specific DMRs we identified were relatively small in size, reflecting discrete regulatory elements such as enhancers. We also observed large domains of DNA methylation changes, some of which spanned over 75 kb in length. These distinct DMR patterns suggested that different underlying mechanisms could generate tissue-specific DMRs. We have summarized these large DMR domains in Supplemental Table 2. We describe two such examples below, with another four examples presented in Supplemental Figs. S8 and S9.
We discovered 18 breast-specific DMRs clustered in a 75-kb region on chromosome 22. This large region was hypomethylated in all breast-cell samples analyzed, as evidenced by decreased MeDIP-seq signal and increased MRE-seq signal (Fig.5A; Supplemental Fig. S10A for bisulfite validation). This region spanned six CpG islands and five noncoding genes, including two long noncoding RNA genes, LINC00899 and LOC150381, a putative coding gene C22orf26, and two isoforms of the tumor-suppressor miRNA MIRLET7, MIRLET7A3, and MIRLET7B. The MIRLET7 family was discovered in Caenorhabditis elegans and is functionally conserved from worm to human. The human MIRLET7 family includes 13 isoforms located on nine different chromosomes. Silencing of MIRLET7 plays an important role in breast cancer progression (Yu et al. 2007), as reduced MIRLET7 expression promotes cancer cell invasiveness and metastasis (Qian et al. 2011). We also examined the methylation state of this large region by WGBS from breast cancer cell line HCC1954 (Fig. 5A). Compared to normal human mammary epithelial cells (HMECs), this region was dramatically more methylated in the HCC1954 cancer cell line. This epigenetic event may reflect silencing of the pri-miRNA gene, MIRLET7BHG, that hosts the MIRLET7 genes and potentially contribute to the invasiveness and increased proliferation previously reported in breast cancer cells.
Figure 5.

Identification of tissue-specific DMRs spanning large chromosomal domains. (A) A breast-specific hypomethylated region containing multiple noncoding RNA genes. (Green box) ∼75-kb region hypomethylated in all breast cell types (luminal [Lum], myoepithelial [Myo], and stem cell-enriched [BSC]). (Red box) Hypermethylation events within the same region in the HCC1954 breast tumor cell line. (B) A large H1 ESC-specific hypermethylated chromosomal domain spanning the PCDHG gene cluster. (Orange box) H1 ESC-specific hypermethylated DMRs in the vicinity of the promoters of several PCDHG gene family members.
A 740-kb region on chromosome 5 containing three Protocadherin (PCDH) gene families provided another interesting example where large domain changes consisted of many smaller, local changes (Fig. 5B; Supplemental Fig. S10B for bisulfite validation). Seventy-five of the 83 CpG islands in this region were specifically hypermethylated in H1 ESC. However, in differentiated tissues, these CpG islands gained a strong unmethylated signal, while maintaining a strong methylated signal (i.e., simultaneous high MeDIP-seq signal and high MRE-signal), indicating the CpG islands carry an intermediate methylation level. The PCDH gene family members belong to the cadherin superfamily and are present in all vertebrate genomes and highly conserved in mammals (Wu and Maniatis 1999). Most PCDH family members are clustered in three loci on chromosome 5, and share one highly conserved motif in their promoters (Wu et al. 2001). PCDH genes are known to play important roles in neuronal cell differentiation and brain development (Prasad et al. 2008; Garrett and Weiner 2009; Lin et al. 2010). Previous studies suggest that the expression of each PCDH member is monoallelic and regulated independently (Esumi et al. 2005; Kaneko et al. 2006), an observation that is consistent with our data, since an intermediate methylation level is a signature of monoallelic methylated sites. De novo methylation of the PCDH gene cluster is also associated with tumorigenesis (Novak et al. 2008; Dallosso et al. 2009), raising the possibility that establishing monoallelic methylation constitutes an important event in maintaining differentiated states. In contrast, promoters of the PCDH family are highly methylated in cells of all three germ layers differentiated from mouse ES cells but not in ES cells themselves (Singer 1988). Whether the acquisition by differentiated cells of intermediate DNA methylation patterning in this region is specific to humans and how this phenomenon evolved awaits further investigation.
Cell type-specific DMRs underlie enhancers associated with relevant pathways
Our data set includes three breast cell types (a breast stem cell-enriched population, luminal epithelial cells, and myoepithelial cells) and three blood T cell types (naive CD4+ T cells, memory CD4+ T cells, and naive CD8+ T cells). This presented a unique opportunity to discover cell type-specific DMRs and to compare their epigenomic signature to that of tissue-specific DMRs. To define such cell type-specific DMRs, we required a genomic window to have a Q-value of less than 1 × 10⁻⁵ in all comparisons between two cell types of the same tissue in two independent biological replicates. This analysis revealed that the most striking feature of cell type-specific DMRs is the enrichment of an enhancer chromatin signature. We use the following example to illustrate this discovery.
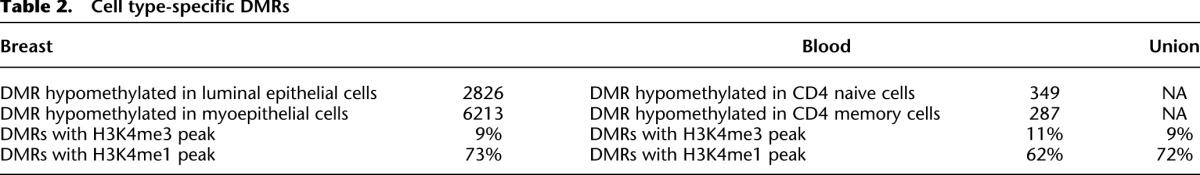
We examined DNA methylation changes that were associated with maturation of naive CD4+ T cells into memory CD4+ T cells in the immune system. In addition to producing cytokines and chemokines, CD4+ T cells also act as mediators for other lymphocytes via cell-cell contact (Swain et al. 2006). During responses to antigens, most CD4+ T cells die within a few days after receiving antigen stimulation, while only a small fraction survives. This small population corresponds to mature memory CD4+ T cells that contribute to later adaptive immune responses and reproduce rapidly upon restimulation of the same antigen. We compared the DNA methylomes of naive CD4+ T cells (CD4N) and memory CD4+ T cells (CD4M) from two individuals to identify cell type-specific DMRs (intra-CD4 DMRs). Compared to CD4N, CD4M cells showed hypomethylation in 349 genomic regions and hypermethylation in 287 regions (Fig. 6A). We detected enrichment of H3K4me1 signal in the majority of intra-CD4 hypomethylated DMRs in the samples where the DMRs are hypomethylated (62%), while a small fraction of DMRs displayed H3K4me3 signal (11%) (Fig. 6B; Table 2). The frequent overlap of intra-CD4 hypomethylated DMRs with enhancers was further supported by chromHMM annotation (Fig. 6D). Histone modification profiling supported that many of the intra-CD4 DMRs are regulatory sites. This is further supported by data from ENCODE, in that 88% of these DMRs directly overlapped DNase I hypersensitivity sites, and 17% directly overlapped EP300 binding sites in at least one of the cell lines assayed by ENCODE (Supplemental Fig. S11; The ENCODE Project Consortium et al. 2012; Thurman et al. 2012). Therefore, we reasoned that the intra-CD4 DMRs would harbor binding sites of relevant transcription factors. Indeed, by examining integrated ENCODE TFBS data, we found significant enrichment of many transcription factor-binding sites in these DMRs (Fig.6E). Binding of transcription factors to genomic DNA motifs is associated with changes in the local epigenetic landscape (Asp et al. 2011; Stadler et al. 2011). Our data further support this type of association at DMRs that define different cell types within breast tissue.
Figure 6.

Cell type-specific DMRs between CD4 naive cells and CD4 memory cells. (A) Genomic distribution of CD4 memory cell hypomethylated DMRs (green) and CD4 naive cell hypomethylated DMRs (red). (B) Histone modification profiles (H3K4me1 and H3K4me3) of DMRs between CD4 memory cells and CD4 naive cells. (C) Functional enrichment in CD4 memory cell (green) and CD4 naive cell hypomethylated DMRs (red). (D) ChromHMM regulatory function annotation of CD4 memory cell DMRs and CD4 naive cell DMRs. (E) TFBS enrichment of CD4 memory cell DMRs (green) and CD4 naive cell DMRs (red).
Table 2.
Cell type-specific DMRs
Functional enrichment analysis (Fig. 6C) of CD4N hypomethylated DMRs identified genes enriched for functions including lymphocyte differentiation and T cell receptor V(D)J recombination. These regions became methylated during the process of CD4+ T cell maturation. Increased CD4M DNA methylation was also observed in genes involved in apoptosis and cellular response to interleukin-4 (IL4). These DNA methylation events were consistent with transitions in cellular function during the maturation process. In contrast, DNA hypomethylation in CD4M was detected in the vicinity of genes involved in the immune system process and activation, and protein synthesis, including protein translation and elongation. Interestingly, some hypomethylated DMRs in CD4M were found to be close to genes that regulate the production of the Th2 cytokine interleukin-4, including the 5′ region of the IL4 gene (Supplemental Fig. S12). As a key factor during CD4+ T cell maturation, IL4 induces long-term proliferation of neonatal T cells and stimulates production of other cytokines (Wu et al. 1994). Some memory CD4+ T cells produce IL4 and perform important immune regulatory functions (Cosmi et al. 2010; Xu et al. 2011).
Several genes important for CD4M function, including NDFIP1, EBI3, SIVA1, and TNFRSF4 (Supplemental Fig. S12), displayed decreased DNA methylation at regions upstream of their respective promoter in CD4M, although the promoter itself was unmethylated in both CD4N and CD4M. These hypomethylated DMRs also gained H3K4me1 signal in CD4M (Supplemental Fig. S12). Therefore, epigenetic regulation of expression of these CD4+ T cell type-specific genes is likely to involve enhancers rather than promoters. Taken together, our data highlight that a majority of cell type-specific DMRs likely correspond to cell type-specific enhancer elements, while tissue-specific DMRs enrich primarily for gene promoters.
DMRs between individuals overlap with gene regulatory elements
Epigenetic polymorphisms, including DNA methylation differences between individuals, are increasingly associated with phenotypic diversity and disease susceptibility (Tost et al. 2006; Baranzini et al. 2010; Coolen et al. 2011; Eichten et al. 2011; Gertz et al. 2011; Gervin et al. 2011). Unlike genetic polymorphisms such as SNPs and copy number variation, epigenetic polymorphisms can be influenced by both genetic and environmental determinants (Anway et al. 2005; Li et al. 2011; Crews et al. 2012; Skinner et al. 2012). In our study, we obtained biological replicates from two individuals for the breast, fetal brain, and blood data sets. We did not address the association between genotype and epigenotype in the current study. Rather, we sought to identify regions of the genome that are hotspots for individual-specific differential methylation by comparing DNA methylomes of the same cell types between different individuals (Table 3).
Table 3.
Individual-specific DMRs

We identified 1032 DMRs between each pair of individuals (inter-individual DMRs) (Fig. 7A). We noticed that 389 of these DMRs overlapped with satellite DNA and microsatellite repeats. This class of DMRs could result from genetic polymorphism (i.e., copy number differences in satellite repeats) among the individuals and not epigenetic polymorphism (Haaf and Willard 1992) or could be known artifacts associated with mapping short reads to satellite repeats. Therefore, we excluded these regions from further analysis (Table 3).
Figure 7.

Individual-specific DMRs. (A) Genomic distribution of individual-specific DMRs identified in blood (blue), breast (red), and fetal brain (green). (B) ChromHMM regulatory function annotation of individual-specific DMRs. (C) Histone modification profiles (H3K4me1 and H3K4me3) of individual-specific DMRs identified in fetal brain. (D) Human Epigenome Browser (Zhou et al. 2011) view of 30 juxtaposed individual DMRs identified in fetal brain with DNA methylation, H3K4me3, and H3K4me1 profiles. (E) Functional enrichment of individual-specific DMRs identified in fetal brain. (F) TFBS enrichment of individual-specific DMRs in fetal brain.
The remaining 643 DMRs, when considered together, did not seem to associate with genes that enrich for any particular function. Nevertheless, more than half of these DMRs were annotated by chromHMM as regulatory elements (Fig. 7B). Interestingly, >40% of the inter-individual DMRs identified using the fetal brain samples (inter-brain DMRs) from two monozygotic twins displayed individual-specific H3K4me1 marks (Fig. 7C,D; Table 3). These inter-brain DMRs strongly enriched for association with genes in brain development (Fig. 7E) and also enriched for transcription factor binding sites (Fig. 7F). Taken together, we hypothesize that at least some of the inter-individual DMRs might influence gene expression in an individual-specific manner and therefore influence particular traits. For example, we found potentially regulatory DMRs in the introns of CYP2D6 and CYP2E1, both of which belong to the cytochrome P450 family and are implicated in metabolizing precarcinogens, drugs, and solvents to reactive metabolites (Agundez 2004; Bozina et al. 2009). Other examples included DMRs located near neuronal specific genes, e.g., FGFR3, a gene that plays an important role in neuronal development (Puligilla et al. 2007), NFIX, a gene that regulates expression of glial fibrillary acidic protein, GFAP (Singh et al. 2011), and NAV1, a member of the neuron navigator family (Supplemental Fig. S13; Maes et al. 2002).
Discussion
DNA methylation plays important roles in cells, including the regulation of genes during development and disease (Robertson 2005; Lister et al. 2009; Deaton et al. 2011; Jones 2012). It has been increasingly associated with tissue-specific gene activity (Kitamura et al. 2007; Illingworth et al. 2008; Maunakea et al. 2010). The technology is now available for studying DNA methylation genome-wide, at high resolution and in a large number of samples, presenting an unprecedented opportunity to map DNA methylation differences between tissues and cells in healthy and diseased states and during development (Bock 2012).
Here, we introduce a novel statistical framework, “M&M,” to detect differentially methylated regions by integrating two next-generation sequencing-based technologies—MeDIP-seq and MRE-seq. MeDIP-seq, or methylated DNA immunoprecipitation followed by sequencing, uses an antibody that recognizes 5-methylcytosines in the genome. Because the MeDIP-seq protocol is straightforward and generates unbiased, cost-effective, and full-genome methylation levels, it is widely used for whole-genome DNA methylation analysis. Several computational tools, including Batman (Down et al. 2008), MEDIPS (Chavez et al. 2010), and MeQA (Huang et al. 2012), were developed to process and analyze MeDIP-seq data. MRE-seq was recently developed as a complementary technique to MeDIP-seq, such that it utilizes methylation-sensitive restriction enzymes to digest genomic DNA and generate DNA fragments where the free ends contain single unmethylated CpGs. Previously, we showed that by combining MeDIP-seq and MRE-seq we can generate genome-wide DNA methylation maps of very high coverage and can identify intermediate and/or monoallelic methylated regions (Harris et al. 2010). We now show that utilizing M&M to combine data from MeDIP-seq and MRE-seq in a statistically rigorous manner provides improved prediction of differentially methylated regions. Since these two methods assay for opposing methylation states, an increase in the signal when using one method is expected to be accompanied by a decrease in the signal when using the other method. The M&M algorithm models the expected MeDIP-seq and MRE-seq values in relation to the numbers of methylated and unmethylated CpGs in any given genomic interval, and unifies these two complementary data types by the relative methylation levels. M&M then detects DMRs by testing for the null hypothesis that the methylation levels of two samples are the same, given the observed MeDIP-seq and MRE-seq data. The complete M&M package is now part of Bioconductor under the name of “methylMnM.”
To benchmark the performance of M&M, we selected two samples (H1 ESC and fetal NSC) for which we had characterized genome-wide DNA methylation profiles using WGBS, MeDIP-seq, and MRE-seq. We applied M&M to discover DMRs between H1 ESC and fetal NSC and compared the results with those obtained by applying MEDIPS, one of the leading software tools currently used for analyzing MeDIP-seq data, on our MeDIP-seq data. M&M displayed superior sensitivity, specificity, and reproducibility as highlighted by a much higher concordance for methylation level differences when compared to those determined by WGBS data (Fig. 1C–E). The addition of MRE-seq data provided independent information about methylation state, which M&M takes advantage of by integrating MeDIP-seq and MRE-seq under the same statistical framework for more accurate DMR detection. It should be noted that the statistical framework can be generalized and can potentially integrate other types of DNA methylation data.
As part of the Roadmap Epigenomics Initiative, we produced a large collection of DNA methylomes using MeDIP-seq and MRE-seq, representing multiple tissue and cell types from multiple individuals. By applying M&M to selected data sets, we were able to create comprehensive lists of DMRs that are either tissue type-, cell type-, or individual-specific. This resource is publicly available through the Wash U Human Epigenome Browser (Zhou et al. 2011, 2013) and the UCSC Genome Browsers (http://VizHub.wustl.edu).
DNA methylation has been investigated for its role in specifying tissue-specific gene expression (Song et al. 2005; Shen et al. 2007; Irizarry et al. 2009; Laurent et al. 2010; Maunakea et al. 2010; Liang et al. 2011; Andersen et al. 2012; Davies et al. 2012). It has long been appreciated that DNA methylation of non-CpG island gene promoters is a durable mechanism that results in repression of genes in specific tissues during development (Lamson and Stockdale 1989; Luo et al. 2000; Winders et al. 2004). Cancer cells also exploit a similar mechanism to turn off tumor suppressor genes (Momparler and Bovenzi 2000; Robertson 2005; Daniel et al. 2011). Promoters and CpG islands have been, therefore, the primary focus of DNA methylation studies. Recently, cell type-specific “lowly methylated regions” (LMRs) distal to genes have been discovered in the mouse genome. These LMRs are created by binding of DNA binding factors outside of promoter regions (Stadler et al. 2011), highlighting the importance of comprehensive comparisons of DNA methylomes and DMR discovery beyond promoters and CpG islands.
Our analysis revealed distinct histone modification and gene regulatory signatures underlying tissue-, cell type-, and individual-specific DMRs. Consistent with our expectations, DNA methylation differences were strongly associated with gene regulatory elements. The majority of the DNA methylation differences were accompanied by differences in the active chromatin marks H3K4me3 and H3K4me1, suggesting that these DMRs overlap promoters and/or enhancers. Genes associated with DMRs strongly enriched for functions relevant to the tissue or cell types in any given comparison. Surprisingly, the proportions of promoter-like DMRs and enhancer-like DMRs were quite different between tissue-specific DMRs and cell type-specific DMRs—about 40% of tissue-specific DMRs were annotated as promoters, while >70% of cell type-specific DMRs were annotated as enhancers (Tables 1, 2). This signature suggests that different mechanisms may establish and maintain DNA methylation patterns during development and differentiation, resulting in different phenotypic consequences. DNA methylation of promoters likely has a strong impact on gene expression, equivalent to an on/off switch that keeps genes in an active state or shuts down gene expression completely. Thus, methylation of gene promoters can be a mechanism for major cell lineage determination. Our most significant finding was that many differentially methylated regions associate with tissue- and cell type-specific enhancers, as determined by histone modifications and chromHMM annotations (Tables 1, 2; Figs. 4, 6B,C, 7B,E). DNA methylation in enhancers may vary with binding of specific transcription factors (Stadler et al. 2011) and also influences transcription factor binding and modulates gene expression. Methylation of enhancers, thus, could provide a mechanism that allows cells to fine-tune gene activity and make a final lineage commitment or maintain a distinct cell fate.
We also identified 307 individual-specific DMRs when comparing the same tissue type (fetal brain tissue) between two monozygotic twins. Interestingly, these DMRs also enriched for strong, individual-specific H3K4me1 enhancer signal, highlighting the potential functional impact of epigenetic variation between genetically identical individuals. Epigenetic polymorphism has attracted enormous interest in recent years. Several recent studies investigating the connection between genetic variation and epigenetic variation revealed that epigenetic polymorphisms are likely the result of a complex interplay between genetic and environmental factors (Anway et al. 2005; Li et al. 2011; Crews et al. 2012; Skinner et al. 2012). Our finding provides additional support for the potential functional impact of epigenetic polymorphisms.
Leveraging new sequencing-based DNA methylome mapping technologies and a novel, integrative statistical framework, we mapped DNA methylation differences across multiple tissues and cell types from multiple individuals at the whole-genome level. Differences in DNA methylation can be tightly associated with gene regulation, impacting regulatory elements such as promoters and enhancers, and defining the cellular epigenetic landscape. Interestingly, the DMRs identified in our study were enriched for evolutionarily conserved sequences (Fig. 8). Many of the functional elements in the human genome have been identified by comparative genomic approaches based on evolutionary principles (Lindblad-Toh et al. 2011). Sequence conservation correlates with conservation of some epigenetic marks, including DNA methylation, between species. Furthermore, conserved localization of epigenetic marks can be used to define regulatory DNA elements (Maunakea et al. 2010; Xiao et al. 2012). Enrichment of conserved sequences in DMRs suggests that these sequences may be under purifying selection and that their regulatory functions may be evolutionarily selected. It would be exciting to examine whether the same principle applies to tissue-, cell type-, and individual-specific DNA methylation for other species.
Figure 8.

Sequence conservation of DMRs. Vertebrate phastCon scores were obtained at 100-bp resolution for each DMR and their respective upstream/downstream 5-kb regions. Averaged scores in each 100-bp window were plotted. (A) Conservation of tissue-specific DMRs. (B) Conservation of cell type-specific DMRs. (C) Conservation of individual-specific DMRs.
Methods
All data were obtained from the NIH Roadmap Epigenomics Mapping Centers’ repository for the human reference epigenome atlas (Bernstein et al. 2010). Experiments were performed under the guidelines of the Roadmap Epigenomics project (http://www.roadmapepigenomics.org/protocols). Specifically, MeDIP-seq and MRE-seq experiments were performed as described previously (Maunakea et al. 2010). ChIP-seq was performed as described in O’Geen et al. (2011). All data have been previously submitted to NCBI (Supplemental Table 1).
M&M statistical model
The complete M&M statistical model derivation, data processing and normalization, and false discovery rate control are described in Supplemental Notes.
Processing of MeDIP-seq and MRE-seq data
The reads were aligned with Bowtie (Langmead et al. 2009) to hg19. MRE reads were normalized to account for differences in enzyme efficiency. Scoring consisted of tabulating reads with CpGs at each fragment end (Maunakea et al. 2010).
Processing of Roadmap Epigenomics histone modification data
H3K4me3 and H3K4me1 ChIP-seq data for relevant cell types were produced as part of the Roadmap Epigenomics project and deposited to GEO (GSE16368). Mapped read density was generated from aligned sequencing reads using customized Perl scripts. Read density overlapping DMRs and their 5-kb upstream/downstream regions were extracted at 50-bp resolution as RPKM values, with histone input data subtracted.
ENCODE HMM chromatin state annotation
ChromHMM annotations for ENCODE cell lines (Ernst et al. 2011) were obtained from the UCSC Genome Browser (Rosenbloom et al. 2012). The nine cell lines are: H1 ESC, GM12878, K562, HepG2, HUVEC, HMEC, HSMM, NHEK, and NHLF. For each DMR, we examined overlapping annotation of “promoter,” “enhancer,” and “insulator” states in these chromHMM maps.
ENCODE DHS and EP300 binding sites data
ENCODE DNase I hypersensitive sites (DHS) and EP300 binding sites data were downloaded from the UCSC Genome Browser ENCODE data portal (Rosenbloom et al. 2012). DHS data contain 999,988 regions, and EP300 binding sites data contain 92,623 regions.
Whole-genome bisulfite sequencing data processing
The whole-genome bisulfite sequencing data for H1 ESC and human fetal brain NSC (sample HuFNSC02) were downloaded from GEO (GSE16368). For validation of methylation changes in each DMR between H1 ESC and HuFNSC02, the averaged methylation difference between all CpG sites in the DMR was calculated.
The whole-genome bisulfite sequencing data for normal breast cells (HMEC) and breast cancer cells (HCC1954) were downloaded from GEO (GSE29127). The raw data were processed and mapped to human genome hg19 assembly using Bismark (Krueger and Andrews 2011).
RNA-seq data processing
RNA-seq data of H1 ESC, fetal brain, myoepithelial cells, and PBMC were downloaded from GEO (GSE16368). Data were processed with Cufflinks (Trapnell et al. 2010) to obtain RPKM values for all RefSeq genes (annotation obtained from UCSC Genome Browser).
Detecting DMRs from WGBS data
WGBS-defined single CpG resolution DNA methylation levels of H1 ESC and fetal NSC were used as input. For each genomic interval, a Student’s t-test was performed on the two groups of methylation levels to obtain a P-value. DMRs were selected based on ranked P-values.
Applying MEDIPS
The MEDIPS package was downloaded from Bioconductor. The command lines utilized were as described in the MEDIPS manual (version 1.0.0) with genomic window size set to 500 bp. DMRs were selected by commands: MEDIPS.selectSignificants(), using the parameters suggested in the manual.
Applying MACS to histone data
The following parameters were used to apply MACS (Zhang et al. 2008) to histone data for the identification of peaks:
A DMR was defined as enriched for histone signal when at least 50% of the DMR overlapped with histone peaks.
ENCODE TFBS enrichment
ENCODE TFBS data were downloaded from the UCSC Genome Browser ENCODE data portal (Rosenbloom et al. 2012). The binding site enrichment score (ES) for each transcription factor with respect to DMRs was calculated as:
where ntfbs is the number of DMRs that contain experimentally annotated TFBS; nDMR is the total number of DMRs; Ntfbs is the number of genomic windows with annotated TFBS; Nall is the number of 500-bp windows in the human genome (hg19).
Genomic features
RepeatMasker annotations, CpG islands, genomic super duplications, 46-way phastCons, and refGene features (including 5′ UTR, exons, introns, and 3′ UTRs) were all downloaded from the UCSC Genome Browser (Kent et al. 2002; Meyer et al. 2012). Promoters were defined as 2.5 kb around the most 5′ transcription start site (2 kb upstream of and 0.5 kb downstream from TSS) of any refGene record. Intergenic regions were defined as regions between neighboring refGene loci.
Gene class enrichment analysis
Gene Ontology (GO) analyses for biological processes were performed using the GREAT package (McLean et al. 2010). Gene regulatory domains were defined by default as the regions spanning 5 kb upstream of and 1 kb downstream from the TSS (regardless of other nearby genes). Gene regulatory domains were extended in both directions to the nearest gene’s basal domain but no more than a maximum extension in one direction. Only categories that were below a false discovery rate of 0.05 were reported.
Bisulfite treatment and library construction for WGBS
One to 5 μg gDNA was sonicated to an approximate size range of 200–400 bp. Size selection was achieved by PAGE gel and yielded DNA fragments of 200–300 bp. DNA was quantified by fluorescent incorporation (Qubit, Invitrogen). The library preparation included end-repair and phosphorylation with NEBNextTM or Illumina Sample Prep Kit reagents and addition of an ‘A’ base to the 3′ end of the DNA fragments. Methylated adapters were ligated and size selection was performed to remove excess free adaptors. The ligated DNA was quantified by Qubit, and ∼100 ng DNA was used for bisulfite conversion. Methylated-adaptor ligated to unmethylated lambda-phage DNA (NEB) was used as an internal control for assessing the rate of bisulfite conversion. The ratio of target library to Lambda was 1600:1. Bisulfite conversion of the methylated adapter-ligated DNA fragments followed the FFPE Tissue Samples Protocol from Qiagen’s Epitect Bisulfite Kit. Cleanup of the bisulfite-converted DNA was performed, and a second round of conversion was applied. Enrichment of adaptor-ligated DNA fragments was accomplished by dividing the template into five aliquots followed by eight cycles of PCR with adaptor primers. Post-PCR size-selection of the PCR products from the five reactions was achieved by PAGE gel. Following 100-bp paired-end sequencing on a HiSeq2000, sequence reads were aligned and processed through the Bismark pipeline.
Sample preparation
Blood
Buffy coats were obtained from the Stanford Blood Center (Palo Alto, CA). Blood was drawn and processed on the same day. Peripheral blood mononuclear cells (PBMC) were isolated by Histopaque 1077 (Sigma-Aldrich) density gradient centrifugation according to the manufacturer’s protocol. Further purification of CD4 memory, CD4 naive, and CD8 naive T lymphocytes was performed using a Robosep instrument and isolation kits for each subpopulation as listed below (STEMCELL Technologies). Total PBMC were karyotyped (Molecular Diagnostic Services, Inc) and analyzed for cell cycle. PBMC and T cell subpopulations were stained with antibodies and analyzed by FACS for purity. Cells were aliquoted for DNA and RNA samples and were washed in PBS. Cell pellets for RNA samples were resuspended in 1 mL TRIzol reagent (Invitrogen), and frozen at −80°C. Cell pellets for DNA samples were flash-frozen in liquid nitrogen and stored at −80°C. Reagents and antibodies:
Anti-CD3 TRI-COLOR, Invitrogen
Anti-CD4 PE, BD Biosciences
Anti-CD8 FITC, BD Biosciences
Anti-CD4 TRI-COLOR, Invitrogen
Anti-CD45RO PE, Invitrogen
Anti-CD45RA FITC, BD Biosciences
Anti-CD8 TRI-COLOR, Invitrogen
EasySep Human Memory CD4 T Cell Enrichment Kit,
EasySep Human Naive CD4+ T Cell Enrichment Kit,
Custom Human Naïve CD8 T Cell Enrichment Kit, STEMCELL Technologies
Breast
Breast tissues were obtained from disease-free, premenopausal women undergoing reduction mammoplasty in accordance with institutionally approved IRB protocol # 10-01563 (previously CHR # 8759-34462-01). All tissues were obtained as de-identified samples and linked only with a minimal data set (age, ethnicity, and in some cases, parity/gravidity). Tissue was dissociated mechanically and enzymatically, as previously described (Romanov et al. 2001). Briefly, tissue was minced and dissociated in RPMI 1640 with L-glutamine and 25 mm HEPES (Fisher, cat. # MT10041CV) supplemented with 10% fetal bovine serum (JR Scientific, Inc., cat. # 43603), 100 U/mL penicillin, 100 μg/mL streptomycin sulfate, 0.25 μg/mL fungizone, gentamycin (Lonza, cat. # CC4081G), 200 U/mL collagenase 2 (Worthington, cat. # CLS-2), and 100 U/mL hyaluronidase (Sigma-Aldrich, cat. # H3506-SG) at 37°C for 16 h. The cell suspension was centrifuged at 1400 rpm for 10 min, followed by a wash with RPMI 1640/10% FBS. Clusters enriched in epithelial cells (referred to as organoids) were recovered after serial filtration through a 150-μm nylon mesh (Fisher, cat. # NC9445658), and a 40-μm nylon mesh (Fisher, cat. # NC9860187). The final filtrate contained primarily mammary stromal cells (fibroblasts, immune cells, and endothelial cells) and some single epithelial cells. Following centrifugation at 1200 rpm for 5 min, the epithelial organoids and filtrate were frozen for long-term storage. The day of cell sorting, epithelial organoids were thawed out and further digested with 0.5 g/L 0.05% trypsin-EDTA and dispase-DNase I (STEMCELL Technologies, cat. # 7913 and # 7900, respectively). Generation of single-cell suspensions was monitored visually. Single-cell suspensions were filtered through a 40-μm cell strainer (Fisher, cat. # 087711), spun down, and allowed to “regenerate” in MEGM medium (Lonza) supplemented with 2% fetal calf serum for 60–90 min at 37°C. This “regeneration” step enables quenching of trypsin and re-expression of the cell surface markers prior to staining, as their extracellular domain had been cleaved by trypsin.
The single-cell suspension obtained as described above was stained for cell sorting with three human-specific primary antibodies, anti-CD10 labeled with PE-Cy7 (BD Biosciences, cat. # 341092) to isolate myoepithelial cells, anti-CD227/MUC1 labeled with FITC (BD Biosciences, cat. # 559774) to isolate luminal epithelial cells, or anti-CD73 labeled with PE (BD Biosciences, cat. # 550257) to isolate a stem cell-enriched cell population, and with biotinylated antibodies for lineage markers, anti-CD2, CD3, CD16, CD64 (BD Biosciences, cat. # 555325, 555338, 555405, and 555526), CD31 (Invitrogen, cat. # MHCD3115), CD45, CD140b (BioLegend, cat. # 304003 and 323604) to specifically remove hematopoietic, endothelial, and leukocyte lineage cells, respectively, by negative selection. Sequential incubation with primary antibodies was performed for 20 min at room temperature in PBS with 1% bovine serum albumin (BSA), followed by washing in PBS with 1% BSA. Biotinylated primary antibodies were revealed with an anti-human secondary antibody labeled with streptavidin-Pacific Blue conjugate (Invitrogen, cat. # S11222). After incubation, cells were washed once in PBS with 1% BSA, and cell sorting was performed using a FACSAria II cell sorter (BD Biosciences).
Fetal brain
Post-mortem human fetal neural tissues were obtained from a case of twin nonsyndrome fetuses whose death was attributed to environmental/placental etiology. Tissues were obtained with appropriate patient consent according to Partner’s Healthcare/Brigham and Women’s Hospital IRB guidelines (Protocol #2010P001144). All samples and tissues were de-identified and linked only with a minimal data set (age, gender, brain location). Fetal brain tissue and fetal neural progenitor cells were derived from manually dissected regions of the brain (telencephalon), specifically the neocortex (pallium; GSM669614, GSM669615) and ganglionic eminences (subpallium; GSM669613). The tissues were minced and dissociated by combination of mechanical agitation (gentleMACS device) during enzymatic treatment with papain, according to the manufacturer’s protocol (Miltenyi Biotec, neural tissue dissociation kit #130-092-628). Cell suspensions were then washed twice in DMEM and plated at low density in human NeuroCult NS-A media (Stem Cell Technology, # 05751) supplemented with heparin, EGF (20 ng/mL) and FGF (10 ng/mL) in ultralow attachment cell culture flasks (Corning, #3814).
ESC H1
Data were obtained from a previous publication (Harris et al. 2010).
Data access
M&M is an open source software. The source code, parameter sets, and instructions, as well as sample data sets, are available at http://epigenome.wustl.edu/MnM/. M&M has been released as an add-on package called “methylMnM” for R 2.12.1 and is freely available from Bioconductor (Gentleman et al. 2004; http://www.bioconductor.org/). A list of tissue-specific, cell-type specific, and individual specific DMRs can be found in the Supplemental Material and at http://epigenome.wustl.edu/MnM/.
Acknowledgments
We thank collaborators in the Reference Epigenome Mapping Centers (REMC), Epigenome Data Analysis and Coordination Center, and NCBI who have generated and processed data used in this project. We acknowledge support from the NIH Roadmap Epigenomics Program, sponsored by the National Institute on Drug Abuse (NIDA) and the National Institute of Environmental Health Sciences (NIEHS). J.F.C., M.H., and T.W. are supported by NIH grant 5U01ES017154. T.W. is supported in part by Basil O’Connor Starter Scholar Research Award Grant no. 5-FY10-491 from the March of Dimes Foundation, the Edward Jr. Mallinckrodt Foundation, P50CA134254, R01HG007354, and a grant from the Foundation for Barnes-Jewish Hospital. J.B.C. is supported by a Career Development Award from the Dermatology Foundation. B.Z. is supported by NIDA’s R25 program DA027995. K.L.L. and C.L.M. are supported by NIH Grants P01CA095616 and P01CA142536 and a grant from the Sontag Foundation. N.L. is supported by NSF-DMS0906023. Y.Z. and Bx.Z. are supported by the Program for the National Science Foundation of China (no. 11271064), New Century Excellent Talents in University (NCET-09-0248), the Program for Changjiang Scholars and Innovative Research Team in University, and the Fund of Jilin Provincial Science & Technology Department (no. 20111804).
Footnotes
[Supplemental material is available for this article.]
Article published online before print. Article, supplemental material, and publication date are at http://www.genome.org/cgi/doi/10.1101/gr.156539.113.
Freely available online through the Genome Research Open Access option.
References
- Agresti A. 2007. An introduction to categorical data analysis, 2nd ed. Wiley, Hoboken, NJ. [Google Scholar]
- Agundez JA 2004. Cytochrome P450 gene polymorphism and cancer. Curr Drug Metab 5: 211–224 [DOI] [PubMed] [Google Scholar]
- Andersen IS, Reiner AH, Aanes H, Alestrom P, Collas P 2012. Developmental features of DNA methylation during activation of the embryonic zebrafish genome. Genome Biol 13: R65. [DOI] [PMC free article] [PubMed] [Google Scholar]
- Anway MD, Cupp AS, Uzumcu M, Skinner MK 2005. Epigenetic transgenerational actions of endocrine disruptors and male fertility. Science 308: 1466–1469 [DOI] [PMC free article] [PubMed] [Google Scholar]
- Asp P, Blum R, Vethantham V, Parisi F, Micsinai M, Cheng J, Bowman C, Kluger Y, Dynlacht BD 2011. Genome-wide remodeling of the epigenetic landscape during myogenic differentiation. Proc Natl Acad Sci 108: E149–E158 [DOI] [PMC free article] [PubMed] [Google Scholar]
- Baranzini SE, Mudge J, van Velkinburgh JC, Khankhanian P, Khrebtukova I, Miller NA, Zhang L, Farmer AD, Bell CJ, Kim RW, et al. 2010. Genome, epigenome and RNA sequences of monozygotic twins discordant for multiple sclerosis. Nature 464: 1351–1356 [DOI] [PMC free article] [PubMed] [Google Scholar]
- Bernstein BE, Stamatoyannopoulos JA, Costello JF, Ren B, Milosavljevic A, Meissner A, Kellis M, Marra MA, Beaudet AL, Ecker JR, et al. 2010. The NIH Roadmap Epigenomics Mapping Consortium. Nat Biotechnol 28: 1045–1048 [DOI] [PMC free article] [PubMed] [Google Scholar]
- Bock C 2012. Analysing and interpreting DNA methylation data. Nat Rev Genet 13: 705–719 [DOI] [PubMed] [Google Scholar]
- Bock C, Tomazou EM, Brinkman AB, Muller F, Simmer F, Gu H, Jager N, Gnirke A, Stunnenberg HG, Meissner A 2010. Quantitative comparison of genome-wide DNA methylation mapping technologies. Nat Biotechnol 28: 1106–1114 [DOI] [PMC free article] [PubMed] [Google Scholar]
- Booth MJ, Branco MR, Ficz G, Oxley D, Krueger F, Reik W, Balasubramanian S 2012. Quantitative sequencing of 5-methylcytosine and 5-hydroxymethylcytosine at single-base resolution. Science 336: 934–937 [DOI] [PubMed] [Google Scholar]
- Boyes J, Bird A 1991. DNA methylation inhibits transcription indirectly via a methyl-CpG binding protein. Cell 64: 1123–1134 [DOI] [PubMed] [Google Scholar]
- Bozina N, Bradamante V, Lovric M 2009. Genetic polymorphism of metabolic enzymes P450 (CYP) as a susceptibility factor for drug response, toxicity, and cancer risk. Arh Hig Rada Toksikol 60: 217–242 [DOI] [PubMed] [Google Scholar]
- Chavez L, Jozefczuk J, Grimm C, Dietrich J, Timmermann B, Lehrach H, Herwig R, Adjaye J 2010. Computational analysis of genome-wide DNA methylation during the differentiation of human embryonic stem cells along the endodermal lineage. Genome Res 20: 1441–1450 [DOI] [PMC free article] [PubMed] [Google Scholar]
- Cokus SJ, Feng S, Zhang X, Chen Z, Merriman B, Haudenschild CD, Pradhan S, Nelson SF, Pellegrini M, Jacobsen SE 2008. Shotgun bisulphite sequencing of the Arabidopsis genome reveals DNA methylation patterning. Nature 452: 215–219 [DOI] [PMC free article] [PubMed] [Google Scholar]
- Coolen MW, Statham AL, Qu W, Campbell MJ, Henders AK, Montgomery GW, Martin NG, Clark SJ 2011. Impact of the genome on the epigenome is manifested in DNA methylation patterns of imprinted regions in monozygotic and dizygotic twins. PLoS ONE 6: e25590. [DOI] [PMC free article] [PubMed] [Google Scholar]
- Cosmi L, Maggi L, Santarlasci V, Capone M, Cardilicchia E, Frosali F, Querci V, Angeli R, Matucci A, Fambrini M et al. 2010. Identification of a novel subset of human circulating memory CD4+ T cells that produce both IL-17A and IL-4. J Allergy Clin Immunol 125: 222–230 [DOI] [PubMed] [Google Scholar]
- Crews D, Gillette R, Scarpino SV, Manikkam M, Savenkova MI, Skinner MK 2012. Epigenetic transgenerational inheritance of altered stress responses. Proc Natl Acad Sci 109: 9143–9148 [DOI] [PMC free article] [PubMed] [Google Scholar]
- Dallosso AR, Hancock AL, Szemes M, Moorwood K, Chilukamarri L, Tsai HH, Sarkar A, Barasch J, Vuononvirta R, Jones C, et al. 2009. Frequent long-range epigenetic silencing of protocadherin gene clusters on chromosome 5q31 in Wilms’ tumor. PLoS Genet 5: e1000745. [DOI] [PMC free article] [PubMed] [Google Scholar]
- Daniel FI, Cherubini K, Yurgel LS, de Figueiredo MA, Salum FG 2011. The role of epigenetic transcription repression and DNA methyltransferases in cancer. Cancer 117: 677–687 [DOI] [PubMed] [Google Scholar]
- Davies MN, Volta M, Pidsley R, Lunnon K, Dixit A, Lovestone S, Coarfa C, Harris RA, Milosavljevic A, Troakes C, et al. 2012. Functional annotation of the human brain methylome identifies tissue-specific epigenetic variation across brain and blood. Genome Biol 13: R43. [DOI] [PMC free article] [PubMed] [Google Scholar]
- Day JJ, Sweatt JD 2011. Epigenetic mechanisms in cognition. Neuron 70: 813–829 [DOI] [PMC free article] [PubMed] [Google Scholar]
- Deaton AM, Webb S, Kerr AR, Illingworth RS, Guy J, Andrews R, Bird A 2011. Cell type-specific DNA methylation at intragenic CpG islands in the immune system. Genome Res 21: 1074–1086 [DOI] [PMC free article] [PubMed] [Google Scholar]
- Down TA, Rakyan VK, Turner DJ, Flicek P, Li H, Kulesha E, Graf S, Johnson N, Herrero J, Tomazou EM, et al. 2008. A Bayesian deconvolution strategy for immunoprecipitation-based DNA methylome analysis. Nat Biotechnol 26: 779–785 [DOI] [PMC free article] [PubMed] [Google Scholar]
- Eckhardt F, Lewin J, Cortese R, Rakyan VK, Attwood J, Burger M, Burton J, Cox TV, Davies R, Down TA, et al. 2006. DNA methylation profiling of human chromosomes 6, 20 and 22. Nat Genet 38: 1378–1385 [DOI] [PMC free article] [PubMed] [Google Scholar]
- Eichten SR, Swanson-Wagner RA, Schnable JC, Waters AJ, Hermanson PJ, Liu S, Yeh CT, Jia Y, Gendler K, Freeling M, et al. 2011. Heritable epigenetic variation among maize inbreds. PLoS Genet 7: e1002372. [DOI] [PMC free article] [PubMed] [Google Scholar]
- The ENCODE Project Consortium 2012. An integrated encyclopedia of DNA elements in the human genome. Nature 489: 57–74 [DOI] [PMC free article] [PubMed] [Google Scholar]
- Ernst J, Kellis M 2012. ChromHMM: Automating chromatin-state discovery and characterization. Nat Methods 9: 215–216 [DOI] [PMC free article] [PubMed] [Google Scholar]
- Ernst J, Kheradpour P, Mikkelsen TS, Shoresh N, Ward LD, Epstein CB, Zhang X, Wang L, Issner R, Coyne M, et al. 2011. Mapping and analysis of chromatin state dynamics in nine human cell types. Nature 473: 43–49 [DOI] [PMC free article] [PubMed] [Google Scholar]
- Esumi S, Kakazu N, Taguchi Y, Hirayama T, Sasaki A, Hirabayashi T, Koide T, Kitsukawa T, Hamada S, Yagi T 2005. Monoallelic yet combinatorial expression of variable exons of the protocadherin-α gene cluster in single neurons. Nat Genet 37: 171–176 [DOI] [PubMed] [Google Scholar]
- Garrett AM, Weiner JA 2009. Control of CNS synapse development by γ-protocadherin-mediated astrocyte–neuron contact. J Neurosci 29: 11723–11731 [DOI] [PMC free article] [PubMed] [Google Scholar]
- Gentleman RC, Carey VJ, Bates DM, Bolstad B, Dettling M, Dudoit S, Ellis B, Gautier L, Ge Y, Gentry J, et al. 2004. Bioconductor: Open software development for computational biology and bioinformatics. Genome Biol 5: R80. [DOI] [PMC free article] [PubMed] [Google Scholar]
- Gertz J, Varley KE, Reddy TE, Bowling KM, Pauli F, Parker SL, Kucera KS, Willard HF, Myers RM 2011. Analysis of DNA methylation in a three-generation family reveals widespread genetic influence on epigenetic regulation. PLoS Genet 7: e1002228. [DOI] [PMC free article] [PubMed] [Google Scholar]
- Gervin K, Hammero M, Akselsen HE, Moe R, Nygard H, Brandt I, Gjessing HK, Harris JR, Undlien DE, Lyle R 2011. Extensive variation and low heritability of DNA methylation identified in a twin study. Genome Res 21: 1813–1821 [DOI] [PMC free article] [PubMed] [Google Scholar]
- Haaf T, Willard HF 1992. Organization, polymorphism, and molecular cytogenetics of chromosome-specific α-satellite DNA from the centromere of chromosome 2. Genomics 13: 122–128 [DOI] [PubMed] [Google Scholar]
- Harris RA, Wang T, Coarfa C, Nagarajan RP, Hong C, Downey SL, Johnson BE, Fouse SD, Delaney A, Zhao Y, et al. 2010. Comparison of sequencing-based methods to profile DNA methylation and identification of monoallelic epigenetic modifications. Nat Biotechnol 28: 1097–1105 [DOI] [PMC free article] [PubMed] [Google Scholar]
- Hu JX, Zhao HY, Zhou HH 2010. False discovery rate control with groups. J Am Stat Assoc 105: 1215–1227 [DOI] [PMC free article] [PubMed] [Google Scholar]
- Huang Y, Pastor WA, Shen Y, Tahiliani M, Liu DR, Rao A 2010. The behaviour of 5-hydroxymethylcytosine in bisulfite sequencing. PLoS ONE 5: e8888. [DOI] [PMC free article] [PubMed] [Google Scholar]
- Huang J, Renault V, Sengenes J, Touleimat N, Michel S, Lathrop M, Tost J 2012. MeQA: A pipeline for MeDIP-seq data quality assessment and analysis. Bioinformatics 28: 587–588 [DOI] [PubMed] [Google Scholar]
- Illingworth R, Kerr A, Desousa D, Jorgensen H, Ellis P, Stalker J, Jackson D, Clee C, Plumb R, Rogers J, et al. 2008. A novel CpG island set identifies tissue-specific methylation at developmental gene loci. PLoS Biol 6: e22. [DOI] [PMC free article] [PubMed] [Google Scholar]
- Irizarry RA, Ladd-Acosta C, Wen B, Wu Z, Montano C, Onyango P, Cui H, Gabo K, Rongione M, Webster M, et al. 2009. The human colon cancer methylome shows similar hypo- and hypermethylation at conserved tissue-specific CpG island shores. Nat Genet 41: 178–186 [DOI] [PMC free article] [PubMed] [Google Scholar]
- Jones PA 2012. Functions of DNA methylation: Islands, start sites, gene bodies and beyond. Nat Rev Genet 13: 484–492 [DOI] [PubMed] [Google Scholar]
- Kaneko R, Kato H, Kawamura Y, Esumi S, Hirayama T, Hirabayashi T, Yagi T 2006. Allelic gene regulation of Pcdh-α and Pcdh-γ clusters involving both monoallelic and biallelic expression in single Purkinje cells. J Biol Chem 281: 30551–30560 [DOI] [PubMed] [Google Scholar]
- Kent WJ, Sugnet CW, Furey TS, Roskin KM, Pringle TH, Zahler AM, Haussler D 2002. The human genome browser at UCSC. Genome Res 12: 996–1006 [DOI] [PMC free article] [PubMed] [Google Scholar]
- Khulan B, Thompson RF, Ye K, Fazzari MJ, Suzuki M, Stasiek E, Figueroa ME, Glass JL, Chen Q, Montagna C, et al. 2006. Comparative isoschizomer profiling of cytosine methylation: The HELP assay. Genome Res 16: 1046–1055 [DOI] [PMC free article] [PubMed] [Google Scholar]
- Kitamura E, Igarashi J, Morohashi A, Hida N, Oinuma T, Nemoto N, Song F, Ghosh S, Held WA, Yoshida-Noro C, et al. 2007. Analysis of tissue-specific differentially methylated regions (TDMs) in humans. Genomics 89: 326–337 [DOI] [PMC free article] [PubMed] [Google Scholar]
- Krueger F, Andrews SR 2011. Bismark: A flexible aligner and methylation caller for Bisulfite-Seq applications. Bioinformatics 27: 1571–1572 [DOI] [PMC free article] [PubMed] [Google Scholar]
- Laird PW 2010. Principles and challenges of genomewide DNA methylation analysis. Nat Rev Genet 11: 191–203 [DOI] [PubMed] [Google Scholar]
- Lamson G, Stockdale FE 1989. Developmental and muscle-specific changes in methylation of the myosin light chain LC1f and LC3f promoters during avian myogenesis. Dev Biol 132: 62–68 [DOI] [PubMed] [Google Scholar]
- Langmead B, Trapnell C, Pop M, Salzberg SL 2009. Ultrafast and memory-efficient alignment of short DNA sequences to the human genome. Genome Biol 10: R25. [DOI] [PMC free article] [PubMed] [Google Scholar]
- Laurent L, Wong E, Li G, Huynh T, Tsirigos A, Ong CT, Low HM, Kin Sung KW, Rigoutsos I, Loring J, et al. 2010. Dynamic changes in the human methylome during differentiation. Genome Res 20: 320–331 [DOI] [PMC free article] [PubMed] [Google Scholar]
- Lehmann EL, Romano JP 2005. Testing statistical hypotheses, 3rd ed. Springer, New York [Google Scholar]
- Li CC, Cropley JE, Cowley MJ, Preiss T, Martin DI, Suter CM 2011. A sustained dietary change increases epigenetic variation in isogenic mice. PLoS Genet 7: e1001380. [DOI] [PMC free article] [PubMed] [Google Scholar]
- Liang P, Song F, Ghosh S, Morien E, Qin M, Mahmood S, Fujiwara K, Igarashi J, Nagase H, Held WA 2011. Genome-wide survey reveals dynamic widespread tissue-specific changes in DNA methylation during development. BMC Genomics 12: 231. [DOI] [PMC free article] [PubMed] [Google Scholar]
- Lin C, Meng S, Zhu T, Wang X 2010. PDCD10/CCM3 acts downstream of γ-protocadherins to regulate neuronal survival. J Biol Chem 285: 41675–41685 [DOI] [PMC free article] [PubMed] [Google Scholar]
- Lindblad-Toh K, Garber M, Zuk O, Lin MF, Parker BJ, Washietl S, Kheradpour P, Ernst J, Jordan G, Mauceli E, et al. 2011. A high-resolution map of human evolutionary constraint using 29 mammals. Nature 478: 476–482 [DOI] [PMC free article] [PubMed] [Google Scholar]
- Lister R, Pelizzola M, Dowen RH, Hawkins RD, Hon G, Tonti-Filippini J, Nery JR, Lee L, Ye Z, Ngo QM, et al. 2009. Human DNA methylomes at base resolution show widespread epigenomic differences. Nature 462: 315–322 [DOI] [PMC free article] [PubMed] [Google Scholar]
- Luo M, Bilodeau P, Dennis ES, Peacock WJ, Chaudhury A 2000. Expression and parent-of-origin effects for FIS2, MEA, and FIE in the endosperm and embryo of developing Arabidopsis seeds. Proc Natl Acad Sci 97: 10637–10642 [DOI] [PMC free article] [PubMed] [Google Scholar]
- Maes T, Barcelo A, Buesa C 2002. Neuron navigator: A human gene family with homology to unc-53, a cell guidance gene from Caenorhabditis elegans. Genomics 80: 21–30 [DOI] [PubMed] [Google Scholar]
- Maunakea AK, Nagarajan RP, Bilenky M, Ballinger TJ, D’Souza C, Fouse SD, Johnson BE, Hong C, Nielsen C, Zhao Y, et al. 2010. Conserved role of intragenic DNA methylation in regulating alternative promoters. Nature 466: 253–257 [DOI] [PMC free article] [PubMed] [Google Scholar]
- McLean CY, Bristor D, Hiller M, Clarke SL, Schaar BT, Lowe CB, Wenger AM, Bejerano G 2010. GREAT improves functional interpretation of cis-regulatory regions. Nat Biotechnol 28: 495–501 [DOI] [PMC free article] [PubMed] [Google Scholar]
- Meissner A, Gnirke A, Bell GW, Ramsahoye B, Lander ES, Jaenisch R 2005. Reduced representation bisulfite sequencing for comparative high-resolution DNA methylation analysis. Nucleic Acids Res 33: 5868–5877 [DOI] [PMC free article] [PubMed] [Google Scholar]
- Meissner A, Mikkelsen TS, Gu H, Wernig M, Hanna J, Sivachenko A, Zhang X, Bernstein BE, Nusbaum C, Jaffe DB, et al. 2008. Genome-scale DNA methylation maps of pluripotent and differentiated cells. Nature 454: 766–770 [DOI] [PMC free article] [PubMed] [Google Scholar]
- Meyer LR, Zweig AS, Hinrichs AS, Karolchik D, Kuhn RM, Wong M, Sloan CA, Rosenbloom KR, Roe G, Rhead B, et al. 2012. The UCSC Genome Browser database: Extensions and updates 2013. Nucleic Acids Res 41: D64–D69 [DOI] [PMC free article] [PubMed] [Google Scholar]
- Momparler RL, Bovenzi V 2000. DNA methylation and cancer. J Cell Physiol 183: 145–154 [DOI] [PubMed] [Google Scholar]
- Novak P, Jensen T, Oshiro MM, Watts GS, Kim CJ, Futscher BW 2008. Agglomerative epigenetic aberrations are a common event in human breast cancer. Cancer Res 68: 8616–8625 [DOI] [PMC free article] [PubMed] [Google Scholar]
- O’Geen H, Echipare L, Farnham PJ 2011. Using ChIP-seq technology to generate high-resolution profiles of histone modifications. Methods Mol Biol 791: 265–286 [DOI] [PMC free article] [PubMed] [Google Scholar]
- Pelizzola M, Koga Y, Urban AE, Krauthammer M, Weissman S, Halaban R, Molinaro AM 2008. MEDME: An experimental and analytical methodology for the estimation of DNA methylation levels based on microarray derived MeDIP-enrichment. Genome Res 18: 1652–1659 [DOI] [PMC free article] [PubMed] [Google Scholar]
- Prasad T, Wang X, Gray PA, Weiner JA 2008. A differential developmental pattern of spinal interneuron apoptosis during synaptogenesis: Insights from genetic analyses of the protocadherin-γ gene cluster. Development 135: 4153–4164 [DOI] [PMC free article] [PubMed] [Google Scholar]
- Puligilla C, Feng F, Ishikawa K, Bertuzzi S, Dabdoub A, Griffith AJ, Fritzsch B, Kelley MW 2007. Disruption of fibroblast growth factor receptor 3 signaling results in defects in cellular differentiation, neuronal patterning, and hearing impairment. Dev Dyn 236: 1905–1917 [DOI] [PMC free article] [PubMed] [Google Scholar]
- Qian P, Zuo Z, Wu Z, Meng X, Li G, Wu Z, Zhang W, Tan S, Pandey V, Yao Y, et al. 2011. Pivotal role of reduced let-7g expression in breast cancer invasion and metastasis. Cancer Res 71: 6463–6474 [DOI] [PubMed] [Google Scholar]
- Robertson KD 2005. DNA methylation and human disease. Nat Rev Genet 6: 597–610 [DOI] [PubMed] [Google Scholar]
- Robinson MD, Oshlack A 2010. A scaling normalization method for differential expression analysis of RNA-seq data. Genome Biol 11: R25. [DOI] [PMC free article] [PubMed] [Google Scholar]
- Robinson MD, Statham AL, Speed TP, Clark SJ 2010. Protocol matters: Which methylome are you actually studying? Epigenomics 2: 587–598 [DOI] [PMC free article] [PubMed] [Google Scholar]
- Romanov SR, Kozakiewicz BK, Holst CR, Stampfer MR, Haupt LM, Tlsty TD 2001. Normal human mammary epithelial cells spontaneously escape senescence and acquire genomic changes. Nature 409: 633–637 [DOI] [PubMed] [Google Scholar]
- Rosenbloom KR, Dreszer TR, Long JC, Malladi VS, Sloan CA, Raney BJ, Cline MS, Karolchik D, Barber GP, Clawson H, et al. 2012. ENCODE whole-genome data in the UCSC Genome Browser: Update 2012. Nucleic Acids Res 40: D912–D917 [DOI] [PMC free article] [PubMed] [Google Scholar]
- Serre D, Lee BH, Ting AH 2009. MBD-isolated Genome Sequencing provides a high-throughput and comprehensive survey of DNA methylation in the human genome. Nucleic Acids Res 38: 391–399 [DOI] [PMC free article] [PubMed] [Google Scholar]
- Shen L, Kondo Y, Guo Y, Zhang J, Zhang L, Ahmed S, Shu J, Chen X, Waterland RA, Issa JP 2007. Genome-wide profiling of DNA methylation reveals a class of normally methylated CpG island promoters. PLoS Genet 3: 2023–2036 [DOI] [PMC free article] [PubMed] [Google Scholar]
- Singer J 1988. Cephalometric findings. Am J Orthod Dentofacial Orthop 94: 443–444 [DOI] [PubMed] [Google Scholar]
- Singh SK, Bhardwaj R, Wilczynska KM, Dumur CI, Kordula T 2011. A complex of nuclear factor I-X3 and STAT3 regulates astrocyte and glioma migration through the secreted glycoprotein YKL-40. J Biol Chem 286: 39893–39903 [DOI] [PMC free article] [PubMed] [Google Scholar]
- Skinner MK, Mohan M, Haque MM, Zhang B, Savenkova MI 2012. Epigenetic transgenerational inheritance of somatic transcriptomes and epigenetic control regions. Genome Biol 13: R91. [DOI] [PMC free article] [PubMed] [Google Scholar]
- Song F, Smith JF, Kimura MT, Morrow AD, Matsuyama T, Nagase H, Held WA 2005. Association of tissue-specific differentially methylated regions (TDMs) with differential gene expression. Proc Natl Acad Sci 102: 3336–3341 [DOI] [PMC free article] [PubMed] [Google Scholar]
- Stadler MB, Murr R, Burger L, Ivanek R, Lienert F, Scholer A, van Nimwegen E, Wirbelauer C, Oakeley EJ, Gaidatzis D, et al. 2011. DNA-binding factors shape the mouse methylome at distal regulatory regions. Nature 480: 490–495 [DOI] [PubMed] [Google Scholar]
- Stevens M, Cheng JB, Li D, Xie M, Hong C, Maire CL, Ligon KL, Hirst M, Marra MA, Costello JF, et al. 2013. Estimating absolute methylation levels at single-CpG resolution from methylation enrichment and restriction enzyme sequencing methods. Genome Res (this issue). doi: 10.1101/gr.152231.112. [DOI] [PMC free article] [PubMed] [Google Scholar]
- Suzuki MM, Bird A 2008. DNA methylation landscapes: Provocative insights from epigenomics. Nat Rev Genet 9: 465–476 [DOI] [PubMed] [Google Scholar]
- Suzuki M, Greally JM 2010. DNA methylation profiling using HpaII tiny fragment enrichment by ligation-mediated PCR (HELP). Methods 52: 218–222 [DOI] [PMC free article] [PubMed] [Google Scholar]
- Swain SL, Agrewala JN, Brown DM, Jelley-Gibbs DM, Golech S, Huston G, Jones SC, Kamperschroer C, Lee WH, McKinstry KK, et al. 2006. CD4+ T-cell memory: Generation and multi-faceted roles for CD4+ T cells in protective immunity to influenza. Immunol Rev 211: 8–22 [DOI] [PMC free article] [PubMed] [Google Scholar]
- Thurman RE, Rynes E, Humbert R, Vierstra J, Maurano MT, Haugen E, Sheffield NC, Stergachis AB, Wang H, Vernot B, et al. 2012. The accessible chromatin landscape of the human genome. Nature 489: 75–82 [DOI] [PMC free article] [PubMed] [Google Scholar]
- Tost J, Jammes H, Dupont JM, Buffat C, Robert B, Mignot TM, Mondon F, Carbonne B, Simeoni U, Grange G, et al. 2006. Non-random, individual-specific methylation profiles are present at the sixth CTCF binding site in the human H19/IGF2 imprinting control region. Nucleic Acids Res 34: 5438–5448 [DOI] [PMC free article] [PubMed] [Google Scholar] [Retracted]
- Trapnell C, Williams BA, Pertea G, Mortazavi A, Kwan G, van Baren MJ, Salzberg SL, Wold BJ, Pachter L 2010. Transcript assembly and quantification by RNA-Seq reveals unannotated transcripts and isoform switching during cell differentiation. Nat Biotechnol 28: 511–515 [DOI] [PMC free article] [PubMed] [Google Scholar]
- Watt F, Molloy PL 1988. Cytosine methylation prevents binding to DNA of a HeLa cell transcription factor required for optimal expression of the adenovirus major late promoter. Genes Dev 2: 1136–1143 [DOI] [PubMed] [Google Scholar]
- Weber M, Davies JJ, Wittig D, Oakeley EJ, Haase M, Lam WL, Schubeler D 2005. Chromosome-wide and promoter-specific analyses identify sites of differential DNA methylation in normal and transformed human cells. Nat Genet 37: 853–862 [DOI] [PubMed] [Google Scholar]
- Winders BR, Schwartz RH, Bruniquel D 2004. A distinct region of the murine IFN-γ promoter is hypomethylated from early T cell development through mature naive and Th1 cell differentiation, but is hypermethylated in Th2 cells. J Immunol 173: 7377–7384 [DOI] [PubMed] [Google Scholar]
- Wu Q, Maniatis T 1999. A striking organization of a large family of human neural cadherin-like cell adhesion genes. Cell 97: 779–790 [DOI] [PubMed] [Google Scholar]
- Wu CY, Demeure CE, Gately M, Podlaski F, Yssel H, Kiniwa M, Delespesse G 1994. In vitro maturation of human neonatal CD4 T lymphocytes. I. Induction of IL-4-producing cells after long-term culture in the presence of IL-4 plus either IL-2 or IL-12. J Immunol 152: 1141–1153 [PubMed] [Google Scholar]
- Wu Q, Zhang T, Cheng JF, Kim Y, Grimwood J, Schmutz J, Dickson M, Noonan JP, Zhang MQ, Myers RM, et al. 2001. Comparative DNA sequence analysis of mouse and human protocadherin gene clusters. Genome Res 11: 389–404 [DOI] [PMC free article] [PubMed] [Google Scholar]
- Xiao S, Xie D, Cao X, Yu P, Xing X, Chen CC, Musselman M, Xie M, West FD, Lewin HA, et al. 2012. Comparative epigenomic annotation of regulatory DNA. Cell 149: 1381–1392 [DOI] [PMC free article] [PubMed] [Google Scholar]
- Xu X, Guo Z, Jiang X, Yao Y, Gao Q, Ding Y, Cao X 2011. Regulatory dendritic cells program generation of interleukin-4-producing alternative memory CD4 T cells with suppressive activity. Blood 117: 1218–1227 [DOI] [PubMed] [Google Scholar]
- Yu F, Yao H, Zhu P, Zhang X, Pan Q, Gong C, Huang Y, Hu X, Su F, Lieberman J, et al. 2007. let-7 regulates self renewal and tumorigenicity of breast cancer cells. Cell 131: 1109–1123 [DOI] [PubMed] [Google Scholar]
- Yu M, Hon GC, Szulwach KE, Song CX, Zhang L, Kim A, Li X, Dai Q, Shen Y, Park B, et al. 2012. Base-resolution analysis of 5-hydroxymethylcytosine in the mammalian genome. Cell 149: 1368–1380 [DOI] [PMC free article] [PubMed] [Google Scholar]
- Zhang Y, Liu T, Meyer CA, Eeckhoute J, Johnson DS, Bernstein BE, Nusbaum C, Myers RM, Brown M, Li W, et al. 2008. Model-based analysis of ChIP-Seq (MACS). Genome Biol 9: R137. [DOI] [PMC free article] [PubMed] [Google Scholar]
- Zhou X, Maricque B, Xie M, Li D, Sundaram V, Martin EA, Koebbe BC, Nielsen C, Hirst M, Farnham P, et al. 2011. The Human Epigenome Browser at Washington University. Nat Methods 8: 989–990 [DOI] [PMC free article] [PubMed] [Google Scholar]
- Zhou X, Lowdon RF, Li D, Lawson H, Madden P, Costello JF, Wang T 2013. Exploring long-range genome interactions using the WashU Epigenome Browser. Nat Methods 10: 375–376 [DOI] [PMC free article] [PubMed] [Google Scholar]