Abstract
The lead–zinc industry in the Bukowno region of southern Poland has polluted the surface layer of the surrounding soils mainly with lead (Pb), cadmium (Cd), zinc (Zn), arsenic (As), and thallium (Tl). Analysis of six soil profiles, taken on the east side of the postflotation waste site of the Mining and Metallurgical Plants ZGH "Bolesław" in Bukowno, showed that they were podzol soils, taking form of loose sands with neutral pH and reducing conditions. Concentration of organic matter in the horizons ranged from 2 to 80 %. The main components of the mineral soil were quartz, carbonates, K-feldspars, plagioclases, and micas (sericite). The highest total concentrations of metals were found in the O, A, and B horizons. Over 90 % of the Cd content, 80 % of the Pb content, 60 % of the Zn content, ∼60 % of the Tl content, and 20 % of the As content occurred as mobile forms. The corresponding total concentrations were 10 mg/kg Cd, 922 mg/kg Pb, 694 mg/kg Zn, <1 mg/kg Tl, and <5 mg/kg As. This can potentially be taken up from the soil and transported in the trophic chain. Comparing the total metal content with the legal limits in Poland, it is observed, that the investigated soils exceeded the permissible levels of Cd, Pb, and Zn for agricultural soils. Arsenic and Tl are not reflected in the chemical quality of soil classifications.
Keywords: Heavy metals, Soil contamination, Soil profiles, Flotation wastes
Introduction
Heavy metal investigations are very important scientific issue in Poland. That is because of the fact that manufacturing causes the contamination of the different environmental components. Moreover, research on metals are a challenge for scientist because of its complexity concerning methods of their determination, speciation analysis, toxicity for living organisms, transformation and migration in the environment, methods of monitoring, and remediation strategies (Szyczewski et al. 2009). Especially the Bukowno region is an area contaminated with heavy metals, mainly zinc (Zn), lead (Pb), and cadmium (Cd), but also thallium (Tl) and arsenic (As). This is due to the exploitation and processing of Zn–Pb ores since the eleventh century, as well as movements of pollutants from ore outcrops of Triassic dolomites in the Olkusz vicinity. Podzol and podzolic soils, limestone soil, and fawn dominate in the studied area. These soils are loose sands and light loamy sands. The presence of primary and secondary minerals of Zn, iron (Fe), and Pb are found in these soils (Gruszczyński et al. 1990; Trafas et al. 1990; Cabała 2009; Góralski 2005; Urbański 2008; Kicińska 2009).
One of the major pollution sources in the area is the flotation waste site arising from the processing of Zn–Pb ores in the Mining and Metallurgical Plant ZGH “Bolesław” in Bukowno. In the landfill, 1.5–1.6 million Mg of flotation wastes containing 0.92–1.32 % Zn and 0.06–0.72 % Pb are deposited annually. The estimated content of the accumulated metals is 250.5 Gg of Zn, 117.7 Gg of Pb, 13 Gg of As, and 2 Gg of Cd (Górecka et al. 1994; Sikora et al. 1996). Since the beginning of the waste deposition in 1973, ∼38 Tg of wastes have been deposited (Szuwarzyński and Kryza 1993; Pajor 2005). Due to the mineralogical, chemical, and texture characteristics, economical use of these wastes is strongly limited (Wdowin and Gruszecka 2012).
The study of metal concentrations in surface soils in the vicinity of the waste site made by Cabała and Sutkowska (2006), Gruszecka and Helios-Rybicka (2006), and Kicińska (2011) showed medium and heavy contamination of Zn, Pb, and Cd on the basis of classification developed by the Institute of Soil Science and Plant Cultivation IUNG in Puławy, Poland (Kabata-Pendias et al. 1993). In addition, contents of As and Tl indicated by Helios-Rybicka et al. (2004), Adamiec and Helios-Rybicka (2004), and Kicińska (2009) exceeds the local geochemical background value (Kabata-Pendias and Pendias 2001). The effect of Zn–Pb ore extraction, processing, and disposal of emerging wastes in the Silesia–Cracow region of Poland is contaminating topsoils with Pb, Zn, Cd, As, and Tl at considerable distances (Cabała et al. 2008; Teper 2009; Chrastný et al. 2012). Due to the high metal content in the environment, preliminary assessments of the health risk to local populations were carried out (Gruszecka and Helios-Rybicka 2009; Gruszecka 2010). The results lead to the necessity for further analyses of metals doses taken in various routes of exposure.
Metal contamination of the soil surface layer suggested an investigation into the migration of heavy metals in soil profiles was necessary to determine the potential contamination of the lower soil horizons and groundwater.
Materials and methods
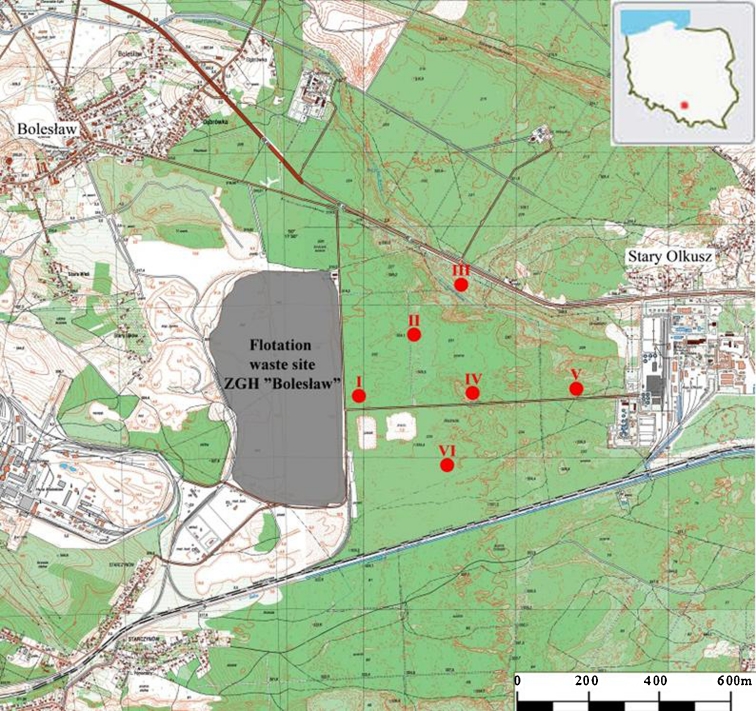
Soil profiles were taken on the east side of the flotation waste site of the Mining and Metallurgical Plants ZGH “Bolesław” in Bukowno, due to the fact that during previous research (Gruszecka 2011) the contamination of the surface soil with metals was found. The schematic locations of the six 140 cm soil profiles (I–VI) are shown in Fig. 1. Profiles were sampled on podzol soils that take the form of loose sand overgrown with pines (profile I, IV, and V), birches (profile II) and both pines and birches (profile III and VI). The soil horizons in the profiles were isolated and described.
Fig. 1.
Location of soil profiles I–VI (based on the topographic map in the “1992” reference system, in scale 1:10,000, sheets: M-34-64-A-a-1, M-34-64-A-a-2, M-34-64-A-a-3, and M-34-64-A-a-4)
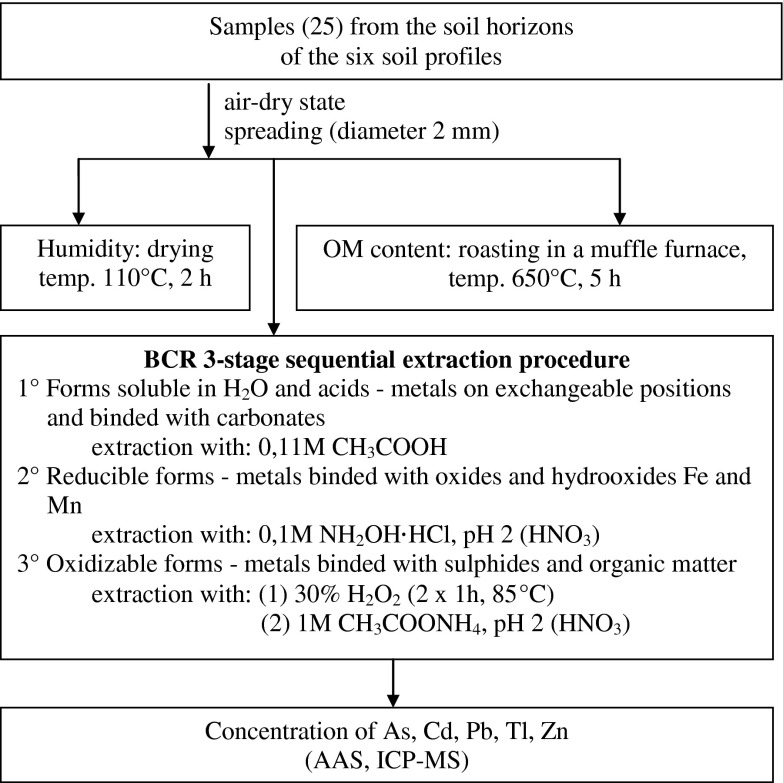
From the separated soil horizons, a total of 25 samples were extracted, in which values of Eh and pH in H2O and 1 mol/dm3 KCl (according to PN-ISO 10390 1997) were measured. Concentrations of As, Cd, Pb, Tl, and Zn using an atomic absorption spectrophotometer with a graphite cuvette UNICA ICE 3500 and ICP-MS apparatus (mass spectrometer with inductively coupled plasma ELAN DRC-e Perkin Elmer) in solutions obtained by the BCR three-stage sequential extraction procedure (Quevauviller et al. 1997) were measured. Analysis was conducted in the Environmental Analysis Laboratory in the Department of Geology, Geophysics and Environmental Protection of the AGH University of Science and Technology in Krakow, Poland (Fig. 2).
Fig. 2.
Laboratory procedure scheme
The mineral composition of the soil horizon samples was determined to verify that the mineral composition had a significant effect on the accumulation of heavy metals.
Soil samples were subjected to observation of the mineral composition in the transmitted light under a polarizing microscope (JENALAB Karl Zeiss Jena) using zooms 2.5 × 0.05 × 10 0.25 × 50 0.08. The horizon samples were analyzed with X-ray diffraction (XRD) and scanning electron microscopy with energy dispersed spectroscopy (SEM-EDS). SEM-EDS analysis was conducted using a microscope with field emission (JEOL 5200), equipped with an energy dispersed analysis of X-rays system for the microprobe analysis, as well as a back scattered electron detector (YAG BSE). Samples were dusted with carbon before observation.
Qualitative analysis of mineral composition was conducted by the X-ray powder method of Debye-Scherrer. Patterns of XRD of all samples were recorded using an X-ray diffractometer (DRON-3.0) with the following parameters: Cu Kα radiation, Ni filter, 35 kV lamp voltage, lamp current of 30 mA, the registration step by step: step 2 Θ = 0.05°, counting time 1 s/step. To eliminate the influence of apparatus on the intensity of the analytical line, each sample Io (initial intensity) was adjusted relative to the quartz standard beforehand.
Values of interlayer distances obtained from XRD distance patterns were used to identify mineral phases occurring in tested samples, based on the information contained in the directory International Centre for Diffraction Data (ICDD) and the computer program XRAYAN. For the interpretation of mineral phases, the computer program ClayLAB ver. 1.0 was also used. Identification of mineral phases was based on the PCPDFWIN database ver. 1.30 formalized by the JCPDS-ICDD.
Results and discussion
Characteristics of soil profiles
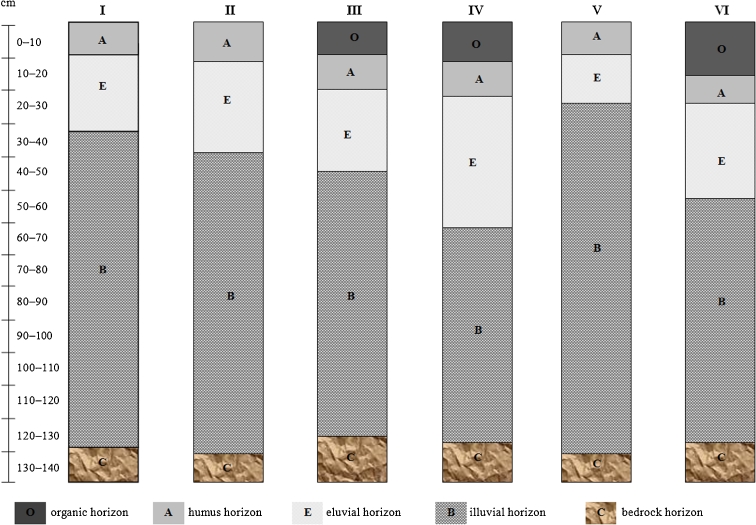
The specified soil horizons in the soil profiles are shown in Fig. 3. Among the six soil profiles taken in the research area, three had a 10–20-cm organic (O) horizon. The thickness of the humus horizon (A) was between a few and 10 cm. The level eluvial horizon (E) had a thickness from several to 30 cm. The thickness of the illuvial horizon (B) varied from 60 to 90 cm. The bedrock horizon was observed at 120 cm.
Fig. 3.
Formation of the soil profiles on the east side of the postflotation waste site ZGH “Bolesław” in Bukowno
Mineralogical and physical characteristic
The average results of the mineralogical analysis in transmitted light observation, XRD and SEM-EDS investigations are summarized in Table 1. The mineral composition of each soil horizon mainly differed in the quantitative composition of the various minerals. The mineralogical analysis showed that the main components of each soil horizon were quartz, K-feldspar (microcline), and plagioclases. In the analysis in transmitted light, regeneration quartz was predominant. Among the siliceous minerals, chalcedony was also observed in the O and C horizons. The feldspars sericitization and kaolinitization were often seen. Microcline was the predominant potassium feldspar grain. Plagioclase grains occasionally showed illitization in the E and B horizons. There was also evidence that, with decreasing depth, the amount of OM decreased and was absent in the C horizon. In the O, A, E, and B horizons, ore minerals were observed, often Zn- and Pb-bearing minerals such as pyrite and sphalerite and carbonate minerals such as calcite, dolomite, and ankerite as well as micas such as sericite. However, in the A, E, B, and C horizons, grains of goethite were also present. Each of the horizons, except the C horizon, had a small amount of clay minerals. In the O horizon, there were also fragments of rock (sandstone) and the E horizon had additional iron oxides.
Table 1.
Average mineral composition for individual soil horizons
| Soil horizon | Transmitted light | XRD and SEM analysis |
|---|---|---|
| O | Quartz (places regenerative quartz), K-feldspars (often kaolinitization)–microcline, plagioclases, organic matter, ore minerals, chalcedony, sericite, individual carbonates, clay minerals (e.g., glauconite), fragments of rocks (sandstones) | Quartz, Fe-dolomite/ankerite, plagioclases, K-feldspars, apatite |
| A | Quartz (places regenerative quartz), K-feldspars (places kaolinitization)–microcline, goethite, individual carbonates, organic matter, ore minerals, clay minerals, sericite | Quartz, Fe-dolomite, calcite, pyrite, probably in trace amount–barite, K-feldspar, plagioclases, carbonates |
| E | Quartz (regenerative quartz), K-feldspars (places sericitization and kaolinitization)–microcline, iron oxides, plagioclases (often illitization and diagenesis of grain is observed), single grains of chalcedony, goethite, muscovite (occasionally), sericite, organic matter (occasionally), single grains of glauconite, single carbonates, colophane, iron oxides | Quartz, carbonates (Fe-dolomite), K-feldspars, plagioclases, gypsum, sphalerite, pyrite, Fe-dolomite |
| B | Larger grain of quartz (regenerative quartz), single K-feldspars (places sericitization and kaolinitization), carbonates, fine crystalline clay-iron matter, sericite with organic matter, goethite, plagioclases (places illitization), ore minerals, organic matter | Quartz, K-feldspars, plagioclases, carbonates (calcite), Fe-dolomite, gypsum, pyrite, barite |
| C | Quartz (places regenerative quartz), K-feldspars (places sericitization and kaolinitization), glauconite, chalcedony, goethite | Quartz, K-feldspars, plagioclases |
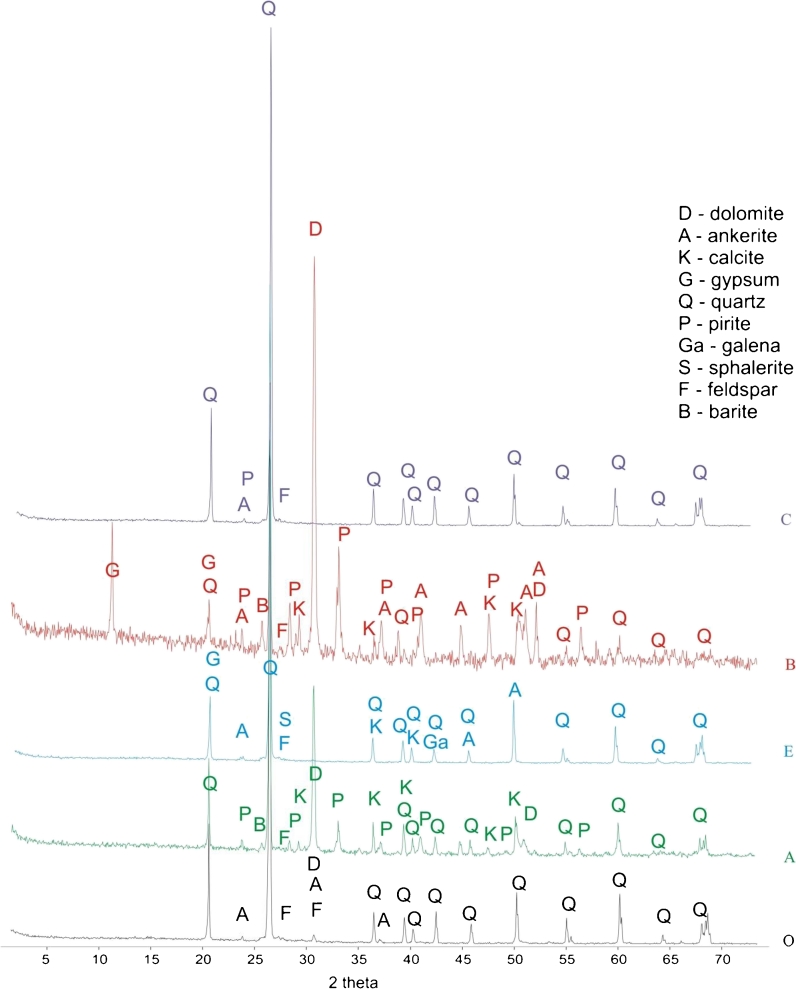
In the XRD analysis (Fig. 4), the patterns for the A, E, and C horizons were very close, indicating the presence of minerals such as quartz and small amounts of carbonates such as calcite, dolomite, and ankerite and K-feldspars. Sphalerite and galena were also observed. Slightly different curves represented the values for the A and B horizons, where the dominant minerals were quartz and carbonates (calcite, dolomite, and ankerite). In addition, a small proportion of feldspar was also seen, as well as the presence of barite and gypsum.
Fig. 4.
XRD diffraction patterns of soil horizons on the east side of the postflotation waste site in Bukowno
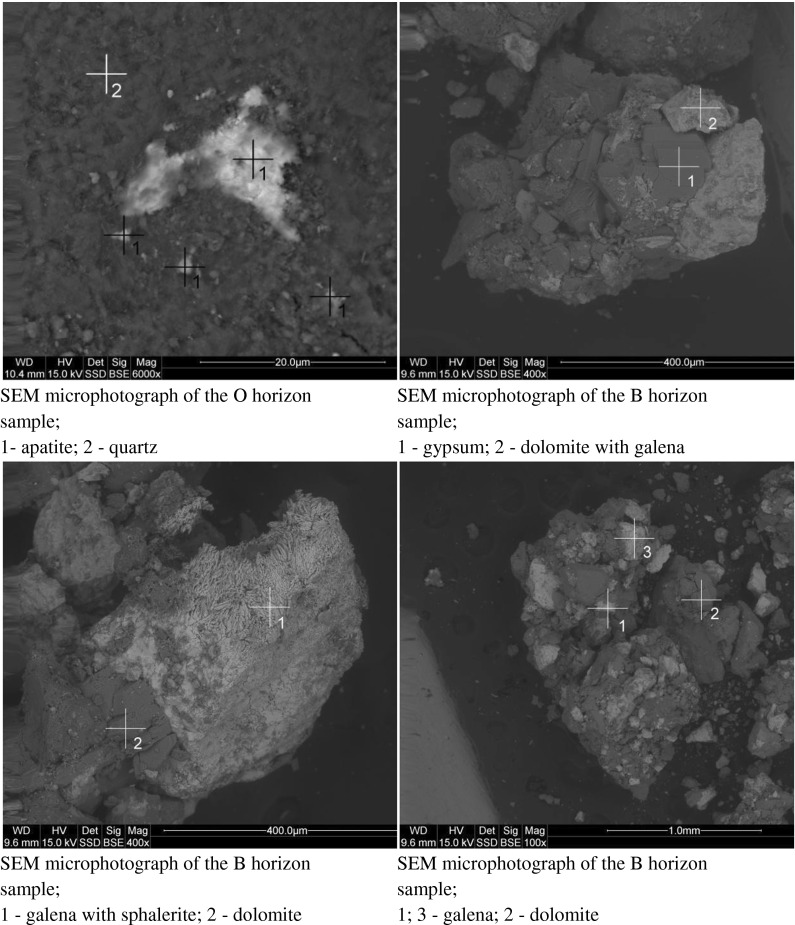
In the SEM-EDS observation (Fig. 5), silicate minerals and quartz were observed, and ore minerals such as sphalerite and galena were present. Furthermore, apatite occurred in the O horizon.
Fig. 5.
Examples of SEM microphotographs of soil horizons on the east site of the postflotation waste site in Bukowno
Both the potential (6.6–8.0) and active (6.0–8.0) pH values (Table 2), determined the soil pH as slightly acidic through neutral to alkaline. Measured negative Eh values indicated reduction conditions. The OM ranged from 2 to 80 %.
Table 2.
Physical properties and total metal concentration in soil profiles
| Soil horizon | pH (KCl) | pH (H2O) | Eh (mV) | OM (%) | Total concentration (mg/kg d.m.) | ||||
|---|---|---|---|---|---|---|---|---|---|
| As | Cd | Pb | Tl | Zn | |||||
| Profile I | |||||||||
| O | – | – | – | – | – | – | – | – | – |
| A | 8.0 | 7.7 | −78 | 60 | 13.6 | 13.3 | 1,103 | 1.90 | 883 |
| E | 7.1 | 6.9 | −27 | 10 | 3.8 | 1.1 | 43 | 0.79 | 136 |
| B | 7.1 | 7.0 | −56 | 10 | 2.1 | 1.2 | 307 | 0.28 | 145 |
| C | 7.1 | 6.9 | −23 | 2 | 0.4 | 0.3 | 37 | 0.02 | 32 |
| Profile II | |||||||||
| O | – | – | – | – | – | – | – | – | – |
| A | 7.0 | 6.8 | 21 | 30 | 18.5 | 10.4 | 454 | 1.10 | 831 |
| E | 7.2 | 7.2 | −49 | 10 | 2.6 | 0.8 | 35 | 0.14 | 69 |
| B | 7.1 | 7.1 | −33 | 20 | 3.0 | 2.2 | 173 | 0.26 | 167 |
| C | 7.1 | 7.1 | −38 | 2 | 0.4 | 1.4 | 36 | 0.01 | 33 |
| Profile III | |||||||||
| O | 6.6 | 6.7 | −21 | 80 | 1.5 | 3.2 | 625 | 0.03 | 298 |
| A | 6.6 | 7.1 | −32 | 41 | 1.8 | 7.3 | 286 | 0.15 | 390 |
| E | 7.0 | 6.8 | −19 | 10 | 0.9 | 7.1 | 48 | 0.22 | 78 |
| B | 6.9 | 6.8 | −35 | 10 | 2.6 | 27.0 | 2354 | 0.10 | 1,352 |
| C | 7.3 | 7.0 | −30 | 2 | 0.4 | 0.3 | 37 | 0.01 | 36 |
| Profile IV | |||||||||
| O | 7.9 | 8.0 | −34 | 40 | 10.7 | 8.8 | 1,044 | 1.44 | 1,474 |
| A | 7.3 | 6.8 | −23 | 34 | 4.8 | 76.9 | 4,181 | 4.50 | 5,254 |
| E | 6.8 | 6.0 | −10 | 7 | 1.0 | 14.9 | 306 | 2.51 | 995 |
| B | 7.6 | 7.0 | −31 | 10 | 100.0 | 40.9 | 2,564 | 6.53 | 3,329 |
| C | 7.2 | 7.4 | −54 | 2 | 1.3 | 1.9 | 37 | 0.05 | 114 |
| Profile V | |||||||||
| O | – | – | – | – | – | – | – | – | – |
| A | 7.0 | 7.5 | −37 | 20 | 1.0 | 1.9 | 48 | 0.07 | 205 |
| E | 6.7 | 7.5 | −45 | 20 | 1.1 | 0.1 | 21 | 0.02 | 53 |
| B | 6.5 | 7.6 | −20 | 20 | 0.8 | 6.0 | 124 | 0.22 | 90 |
| C | 7.1 | 7.6 | −58 | 2 | 0.4 | 0.3 | 36 | 0.01 | 41 |
| Profile VI | |||||||||
| O | 7.0 | 7.1 | −57 | 60 | 5.4 | 5.9 | 109 | 0.55 | 415 |
| A | 7.0 | 7.3 | −47 | 50 | 1.8 | 1.5 | 47 | 0.07 | 120 |
| E | 7.2 | 7.0 | −37 | 10 | 0.04 | 0.9 | 23 | 0.03 | 65 |
| B | 7.1 | 7.3 | −52 | 20 | 4.6 | 1.0 | 22 | 0.23 | 66 |
| C | 7.1 | 7.3 | −51 | 1 | 0.5 | 0.5 | 11 | 0.01 | 276 |
(–) lack of horizon
Characteristic of metal content
The total contents of heavy metals (Table 2) in surface soils (0–25 cm) were compared (Table 3) with the permissible soil concentrations in Poland (Table 4). Because of the fact that the research area is populous and the common is that residents grow vegetables for their own nutritional needs, analyzed metal contents in soil profiles were also compared with permissible levels for agricultural soils. Permissible values were according to the Regulation of the Minister of the Environment on the soil quality standards and ground quality standards (GJ no. 165/2002, pos. 1359) and the chemical quality of soil classification recommended for agricultural use of soil developed by the Institute of Soil Science and Plant Cultivation IUNG (Kabata-Pendias et al. 1993, 1995).
Table 3.
Total contents of metals in the topsoil and their permissible levels by Polish law
| As | Cd | Pb | Tl | Zn | ||||||||||||||||||||||||||
|---|---|---|---|---|---|---|---|---|---|---|---|---|---|---|---|---|---|---|---|---|---|---|---|---|---|---|---|---|---|---|
| Soil profile | I | II | III | IV | V | VI | I | II | III | IV | V | VI | I | II | III | IV | V | VI | I | II | III | IV | V | VI | I | II | III | IV | V | VI |
| Content | 9.2 | 9.3 | 4.0 | 11.7 | 1.4 | 1.9 | 4.2 | 3.3 | 1.6 | 3.0 | 1.0 | 1.0 | 202 | 184 | 133 | 151 | 20 | 39 | 1.6 | 0.8 | 0.1 | 1.0 | 0.1 | 0.2 | 368 | 372 | 157 | 609 | 170 | 79 |
| g.b. | 2 | 0,2 | 18 | 1 | 30 | |||||||||||||||||||||||||
| 0° | – | 0,3 | 20 | – | 50 | |||||||||||||||||||||||||
| I° | – | 1 | 70 | – | 100 | |||||||||||||||||||||||||
| II° | – | 2 | 100 | – | 200 | |||||||||||||||||||||||||
| III° | – | 3 | 500 | – | 700 | |||||||||||||||||||||||||
| IV° | – | 5 | 2,500 | – | 1,500 | |||||||||||||||||||||||||
| V° | – | >5 | >2,500 | – | >1,500 | |||||||||||||||||||||||||
| A | 20 | 1 | 50 | – | 100 | |||||||||||||||||||||||||
| B | 20 | 4 | 100 | – | 300 | |||||||||||||||||||||||||
| C | 60 | 15 | 600 | – | 1,000 | |||||||||||||||||||||||||
g.b. geochemical background (Kabata-Pendias and Pendias 2001), A group A (RME 2002), B group B (RME 2002), C group C (RME 2002), (–) not determined
Table 4.
Permissible concentrations of metals in soils by Polish guidelines
| Permissible metals concentration classifications | As | Cd | Pb | Tl | Zn | |
|---|---|---|---|---|---|---|
| mg/kg d.m. | ||||||
| Geochemical background (Kabata-Pendias and Pendias 2001) | ||||||
| Natural element concentration | 2 | 0.2 | 18 | 1 | 30 | |
| Chemical quality grades of soil by IUNG (Kabata-Pendias et al. 1995) | ||||||
| 0° | Soil not contaminated, the natural content of heavy metals | – | 0,3 | 20 | – | 50 |
| I° | Soils with elevated concentrations of heavy metals | – | 1 | 70 | – | 100 |
| II° | Weakly contaminated soils | – | 2 | 100 | – | 200 |
| III° | Medium contaminated soils | – | 3 | 500 | – | 700 |
| IV° | Heavily contaminated soils | – | 5 | 2,500 | – | 1,500 |
| V° | Very heavily contaminated soils | – | >5 | >2,500 | – | >1,500 |
| Types of ground Regulation of the Minister of the Environment (GJ No. 165/2002 pos. 1359) | ||||||
| Group A | Protected areas based on the Water Law Act and Protection of the Nature Act | 20 | 1 | 50 | – | 100 |
| Group B | Agricultural land, forest land and trees, woodland and shrubs | 20 | 4 | 100 | – | 300 |
| Group C | Industrial areas, minerals, communication areas | 60 | 15 | 600 | – | 1,000 |
(–) not determined
The total As concentration in topsoil of two soil profiles was at the geochemical background level (2 mg/kg). In the remaining four profiles, the geochemical background level was exceeded four to six times. The permissible As concentration for protected areas (group A) according to the Regulation of the Minister of the Environment was not exceeded. The permissible concentration of As for agricultural soils in the IUNG classification of chemical quality of soil degrees was not specified.
The concentration of Cd in all analyzed profiles exceeded the geochemical background content (0.2 mg/kg). According to the IUNG classification, three samples were heavily Cd contaminated (grade IV), and three samples were weakly Cd contaminated (grade II). Profile I also exceeded the permissible content for group B soils (agricultural soils and urban areas) according to the Regulation of the Minister of the Environment.
In all six profiles, the Pb content in topsoil exceeded the geochemical background level (18 mg/kg). In four samples, Pb content classified them as third grade (medium contaminated) of the IUNG chemical quality classification and also exceeded the permissible content for group B soils according to the Regulation of the Minister of the Environment. Two samples were classified as grade I (elevated concentration of heavy metals) for Pb concentration.
Three soil profile topsoils were classified as grade III of the IUNG chemical quality classification (medium contaminated soils) for Zn concentration. Two samples exceeded the permissible concentration for group B soils according to the Regulation of the Minister of the Environment, and five samples exceeded the permissible concentration for group A soils (protected areas). According to the IUNG chemical quality classification, two soil samples had low Zn contamination (grade II), and one had elevated Zn concentrations (grade I).
Soil Tl content is not in the IUNG chemical quality classification or the Regulation of the Minister of the Environment. Measured Tl concentrations in three profiles were at the geochemical background level (1 mg/kg) and below the geochemical background level in three profiles.
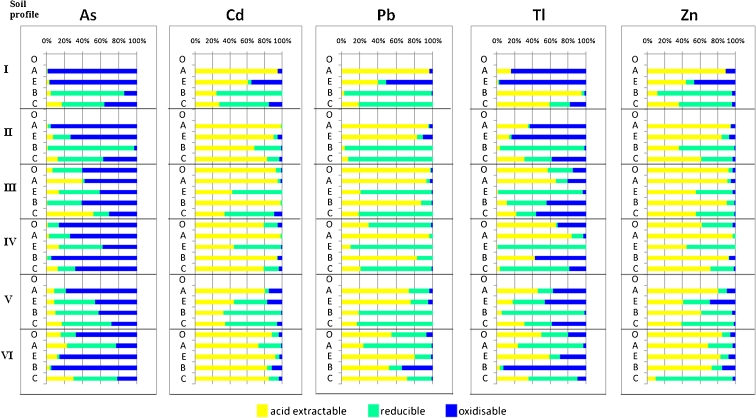
Considering the metal binding forms in individual soil horizons (Fig. 6), the highest total As content was observed in the O, A, and B horizons. Arsenic was associated mainly with sulfides and OM (stage III of the BCR extraction). It was observed that the higher the OM content in the horizon, the more As was related to the oxidized fraction. Up to ∼20 % of As was associated with the mobile fraction.
Fig. 6.
Binding forms of metals as a percentage of the total metal content in soil profiles
The highest total Cd concentration was in the O, A, and B horizons. The high Cd content coincides with the high OM concentration. Approximately 90 % of the total Cd in all soil horizons was bound to replaceable positions or associated with carbonates (BCR extraction stage I). Oxidized forms of Cd constituted only 12 % of its total concentration.
The total Pb content was highest in the O, A, and B horizons. Approximately 60 % of the total Pb concentration was present in mobile forms, and in the O, A, and B horizons, this constituted >80 %, while concentration of mobile forms in the E and C horizons dropped to <50 % with the exception of the VIth profile, where the trend was reversed. With increasing depth, the content of the reduced forms of Pb increased. Of all analyzed metals, the lowest concentration of oxidized forms was observed for Pb.
The total Tl content was highest in the O, A, and B horizons. About 50 % of the total Tl concentration was extracted at stage I of the procedure. The lower the soil horizon, the higher the content of reducible and oxidizable Tl forms.
The O, A, and B horizons also had the highest Zn content. The distribution of total Zn concentration between the different extraction stages is much the same as for Cd. Approximately 80 % of Zn was related to the water- and acid-soluble forms. Increasing depth in the profile increased the share of the reduced and oxidized Zn forms.
Conclusions
The investigation showed that the soils on the eastern side of the postflotation waste site were mostly loose sands. The soil profiles were formed mainly from sand and bedrock (sand) was found at 120 cm.
The highest concentrations of metals were measured in the O, A, and B horizons. This may be primarily associated with the presence of OM, with which metals can be combined to form complex compounds. It can also be caused by the accumulation of contaminants on the surface and the gradual migration with depth in the soil profile (except of eluvial horizon E). In the study area, this migration occurred to a depth of 60–90 cm. Such results also indicate that mineral composition had an insignificant influence on the accumulation of heavy metals in individual soil horizons. The lack of such dependence can be also conditioned to low differences in mineral composition of soil horizons. Perhaps in other types of soil (with more minerals in the horizons), the influence of each soil horizon on the accumulation of heavy metals could be better observed.
In the BCR sequential extraction procedure, the concentrations of metals in the residue were not analyzed. For this reason, more specific tests defining concentrations of metals in the residue should be made. Metals in the residue are unavailable for living organisms. Concentrations of metals in residue allow for more accurate determination of bioavailable forms.
The reported water table level in the research area is at a depth of ∼23 m (Ciećko 2011), so currently, there is no risk of groundwater contamination associated with the migration of metals in the soil profiles. However, further studies including infiltration of rainwater into the soil profile with the loads of pollutants carried with them should be made.
It is not the total metal concentration that determines its harmfulness, but their form. The study of metal binding forms in soils using the BCR three-stage sequential extraction showed, that in the case of Cd, Zn, and Pb, mobile forms, i.e., those that are released into the environment through water and even weak acid leaching, dominated. In addition, the depth of the absorption layer in the root zone for typical crops reached ∼80 cm (Błaszkowski 2012). Assuming that the total contents of 90 % Cd, 60 % Zn, and 80 % Pb occurred as mobile forms, concentrations of 10 mg/kg Cd, 694 mg/kg Zn, and 922 mg/kg Pb could potentially be taken up in the root zone and moved to higher levels of the food chain. In the case of Tl, 60 % of its concentration occurred in mobile forms, which corresponded to <1 mg/kg. The most favorable situation was observed for As. Up to 20 % was in exchangeable positions or bound with carbonates, which corresponded to <5 mg/kg in bioavailable forms. It appears advisable to conduct further studies to determine the actual amount of metal taken up by the crops in the study area.
By comparing the total metal concentrations in the soil horizons with the Polish legal limits in force, it is found that the tested soils exceeded the permissible levels for agricultural soils. Because of the widespread vegetable cultivation in home gardens by the local population, it is advisable to determine the actual uptake of metals by cultivated crops on soils of such metal pollution. Uptake of As and Tl, are not governed by Polish law or the chemical quality classification for agricultural soils but should also be considered. It seems to be necessary in this situation to determine the relationship between the content of As and Tl in the soils and the dose taken in the pathways of exposure associated with agricultural use of this type of soil.
Acknowledgments
This study was performed in the framework of the statutory activities of the AGH University of Science and Technology, Krakow no. 11.11.140.199
References
- Adamiec E, Helios-Rybicka E. The research of the thallium concentrations in soils and grasses in the area of the influence of the Zn–Pb industry in Bukowno. Geology. 2004;30(2):141–152. [Google Scholar]
- Błaszkowski J. (2012). Efficient watering of plants in the garden. Aquasystem Greenmill irrigation systems. http://www.trawnik.com/dodatki/405c3fcd07c1c43a8188e97d843de07a.pdf. Accessed 9 Aug 2012 (in Polish)
- Cabała J. Heavy metals in the soil environment Olkusz ore mining region of Zn–Pb. Katowice: University of Silesia; 2009. [Google Scholar]
- Cabała J, Sutkowska K. Impact of the former exploitation and processing of the Zn–Pb ores on mineral composition of industrial soils, the area of Olkusz and Jaworzno. Scientific Papers of the Institute of Mining University of Technology in Wrocław, Studies and Materials. 2006;117(32):13–22. [Google Scholar]
- Cabała J, Zogala B, Dubiel R. Geochemical and geophysical study of historical Zn–Pb ore processing waste dump areas (southern Poland) Polish Journal of Environmental Studies. 2008;17(5):693700. [Google Scholar]
- Chrastný V, Vaněk A, Teper L, Cabała J, Procházka J, Pechar L, Drahota P, Penížek V, Komárek M, Novák M. Geochemical position of Pb, Zn and Cd in soils near the Olkusz mine/smelter, South Poland: effects of land use, type of contamination and distance from pollution source. Environmental Monitoring and Assessment. 2012;184(4):2517–2536. doi: 10.1007/s10661-011-2135-2. [DOI] [PubMed] [Google Scholar]
- Ciećko P. (Ed.) (2011). Report on the state of the environment in the Małopolskie Voivodeship in 2010. Krakow: Regional Inspectorate for Environmental Protection in Krakow. http://www.krakow.pios.gov.pl/publikacje/raporty/raport10/raport2010.pdf. Accessed 9 Aug 2012 (in Polish)
- Góralski M. (2005). Impact of the zinc-lead ores exploitation to contamination of soils with heavy metals in the northeast area of Trzebinia. PhD thesis. AGH University of Science and Technology in Krakow, Krakow (in Polish)
- Górecka E, Bellok A, Socha J, Wnuk R, Kibitlewski S. Differentiation of metal content in the flotation wastes from Zn–Pb ores (ZGH Bolesław, olkuski region) Geological Review. 1994;42(10):834–841. [Google Scholar]
- Gruszczyński S, Trafas M, Żuławski C. Characteristics of the soils in the Olkusz region. Scientific Papers AGH Sozology and Environmental Science. 1990;32(1368):113–122. [Google Scholar]
- Gruszecka, A. (2010). Functional application of the environmental and health risk assessment at the example of industrial waste deposition areas at Bukowno (Poland) and Mansfeld (Germany). In J. Rajchel (Ed.), Jubilee of the Department of General Geology, Environmental Protection and Geotourism AGH University of Science and Technology 1920–2010 (pp. 61–72). Kraków: AGH (in Polish).
- Gruszecka A. Investigated heavy metals in water, sediments and soils in the vicinity of mining and metallurgical waste sites in Bukowno (Poland) and Mansfeld (Germany). Monograph. Krakow: AGH; 2011. [Google Scholar]
- Gruszecka A, Helios-Rybicka E. Distribution of Zn and Pb in the vicinity of non-ferrous industrial waste sites at the example of Bukowno (Poland) and Mansfeld (Germany) Polish Journal of Environmental Studies. 2006;15(5c):164–170. [Google Scholar]
- Gruszecka A, Helios-Rybicka E. Pb, Tl and As in waters, sediments and soils in the vicinity of the post flotation waste sites in the Bukowno region-ecological risk assessment. Geology. 2009;35(2/1):233–242. [Google Scholar]
- Helios-Rybicka E, Rajchel B, Wójcik R. The impact assessment of the Zn–Pb industry in the Olkusz–Bukowno region on surface waters contamination with thallium. Geology. 2004;30(2):127–140. [Google Scholar]
- Kabata-Pendias A, Pendias H. Trace elements in soils and plants. Boca Raton: CRC; 2001. [Google Scholar]
- Kabata-Pendias A, Motowicka-Terelak T, Terelak H, Witek T. Assessment of the degree of contamination of soils and plants by heavy metals and sulfur—a framework of guidance for agriculture. Publisher Institute of Crop Science and Plant Cultivation, Puławy. 1993;53:1–20. [Google Scholar]
- Kabata-Pendias A, Piotrowska M, Motowicka-Terelak T, Maliszewska-Kordybach B, Filipiak K, Krakowiak A, Pietruch C. Grounds for assessment of chemical contamination of soils. Heavy metals, sulfur, PAHs. Warsaw: Library of Environmental Monitoring; 1995. [Google Scholar]
- Kicińska A. Arsenic and thallium in soils and plants from the Bukowno region. Environment Protection and Natural Resources. 2009;40:199–208. [Google Scholar]
- Kicińska A. Binding forms and mobility of zinc, lead and cadmium in soils contaminated by mining and metallurgical industry. Environment Protection and Natural Resources. 2011;49:152–162. [Google Scholar]
- Pajor G. Post flotation waste management in Mining and Metallurgical Plants ZGH “Bolesław” S.A. in Bukowno. In: Kudełko J, Kulczycka J, Wirth H, editors. Sustainable management of postindustrial areas. Krakow: Institute of Management of Mineral Resources and Energy Polish Academy of Science; 2005. pp. 8–19. [Google Scholar]
- PN-ISO 10390 (1997). Soil quality. Determination of pH
- Quevauviller P, Rauret G, Lopez-Sanchez J-F, Rubio R, Ure A, Muntau H. Certification of trace metal extractable contents in a sediment reference material (CRM 601) following a three-step sequential extraction procedure. Science of the Total Environment. 1997;205:223–234. doi: 10.1016/S0048-9697(97)00205-2. [DOI] [Google Scholar]
- Regulation of the Minister of Environment Protection on soil quality standards and ground quality standards (GJ No. 165/2002, pos. 1359) (in Polish)
- Sikora W, Damijan E, Jędrzejczyk B, Szczawiński W, Wardas M. Waste characterization from the Mining and Metallurgical Plants ZGH ‘Bolesław’ S.A. in Bukowno. Air Protection. 1996;4:143–146. [Google Scholar]
- Szuwarzyński M, Kryza A. The problem of flotation waste sites in the lead and zinc mining in the Silesia–Cracow deposit province. Geological Review. 1993;41(9):629–633. [Google Scholar]
- Szyczewski P, Siepak J, Niedzielski P, Sobczyński T. Research on heavy metals in Poland. Polish Journal of Environmental Studies. 2009;18(5):755–768. [Google Scholar]
- Teper E. Dust particle migration around flotation tailings ponds: pine needles as passive samplers. Environmental Monitoring and Assessment. 2009;154(1–4):383–391. doi: 10.1007/s10661-008-0405-4. [DOI] [PubMed] [Google Scholar]
- Trafas M, Gruszczyński S, Gruszczyńska J, Zawodny Z. Changes in soil properties due to the influence of industry in the Olkusz region. Scientific Papers AGH Sozology and Environmental Science. 1990;32(1368):143–162. [Google Scholar]
- Urbański K. (2008). Methods of documenting the chemical transformations of soil on industrial sites. PhD thesis. AGH University of Science and Technology, Krakow
- Wdowin M, Gruszecka A. Mineralogical, chemical and texture characteristics of post flotation wastes from Zn–Pb industry for further consideration of their use as sorbents. Gospodarka Surowcami Mineralnymi - Mineral Resources Management. 2012;28(3):55–69. doi: 10.2478/v10269-012-0021-3. [DOI] [Google Scholar]


