Abstract
Due to strong light scattering in tissue, both the spatial resolution and maximum penetration depth of optical-resolution photoacoustic microscopy (OR-PAM) deteriorate sharply with depth. To reduce tissue scattering, we propose to use glycerol as an optical clearing agent in OR-PAM. Our results show that the imaging performance of OR-PAM can be greatly enhanced by optical clearing both in vitro and in vivo.
Photoacoustic microscopy (PAM) is a recently developed imaging modality that can provide structural [1], molecular [2], functional [3–5], and metabolic information [6]. Based on its focusing mechanism, PAM can be divided into two different implementations: acoustic-resolution PAM (AR-PAM) and optical-resolution PAM (OR-PAM) [1]. In OR-PAM, the lateral resolution is determined by the diffraction-limited optical focusing. As photons travel in tissue, the focusing capability degrades due to optical scattering. In addition, the maximum penetration depth of OR-PAM in biological tissue is mainly limited by the optical transport mean free path, affected by both absorption and scattering. Since the tissue scattering is typically an order of magnitude larger than the absorption, it is the scattering that predominantly limits the penetration depth of OR-PAM [7].
To reduce the scattering, tissue optical clearing (TOC) techniques have been widely used in many high-resolution optical imaging modalities, such as laser speckle contrast imaging and optical coherence tomography [8]. The basic mechanism of TOC is to diffuse a high-refractive-index optical clearing agent (OCA) into the tissue, which reduces the refractive index mismatch between intracellular components and extracellular fluids, and thus decreases the scattering. In addition, tissue dehydration caused by OCAs has also been used to explain TOC [8]: on one hand, it increases refractive-index matching due to decreased volume fraction of free water in the interstitial fluid; on the other hand, it increases packing of scatters, which may engender spatial correlations between scatterings; both reduce scattering further. In this paper, for the first time, we demonstrate that both the imaging depth and lateral resolution of OR-PAM can be enhanced by using a glycerol-water solution (88%, vol/vol), which is a commonly used OCA in TOC.
We implemented this idea on a previously reported OR-PAM system (Fig. 1). Briefly, a tunable dye laser (CBR-D, Sirah, GmbH.) pumped by a Nd:YLF laser (INNOSAB, Edgewave, GmbH.) was the light source. After being focused by a condenser lens, filtered by a pinhole, and reflected by a mirror, the laser beam was finally focused by an objective lens into the sample. Ultrasonic detection was achieved by a wide-band ultrasonic transducer (V214-BC, Panametrics-NDT Inc.), which was placed confocally with the optical objective lens. Each laser pulse yielded a one-dimensional depth-resolved PA image (A-line) by recording the time course of photoacoustic signals. A three-dimensional (3D) image was obtained by raster scanning the sample and piecing together A-lines.
Fig. 1.
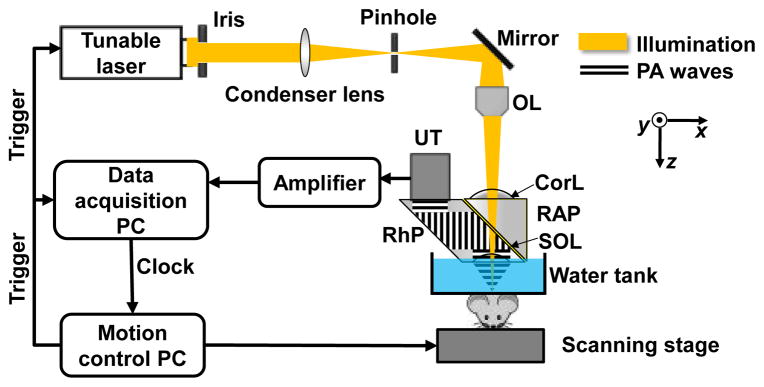
System schematic used in the experiment. CorL, correction lens; OL, objective lens; RAP, right-angle prism; RhP, rhomboid prism; SOL, silicone oil layer; UT, ultrasonic transducer.
First, in a phantom experiment, a U.S. penny (Fig. 2a) covered by a piece of freshly harvested mouse skin was imaged at 570 nm. The phantom was immersed in the glycerol-water solution. As shown in the baseline image [Fig. 2(b)], there were almost no PA signals from the coin because of the strong scattering of the mouse tissue. During optical clearing, the PA signals from the coin became stronger and stronger, and more features became resolvable, as shown from Fig. 2(c) to (d). Fig. 2(e) shows that the average total PA signal amplitude from the coin versus time; after 250 min, the amplitude increased by more than three fold over the baseline value. Note that the PA signals were still increasing at the point when we stopped the experiment. This phantom experiment clearly illustrates that the scattering of the tissue was reduced by optical clearing, and thus the penetration depth was enhanced.
Fig. 2.
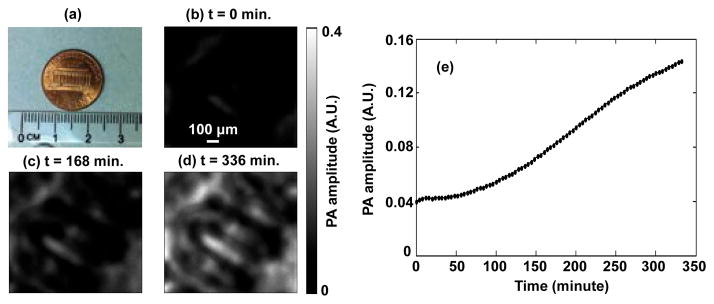
Optical clearing aided PAM of a coin covered by mouse skin. (a) Photograph of the one cent coin used in the experiment. (b)–(d) PA images of the coin at different times during optical clearing. (e) Time course of the PA amplitude averaged over the whole image during optical clearing. The higher PA amplitude indicates that the optical clearing increased penetration depth.
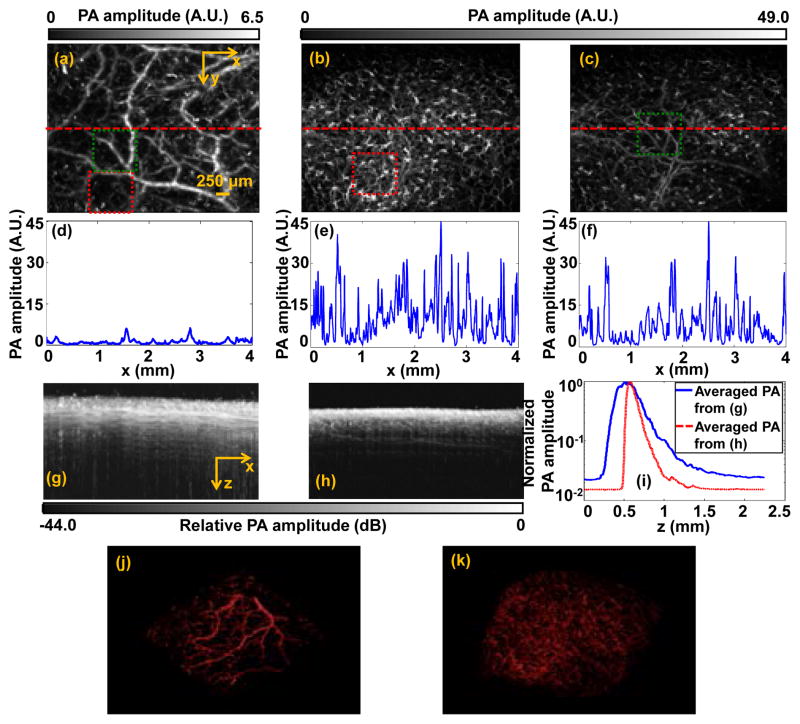
Next, we used a nude mouse in an in vivo experiment. All experimental animal procedures were carried out in conformance with the laboratory animal protocol approved by the Animal Studies Committee of Washington University in St. Louis. Because the diffusion of glycerol across the epidermal layer is very slow, we directly injected the glycerol-water solution into the mouse scalp to create a local optical clearing window. Figs. 3(a) and (b) show the maximum-amplitude-projection (MAP) of the PA images of blood vessels in the mouse scalp before and after optical clearing, respectively. For a better visualization of the deeper vessels in the scalp, we digitally removed most of the superficial capillaries seen in Fig. 3(b), with the result shown in Fig. 3(c). From Figs. 3(a)–(c), we can see a clear PA signal amplitude enhancement after optical clearing. Three representative lines were taken from Figs. 3(a)–(c) for further comparison, as shown in Figs. 3(d)–(f). The averaged PA amplitude had increased by about eight times after optical clearing.
Fig. 3.
In vivo PAM of mouse scalp facilitated by optical clearing. (a) PAM image before optical clearing. (b) PAM image with capillaries after optical clearing. (c) PAM image with parts of capillary layer digitally removed after optical clearing. (d–f) PA amplitude along the red dashed line in (a–c). Maximum-amplitude-projection image along the y axis (g) before and (h) after optical clearing. (i) PA amplitude averaged along the x direction of (g) (blue line) and (h) (red dashed line). 3D PA image (j) (Media 1) before and (k) (Media 2) after optical clearing.
We also quantified the optical clearing effect along the depth direction, as shown in Figs. 3(g)–(h). To quantify the total signal enhancement after optical clearing, the averaged PA signal amplitude along the depth was calculated and is shown in Fig. 3(i). Based on Beer’s law, the fitted attenuation coefficients before and after optical clearing were 57.4 cm-1 and 103.1 cm-1, respectively. At first glance, the attenuation appears to have increased after optical clearing. However, since dehydration due to optical clearing caused the total thickness of the tissue to decrease by about 2.57 times [Figs. 3(g)–(h)], the scatter and absorber number density should increase by about 2.57 times. If both the scattering and absorption cross section had remained constant after optical clearing, the attenuation coefficient should have increased by 2.57 times rather than the 1.80 times observed in the experiment. Thus, the scattering or absorption cross section was reduced after optical clearing. Because optical clearing did not affect the absorption cross section, we concluded that the 0.77 times less increase in the attenuation coefficient resulted from the decrease in the scattering cross section. Figs. 3(j) (Media 1) and (k) (Media 2) show 3D renderings of the mouse scalp before and after optical clearing, respectively.
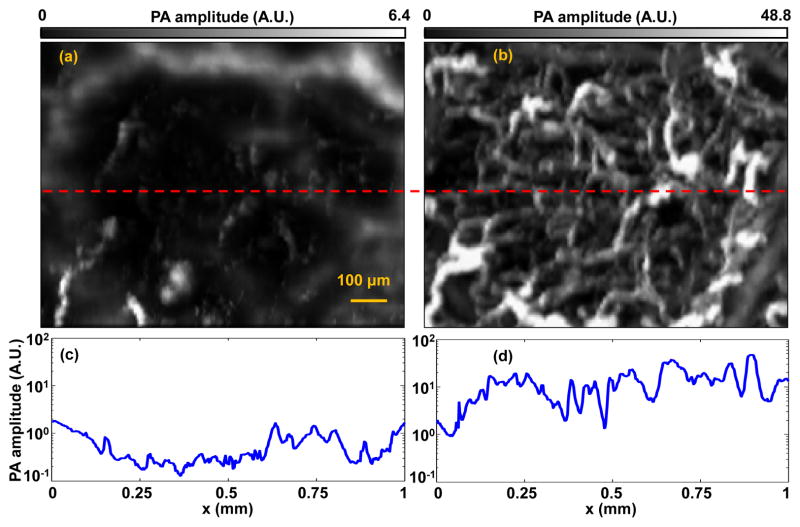
The enhanced PA detection sensitivity after optical clearing enabled better capillary imaging [Fig. 3(b)]. Fig. 4(a) and (b) are close-up images of the red-dashed-square areas in Figs. 3(a) and (b), respectively. The large vessels in the periphery of both images indicate that they are from the same area in the mouse scalp. As shown in Fig. 4(a), very few capillaries can be detected before optical clearing. However, after optical clearing, more capillaries can be distinctly observed, as shown in Fig. 4(b). As shown in Figs. 4(c)–(d), the vessel density increased by about 10 times after clearing, and the averaged PA signal amplitude from individual capillaries increased by a factor of 22. The much denser capillaries and stronger PA amplitudes in Fig. 4(d) indicate that, after optical clearing, the local laser fluence at the capillaries was increased. There were two possible reasons for the increased local laser fluence: (1) enhanced focusing on these capillaries due to the dehydration-induced shrinkage of the tissue, and (2) reduced scattering loss. As shown in Fig. 3(i), because of dehydration, the averaged thickness of the tissue decreased from about 0.88 mm to 0.37 mm. Assuming the light beam intensity had a Gaussian shape, we estimated that the average fluence increase caused by shrinkage was about 5 times. Therefore, we can conclude that the remaining 4.4 fold increase of the PA signal amplitude was due to the decreased scattering coefficient. Because the background noise remained constant during the experiment, the noise-equivalent sensitivity depended only on the PA signal amplitude. Therefore, sensitivity should also increase 4.4 times due to the decreased scattering coefficient.
Fig. 4.
Optical clearing reveals more capillaries. (a–b) Close-ups of PAM images in the red dashed boxes in Figs. 3(a–b). (c–d) PA amplitudes along the red dashed lines in (a–b).
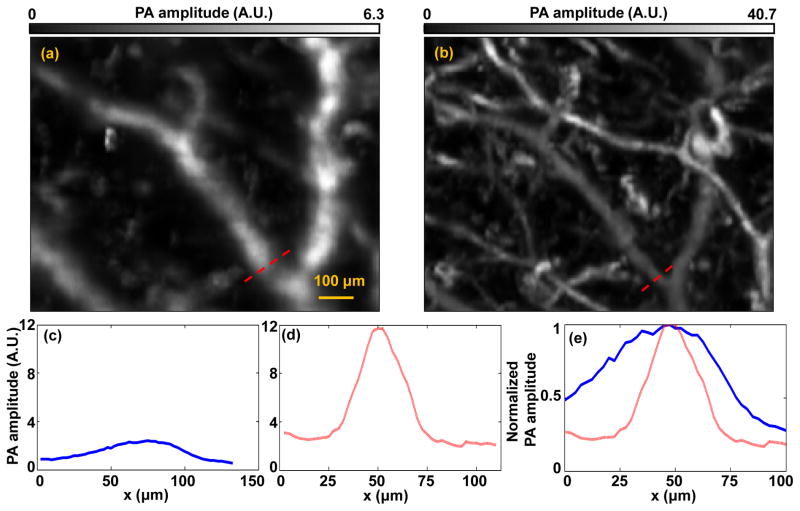
We further analyzed the lateral resolution enhancement after optical clearing. By zooming in on the deeper vessels in Figs. 3(a)–(b), we found that the vessels before optical clearing were much more blurred than those after optical clearing, as shown in Figs. 5(a) and (b). Again, the averaged PA amplitude was increased by about 5 times [Figs. 5(c)–(d)]. More importantly, we also estimated the lateral resolution improvement by comparing the vessel diameters. As shown in Fig. 5(e), a representative vessel had nominal diameters of 75 μm and 30 μm before and after clearing, respectively. We can see that measured vessel diameter decreased at least by 2.5 times after optical clearing. Because the measured vessel diameter was the convolution of the actual lateral resolution with the true vessel diameter, the actual resolution improvement should be better than 2.5 times.
Fig. 5.
Optical clearing improves the lateral resolution for deep vessels. (a) Close-up of PAM image in the green dashed box in Fig. 3(a). (b) Close-up of PAM image in the green dashed box in Fig. 3(c). (c–d) PA amplitudes along the red dashed lines in (a–b). (e) Combined curves in (c) and (d) after normalization.
There are several widely used OCAs, such as glycerol [8], glucose [9–10], and propylene glycol [11]. Among these agents, glycerol has both good clearing efficiency and a long effective time. In addition, because glycerol has also been widely used in the medical, pharmaceutical, and chemical fields, it can be easily accessed. Thus, in all experiments, we elected to use glycerol as the OCA to reduce tissue scattering. To achieve a relatively good clearing result and to reduce the potential tissue damage caused by dehydration, a diluted glycerol-water solution (88%, vol/vol) was used [11]. A higher glycerol concentration may enhance the clearing effect with a higher risk of tissue damage [12].
Because glycerol penetrates very slowly through epidermal tissue, we directly injected the glycerol solution into the tissue to accelerate optical clearing. However, injection may lead to side effects, such as bleeding and edema [12]. To use glycerol without injection, we can explore either physical or chemical approaches, such as using a micro needle array or a dimethyl sulfoxide (DMSO) admixture, respectively [8]. Because high-concentration glycerol may block blood flow [13–14], other safer optical clearing media, such as PEG-400 mixed with thiazone [15–16], should be explored in the future.
To the best of our knowledge, this is the first time that optical clearing was applied to PAM. Our results show that both the penetration depth and lateral resolution of PA imaging can be enhanced by TOC. For back-scattering based optical imaging modalities such as optical coherence tomography, optical clearing can provide deeper penetration depth as well. However, it may destroy some of the intrinsic scattering contrasts that these modalities rely on, which can result in potential information loss. By contrast, photoacoustic imaging is based on optical absorption with 100% sensitivity [1]. Since the optical absorption cross section of the substance (e.g., hemoglobin) remains largely intact in the optical clearing procedure, information loss is avoided. Not only can PA imaging benefit from optical clearing, it can also be used to study the physiological effects induced by optical clearing. With enhanced penetration depth and resolution, PAM will become more valuable for structural, molecular, functional, and metabolic imaging.
Acknowledgments
The authors would like to thank Prof. James Ballard for manuscript editing. We also appreciate technical assistance and useful discussions from Jinyang Liang and Chi Zhang. This research was supported by the National Institutes of Health Grants DP1 EB016986 (NIH Director’s Pioneer Award), R01 EB008085, R01 CA134539, U54 CA136398, R01 CA157277, and R01 CA159959. L.V.W. has a financial interest in Microphotoacoustics, Inc. and Endra, Inc., which, however, did not support this work.
References
- 1.Wang LV, Hu S. Photoacoustic tomography: in vivo imaging from organelles to organs. Science. 2012;335(6075):1458–1462. doi: 10.1126/science.1216210. [DOI] [PMC free article] [PubMed] [Google Scholar]
- 2.Zhou Y, Zhang C, Yao DK, Wang LV. Photoacoustic microscopy of bilirubin in tissue phantoms. J Biomed Opt. 2012;17(12):126019. doi: 10.1117/1.JBO.17.12.126019. [DOI] [PMC free article] [PubMed] [Google Scholar]
- 3.Chen SL, Ling T, Huang SW, Won Baac H, Guo LJ. Photoacoustic correlation spectroscopy and its application to low-speed flow measurement. Opt Lett. 2010;35(8):1200–1202. doi: 10.1364/OL.35.001200. [DOI] [PMC free article] [PubMed] [Google Scholar]
- 4.Yao J, Wang LV. Photoacoustic tomography: fundamentals, advances and prospects. Contrast Media Mol Imag. 2011;6(5):332–345. doi: 10.1002/cmmi.443. [DOI] [PMC free article] [PubMed] [Google Scholar]
- 5.Yao J, Maslov KI, Shi Y, Taber LA, Wang LV. In vivo photoacoustic imaging of transverse blood flow by using Doppler broadening of bandwidth. Opt Lett. 2010;35(9):1419–142. doi: 10.1364/OL.35.001419. [DOI] [PMC free article] [PubMed] [Google Scholar]
- 6.Yao J, Maslov KI, Zhang Y, Xia Y, Wang LV. Label-free oxygen-metabolic photoacoustic microscopy in vivo. J Biomed Opt. 2011;16(7):076003. doi: 10.1117/1.3594786. [DOI] [PMC free article] [PubMed] [Google Scholar]
- 7.Wang LV, Wu H. Biomedical Optics: Principles and Imaging. Wiley; Hoboken, NJ: 2007. [Google Scholar]
- 8.Zhu D, Larin KV, Luo Q, Tuchin VV. Recent progress in tissue optical clearing. Laser & Photon Rev. 2013:1–26. doi: 10.1002/lpor.201200056. [DOI] [PMC free article] [PubMed] [Google Scholar]
- 9.Kinnunen M, Myllylä R. Effect of glucose on photoacoustic signals at the wavelengths of 1064 and 532 nm in pig blood and intralipid. J Phys D: Appl Phys. 2005;38(15):2654. [Google Scholar]
- 10.Myllylä R, Zhao Z, Kinnunen M. Pulsed photoacoustic techniques and glucose determination in human blood and tissue. In: Tuchin Valery V., editor. Handbook of Optical Sensing of Glucose in Biological Fluids and Tissues. Taylor & Francis; 2008. pp. 419–455. [Google Scholar]
- 11.Tuchin VV. Optical clearing of tissue and blood using immersion method. J Phys D. 2005;38:2497–2518. [Google Scholar]
- 12.Wen X, Mao Z, Han Z, Tuchin VV, Zhu D. In vivo skin optical clearing by glycerol solutions: mechanism. J Biophoton. 2010;3(12):44–52. doi: 10.1002/jbio.200910080. [DOI] [PubMed] [Google Scholar]
- 13.Vargas G, Readinger A, Dozier SS, Welch AJ. Morphological Changes in Blood Vessels Produced by Hyperosmotic Agents and Measured by Optical Coherence Tomography. Photochem and Photobiol. 2003;77:541–549. doi: 10.1562/0031-8655(2003)077<0541:mcibvp>2.0.co;2. [DOI] [PubMed] [Google Scholar]
- 14.Zhu D, Zhang J, Cui H, Mao Z, Li P, Luo Q. Short-term and long-term effects of optical clearing agents on blood vessels in chick chorioallantoic membrane. J Biomed Opt. 2008;13(2):021106. doi: 10.1117/1.2907169. [DOI] [PubMed] [Google Scholar]
- 15.Zhu D, Wang J, Zhi Z, Wen X, Luo Q. Imaging dermal blood flow through the intact rat skin with an optical clearing method. J Biomed Opt. 2010;15(2):026008. doi: 10.1117/1.3369739. [DOI] [PubMed] [Google Scholar]
- 16.Wang J, Shi R, Zhu D. Switchable skin window induced by optical clearing method for dermal blood flow imaging. J Biomed Opt. 2012;18(6):061209. doi: 10.1117/1.JBO.18.6.061209. [DOI] [PubMed] [Google Scholar]


