Abstract
Geometric modeling of biomolecules plays an essential role in the conceptualization of biolmolecular structure, function, dynamics and transport. Qualitatively, geometric modeling offers a basis for molecular visualization, which is crucial for the understanding of molecular structure and interactions. Quantitatively, geometric modeling bridges the gap between molecular information, such as that from X-ray, NMR and cryo-EM, and theoretical/mathematical models, such as molecular dynamics, the Poisson-Boltzmann equation and the Nernst-Planck equation. In this work, we present a family of variational multiscale geometric models for macromolecular systems. Our models are able to combine multiresolution geometric modeling with multiscale electrostatic modeling in a unified variational framework. We discuss a suite of techniques for molecular surface generation, molecular surface meshing, molecular volumetric meshing, and the estimation of Hadwiger’s functionals. Emphasis is given to the multiresolution representations of biomolecules and the associated multiscale electrostatic analyses as well as multiresolution curvature characterizations. The resulting fine resolution representations of a biomolecular system enable the detailed analysis of solvent-solute interaction, and ion channel dynamics, while our coarse resolution representations highlight the compatibility of protein-ligand bindings and possibility of protein-protein interactions.
Keywords: Variational multiscale modeling, Multiresolution surface, Energy functional, Meshing, Curvature, Electrostatics
1 Introduction
In the past two decades, an enormous amount of experimental data collected from biological systems has paved the way for the transition from the traditional qualitative description to quantitative analysis in biomolecular sciences. A fundamental ingredient of quantitative biology is geometric modeling. Aided by increasingly powerful high performance computers, geometric modeling has become an essential apparatus not only for the visualization of biological data, but also filling the gap between structural information and theoretical models of biological systems [81, 80]. Especially, the annotation of biomolecular surfaces together with physical features, such as electrostatics and lipophilicity, contributes tremendously to the molecular recognition in protein-protein interaction and rational drug design. The definition of molecular surfaces is of essential importance in geometric modeling. One of the first visualization models is the Corey-Pauling-Koltun (CPK) model proposed in 1953 [19, 48], in which the atoms of a molecule are represented as space-filling three-dimensional spheres with van der Waals radii. Unlike the cumbersome atomic and molecular orbital models, which are based on quantum mechanical theory of atoms and molecules, the space-filling surface representations are much simpler. Therefore they have been widely applied to molecular biosciences. Another simplified model for macromolecules is the backbone model [63], which depicts helices and strands as flat or coiled ribbons, and only retains the sequence of Cα atoms. This model is suitable for illustrating the biomolecular structural constitutions.
In many situations, the visualization of macromolecular surfaces is of crucial interest. For example, the visualization of electrostatic potentials on protein surfaces sheds light on biomolecular structure, function and interaction, including ligand-receptor binding sites, protein specification, drug effect, macromolecular assembly, protein-nucleic acid and protein-protein interactions, and enzymatic mechanism [58, 62, 22]. In the past, several molecular surface models have been developed. Among them, the van der Waals surface (vdWS) is straightforward and is defined as the parts of the atomic surfaces that form the geometric boundary of the CPK model. Another commonly used surface representation is the solvent accessible surface (SAS) defined as the trajectory of the center of a probe sphere moving around the van der Waals surface [50]. It is known that both vdWs and SASs are non-smooth at intersection areas where two or more atoms join together. To remove these non-smooth regions, the solvent excluded surface (SES), also known as the Connolly surface [18] or molecular surface, was introduced [61]. The SES is created by tracing the inward moving surface of a probe sphere rolling around the van der Waals surface. Basically, it has two major parts, the contact areas formed by the subsets of the vdWs surface and the re-entrant surfaces, which contain toroidal patches and concave spherical triangles. Connolly developed the dot surface representation for vector type display and derived the analytical expressions for the re-entrant surface [18]. The SES is very popular and has been applied to protein-protein interactions [20], protein folding [71], protein surface topography [49], DNA binding and bending [25], macromolecular docking [44], enzyme catalysis [52], drug classification [6], and solvation energies [60]. The SES model is also used in implicit solvent theories [1, 9], molecular dynamics [36] and ion channel transport [9, 82, 83]. Computationally, efficient algorithms for computing SES are developed or introduced, such as alpha-shapes [12], and marching tetrahedra [8].
All the above-mentioned surface models admit geometric singularities, namely, cusps, sharp corners, and self-intersections [18, 28, 41, 66], which tend to induce instability in numerical simulations and require advanced mesh generation algorithms. Additionally, geometric singularities hinder the curvature estimation of any given molecular surface. To avoid the geometric singularities, the molecular skinning surfaces employ only spherical and hyperboloid patches, resulting in continuous normal vector fields on the whole surface [57]. Another class of smooth surface models are molecular Gaussian surfaces [81, 38]. They represent atoms by Gaussian functions and the surface is define as a level set function. Gaussian surfaces might not be completely smooth and require further treatments in geometric modeling [81, 84]. Spherical harmonic expansion has been used in molecular surface generation [55]. Through truncation on different numbers of harmonic polynomial series, it attains a multiresolution description of the molecular surface. From the physical point of view, molecule models should be a continuous representation of their electron density distribution. Thus molecular surfaces are associated with iso-contours extracted from these electron density distribution. The electron density isosurfaces [43] and molecular faces [42] belong to this category. These surfaces are based on quantum mechanical principles and thus, may be expensive to construct. Another issue is that the electron density distributions of molecule vary with the molecule’s interacting environment.
One of the first curvature driven partial differential equations (PDEs) was proposed for biomolecular surface formation in 2005 [75]. In this approach, atomic coordinates and radii are incorporated in a hypersurface function to define curvature-controlled surfaces via geometric flows. The surface is obtained by extracting a certain isovalue from the steady state and is free from geometric singularities. With the consideration of the surface energy minimization, the variational formulations of biomolecular surfaces was introduced in 2006 [3, 4]. A surface energy functional is constructed in this approach, and a mean curvature flow equation can be derived from the variational principle for biomolecular surface evolution and formation. The surface generated from this approach is called the minimal molecular surface (MMS) and has been applied to many small compounds and proteins [3, 4, 2]. Surface generation using the PDE transform was introduced recently [84].
In chemical and biological systems, molecules function in aqueous environments and the solvation process is of paramount importance. To take into account the nonpolar solvation effects, a variational solvation model was proposed [16] and validated with experimental data of tens of compounds. The solvation of most biomolecules involves electrostatic interactions and thus a full solvation model involving polar solvation effects is required. Differential geometry based solvation models were proposed [74, 13, 14, 15]. A series of variational multiscale models has been introduced [74, 76] for the structure, function, and dynamics of biomolecular systems, including ion channels, viral infection, protein-protein interaction and protein-ligand interaction. In these models, the total energy functional is built for systems that are either at equilibrium or far from equilibrium. Using the variational principle, coupled systems of governing equations are derived and biomolecular surfaces can be obtained from the surface evolution equation (i.e., the generalized Laplace-Beltrami equation). Unlike the MMS, which can be viewed as a geometric (curvature) driven surface, the formation of the biomolecular surface in variational multiscale models is driven by both geometric and potential effects.
Surface evolution and formation can be carried out in either the Eulerian representation or Lagrangian representation. Both representations are important due to their respective advantages in certain theoretical models and computations. Computationally, the Eulerian representation is desirable for finite difference type of settings, in which each node of the volumetric Cartesian grid is associated with a particular value. The Lagrangian representation is typically associated with finite element and boundary element approaches. Triangle meshes is usually employed for the surface mesh. Very often, these two representations are interconvertible and the structural information in one representation can be transformed into another [14]. In our recent work, we have presented mathematical models and computational techniques for geometric modeling in the Eulerian representation [78]. An emphasis was about the processing and treatment of cryo-electron microscopy (cryo-EM) data. Techniques for extracting biomolecular surface features, namely, electrostatic maps, curvatures, concave regions and convex regions, have been proposed [78].
With a given surface, the surface meshing and volumetric meshing [67, 24] are important tasks as in the continuum mechanical analysis [56, 59, 65]. Many elegant methods have been developed, including such as the probabilistic methods for centroidal Voronoi tessellations [26, 45], the optimal Delaunay triangulation and graph cut based variational surface reconstruction [72], and other surface remeshing enhancement methods and technologies [68, 64, 67, 73, 37], to generate high quality triangle surface meshes that are low-noise, low memory cost, near 60° for majority of element angles and aligned with the physical features. Feature-preserving methods for biomolecular surface meshing were proposed [81, 80]. The Delaunay triangulation implemented in TetGen [70] was employed for volumetric meshing [81, 31]. Trace technique and triangulated manifold meshing method were also used for molecular surface mesh generation [10, 11].
The Hadwiger integrals, namely, volume, area, mean curvature and Gaussian curvature are also important geometric quantities in the Minkowski functional space. Curvature of a surface is a measure of how much it deviates from being flat [47]. Curvature has been used to analyze the stereospecificity of biomolecular surfaces [17] and membrane bending energy. In general, curvatures are useful geometric descriptors for shape characterization [31].
The objective of the present work is to present theoretical models and computational algorithms for the geometric modeling of macromolecules in the Lagrangian representation. We present a family of differential geometry based surfaces obtained from a variational multiscale framework. These surfaces differ in their detailed considerations of physical, chemical, and biological interactions. Total free energy functionals are constructed to put microscopic descriptions of biomolecules and continuum descriptions of solvent on an equal footing. By using the variational principle, governing equations for different components are derived. We illustrate the construction of multiresolution biomolecular surfaces from our variational multiscale paradigm. The selection of appropriate resolutions highlights desirable chemical and biological features. Techniques for surface extraction and finite element meshing are discussed. Biomolecular surfaces are further characterized by various Minkowski measures, including volume, area, mean curvature and Gaussian curvature, which are potentially important to protein-protein interaction, protein-ligand binding and protein-DNA/RNA specification.
This paper is organized as follows. Section 2 is devoted to the theory and formulation of variational multiscale models for macromolecular systems. We first briefly review the variational derivation of the mean curvature model which generates the MMS. This variational approach is extended to including nonpolar and polar interactions. A density functional approach for ionic species is also discussed. Coupled governing equations are derived to describe multiresolution surfaces and associated electrostatic maps. In Section 3, the realization of our multiscale and multiresolution representations is demonstrated. Numerical algorithms and computational methods for surface meshing and volumetric mesh generation are presented. Techniques for the estimation of various curvatures, such as Gaussian, mean, maximum principal and minimum principal curvatures, are provided. To illustrate these methods and algorithms, we carry out extensive numerical experiments in Section 4. This paper ends with a conclusion.
2 Theory and models
In this section, we discuss the differential geometry based multiscale surface generation. The minimal molecular surface is constructed by using the variational principle applied to a surface free energy functional. When the nonpolar energy is considered, surface formation is governed by geometric and potential driven flows. For more realistic solvation process, multiscale models of the biomolecular system at equilibrium or non-equilibrium state are developed. Generalized Laplace-Beltrami, generalized Poisson-Boltzmann and generalized Nernst-Planck equations are derived to describe surface evolution, electrostatic potential distribution and charged species concentrations, respectively.
2.1 Minimal molecular surface
Minimal surfaces, such as the shapes of soap bubble films and of tensile membranes in architecture, are omnipresent in nature and man-made materials, as the result of surface free energy minimization to reach a stable equilibrium. Based on the energy minimization principle, the MMS is introduced to remove geometric singularities in traditional molecular surfaces, i.e., vdW surface, SAS, and SES. Numerically, geometric singularities cause the computational instability. Physically, geometric singularities do not exist in biomolecular systems as atomic or molecular electron densities overlap.
In our variational models, a hypersurface function S(r) is defined to describe the biomolecular surface. It is convenient to set S(r) = 1 for the region inside the macromolecule and S(r) = 0 for the solvent domain. Under the action of the Laplace-Beltrami flow described below, the hypersurface function S(r) will gradually become continuous and carry the geometric shape of the biomolecule. The final MMS is obtained by iso-surface extraction from S(r). We define γ as the surface tension and Area as the enclosed area of the biomolecular surface. The computational domain is represented by Ω ∈ ℝ3. The surface free energy can be expressed as [74]
| (1) |
where coarea formula from the geometric measure theory [29] has been used to describe the surface area as a volume integral. The energy minimization process can be done through the Euler-Lagrange equation. By introducing an artificial time t, a generalized Laplace-Beltrami equation is obtained [4, 74, 13, 14],
| (2) |
where S = S(r, t) depends on the artificial time t. The MMS can be extracted from the steady state solution under the constraint that the surface encloses vdWS[4].
2.2 Surfaces derived from nonpolar solvation analysis
The solvation process is of fundamental importance to the quantitative description and analyses of biomolecular systems, because almost all important biological processes, such as DNA replication, transcription and translation, protein folding, protein-protein interaction, and protein-ligand binding, occur in aqueous environment. Solvation free energy, which can be measured experimentally, is the major physical observable for a solvation process. Typically, solvation free energy consists of two parts, the polar contribution and the nonpolar contribution. The nonpolar energy can be further divided into three components, including surface energy, energy for creating a solute cavity in the solvent, and solvent-solute interaction [33, 35, 51, 34]
| (3) |
where γ is the same surface tension as we mentioned above, “Area” and “Vol” are respectively the solute surface area and volume, p is the hydrodynamic pressure, and U denotes the solvent-solute non-electrostatic interactions. The integration is over the solvent domain Ωs.
Usually, the solvent has multiple species. Therefore, the solvent-solute interaction potential U can be rewritten as the summation of all the interactions between the solvent species and the solute molecule,
| (4) |
where ρα is the density of the αth solvent component, and Uα is the interaction potential of the αth component of the solvent.
In the aqueous environment, each solvent species interacts with solute and other solvent species. Especially for charged ions, they can form ion-water clusters and constantly influence each other. To take the general correlations into account, the interaction potential is further elaborated as
| (5) |
where Uαj is the interaction potential between the jth atom of the solute and the αth component of the solvent, and Uαβ is the interaction potential between the αth and the βth components of the solvent. In principle, Uα can take any desirable form. In the past, the Lennard-Jones potential was used to approximate the solvent-solute non-electrostatic interactions [13, 14]. The solvent-solvent interaction can be represented by the van der Waals potential as well. The potential Uαβ(r) can be expressed in an integral form,
| (6) |
where ε̄αβ is the well-depth parameter, and σα and σβ are the radii of the αth and βth solvent component.
Using the hypersurface function S defined in the previous section, the nonpolar energy can be expressed as
| (7) |
Note that the term 1 − S(r) is the indicator function of the solvent domain. By means of the Euler-Lagrange equation, we have
| (8) |
With an artificial time, the above condition can be turned into the following generalized Laplace-Beltrami equation [4, 74, 13, 14]
| (9) |
The surface for nonpolar solvation models can be obtained by extracting a certain isovalue from the steady state solution of the above generalized Laplace-Beltrami equation.
2.3 Surfaces derived from full solvation analysis
In most situations, the solvation process involves also a polar contribution due to the electrostatic interactions. In the equilibrium state, the polar energy can be estimated based on the Poisson-Boltzmann theory. Since Sharp and Honing introduced the variational formulation of Poisson-Boltzmann theory in 1990 [69], several similar approaches have been discussed in the literature [40, 27, 74]. The total polar solvation energy can be written as an integral equation. In this work, we modify the Boltzmann distribution of the αth solvent species as
| (10) |
where kB is the Boltzmann constant, T is the temperature, ρα0 and ρα respectively denote the reference bulk concentration and the concentration distribution of the αth solvent species, Φ is the electrostatic potential, and qα denotes the charge valence of the αth solvent species, which is zero for an uncharged solvent component. The new term μα0 is a relative reference chemical potential which reflects the difference in the equilibrium concentrations of different solvent species, i.e., ρα ≠ ρβ, given that ρα0 = ρβ0. In Section 2.4, it can be seen that Boltzmann distribution (10) occurs naturally as an equilibrium condition. Here Uα is the interaction potential of the αth component of the solvent as described in the Section 2.2.
With the new Boltzmann distribution formulation, the total polar energy functional can be represented as,
| (11) |
where Φ is the electrostatic potential, εs and εm are the dielectric constants of the solvent and solute, respectively, and ρm represents the fixed charge density of the solute. Specifically, one has the form of ρm = Σj Qjδ(r − rj), with Qj denoting the partial charge of the jth atom in the solute.
The total solvation energy functional is the combination of polar energy (11) and nonpolar energy (7),
| (12) |
We emphasize that the interactions (1 − S)U are not omitted here, but embedded in Boltzmann distribution. If we assume kBT ≫ qαΦ + Uα − μα0, the Boltzmann term can be approximated by
| (13) |
Therefore, the interactions have already been accounted for in our modified Boltzmann distribution. However, the decomposition of the total solvation energy into the polar and nonpolar parts is by no means unique. The interactions will influence the concentration distributions, especially for the charged species [74, 13].
Once the total energy functional in Eq. (12) has been determined, the variational principle is applied to derive governing equations,
| (14) |
| (15) |
Equations (14) and (15) are obtained by the minimization of the total solvation free energy functional with respect to S and Φ, respectively. A coupled system, including a generalized Laplace-Beltrami equation and generalized Poisson-Boltzmann equation, is obtained,
| (16) |
| (17) |
where the potential driven term V1 is given by
| (18) |
and ε(S) = (1 − S)εs + Sεm is a generalized permittivity function. For the generalized Laplace-Beltrami, an artificial time is introduced as discussed in the earlier work [4, 74, 13, 14]. These coupled equations are called the Laplace-Beltrami and Poisson-Boltzmann (LB-PB) equations. The numerical experiments demonstrated good predictions compared with the experimental results. Thus, this model can be used to describe the solvation at equilibrium.
The generalized potential in Eq. (5) takes into consideration of the interactions between solvent species and those between solvent and solute. Therefore, Eqs. (16) and (17) should be able to capture the detailed microstructural characteristics such as size effect and ionic double layer effect [5], as is the classical density functional theory [39, 79].
2.4 Surfaces derived from charge transport analysis
Charge transport is a common phenomenon in complex physical, chemical, and biological systems and engineering devices, such as fuel cells, solar cells, battery cells, nanofluidics, transistors, and ion channels. These systems are usually far from equilibrium, and thus the models for the equilibrium state as we have discussed in the above section cannot be used. On the other hand, as a response to the perturbation, a nonequilibrium system might evolve towards the equilibrium driven by spatial gradients. In this section, a chemical potential related free energy is considered to describe multispecies mixing.
For simplicity, the flow stream velocity and chemical reaction are not considered. We define as a reference chemical potential of the αth species at which the associated ion concentration is ρ0α given Φ = Uα = μα0 = 0. With the consideration of the entropy of mixing and osmotic effect, the chemical potential related free energy is expressed as [32]
| (19) |
where is the entropy of mixing, and −kBT(ρα − ρα0) is a relative osmotic term [54]. The total free energy for a charge transport system can be expressed as the summation of the nonpolar energy, polar energy and chemical related free energy,
| (20) |
The total free energy functional (20) is a function of the surface function S, electrostatic potential Φ and the ion concentration ρα. By applying the variational principle with respect to S, Φ and ρa, one has
| (21) |
| (22) |
| (23) |
where is the relative generalized potential of species α, and vanishes at equilibrium. Therefore, we have at equilibrium
| (24) |
In case of nonequilibrium, Fick’s first law says that the relative generalized potential leads to ion fluxes with Dα being the diffusion coefficient of species α. Fick’s second law predicts the Nernst-Planck equation . Together with the generalized Laplace-Beltrami equation and generalized Poisson equation obtained from the above Euler-Lagrange equations (23) and (22), a coupled system is obtained,
| (25) |
| (26) |
| (27) |
where qαΦ+ Uα can be identified as a form of the potential of the mean field. Here, the external potential term V2 is expressed as
| (28) |
Note that the same technique of introducing the artificial time for the generalized Laplace-Beltrami equation is used. This coupled system is called the Laplace-Beltrami Poisson-Nernst-Planck (LB-PNP) model.
3 Algorithms and techniques
In this section, we present a collection of computational tools for converting the above defined implicit surfaces to explicit surfaces, and for the subsequent evaluation of important global and local geometric properties and electrostatic maps on these surfaces. Initial data downloaded from the Protein Data Bank (PDB) are used as inputs of the LB, LB-PB and/or LB-PNP models.
3.1 Multiresolution representations
The coupled systems of LB-PB or LB-PNP are multiscale models. Partial charges in the protein molecules are explicitly described as point charges using Dirac delta functions. The charged species in the solvent are described in terms of concentrations, which either follow Boltzmann distributions or are governed by the Nernst-Planck equation. These different representations reduce the number of degrees of freedom and, at the same time, maintain certain accuracy. The multiscale surfaces can be extracted from the solution of the generalized Laplace-Beltrami equation. Appropriate initial conditions for the geometric flow equation can lead to multiresolution representations of different geometric and topological features.
For the generalized Laplace-Beltrami (LB) equation, the initial condition is set as an enlarged van der Waals surface in a 3D domain. Under the biological constraint, the hypersurface is evolved according to the generalized LB equation. With appropriate preprocessing [9] of the data from the PDB, we obtain atom positions ri = (ri,x, ri,y, ri,z), i = 1, · · ·, n, atom radii ri, i = 1, · · ·, n and also the atomic charge information. Here n is the total number of the protein atoms. It is useful to define two sets,
| (29) |
and
| (30) |
where η > 1 is a parameter which can be adjusted to give different initial conditions. The initial value of S(r, t) is set to
| (31) |
We also set S(r, t) = 1 ∀r ∈ Dχ as a constraint. Usually, for the same number of iterations, a larger η parameter gives a “thicker” surface, which means that the fine structures are merged and a “coarser” representation of the molecular surface is obtained. A large η parameter can help us omit atomic details and focus on desirable molecular (global) features relevant to certain protein-protein interactions or protein-ligand bindings.
Another way to generate multiresolution representations is to adjust the number of iterations in solving the generalized LB equation. Instead of reaching the steady state, we stop the iteration earlier (i.e., selecting a finite total evolution time tt in S(r, tt)). This procedure with different choices of tt enables us to achieve different resolutions.
Yet another approach for multiresolution surfaces is to extract different iso-values (i.e., selecting C in S(r, tt) = C) of a given hypersurface function (S(r, tt)) as illustrated in our earlier work [75]. Typically, a lager C value gives rise to a higher resolution molecular surface, while a smaller C leads to highlighting global surface features.
The “coarse” resolution can be useful if one needs to capture some global characteristics of the protein, like holes, concave subdomains and convex regions. As the surface electrostatic distribution is calculated simultaneously, this multiscale multiresolution models can have a great potential in analyzing the protein-protein interaction and protein-ligand binding.
3.2 Lagrangian representations and surface extraction
Representing 3D regions using an indicator function as in the above definitions requires intrinsically a large amount of memory storage, which scales as a cubic function of the resolution in each dimension. The difficulty can be alleviated by using adaptive data structures such as the octree. However, the implicit representation can still be inefficient to generate exact sample points and their geodesic neighborhoods on such surfaces. Thus, for geometric processing tasks that involve evaluation of properties that depend on a local neighborhood of a point on the surface, such as curvature, it is far more efficient to first convert the implicit representation to an explicit one, i.e., a Lagrangian representation.
Another advantage of the Lagrangian representation is that the sampling points can move with the surface when it undergoes geometric deformation, or simply a smoothing process. In contrast, implicit indicator functions are sampled on regular grid points fixed in 3D space, i.e., Eulerian. In addition, the Eulerian representations are prone to grid alignment artifacts in geometry processing procedures.
The shape of a nondegenerate smooth 3D object can be defined through its boundary surface. In geometric modeling, such a representation using boundary surfaces is called boundary representation, or B-rep for short[77]. The curved 2D surface is often tessellated into a collection of faces (2D cells) connected through common edges (1D cells) or vertices (0D cells). For efficient cell incidence and adjacency queries, there are a number of popular B-rep data structures mostly designed based on the connectivity information of each edge. We will discuss one such structure, the halfedge data structure, in the next subsection. Here, we first introduce the basic concepts and the commonly used face-based triangle mesh data structures, which are also the basic forms of most common standard file formats for the Lagrangian surface representations.
Triangle meshes
Triangle meshes are the de facto standard in geometry processing. Mathematically, it can be defined as a specific type of 2D simplicial complex. A 2D simplicial complex can be defined as a 3-tuple (V, E, F), where V = {v0, v1, …} is a set of vertices, E = {{vi, vj}, …} is a set of edges connecting vertices {vi, vj}, …, and F = {(vi, vj, vk), …} is a set of (counterclockwise oriented) triangles, each with 3 vertices as its corners. All edges of the triangles in F must also be in E, and all vertices of the edges in E must be in V as well. The simplicial complex provides the connectivity information of the cells. If the triangles incident to each vertex form a disk-like topology, the simplicial complex represents a 2D manifold. Assigning 3D coordinates to each vertex, using the straight line segment linking the pair of vertices to represent each edge, and using the flat triangle formed by the three vertices to represent each face, we can embed the simplicial complex in the 3D Euclidean space. It is called a geometric realization of such a simplicial complex, assuming no self-intersection among the triangles. Such a geometric realization is called a triangle mesh.
Given any closed smooth 2-manifold embedded in the 3D Euclidean space (i.e., the boundary surface of a regular 3D object), it can always be approximated by such a triangle mesh, just as a smooth function can always be approximated by piecewise linear functions. A typical file storing such data simply consists of a list of vertex coordinates (3 floating point numbers per vertex) followed by a list of triangles (3 vertex indices per triangle).
Marching cubes
If a 3D function S is non-degenerate (i.e., all of its critical points are non-degenerate), its level set surface M = {r|S(r) = 0} is indeed a 2D manifold. Marching cubes method [53] is a standard procedure for surface extraction from implicit functions stored on regular grids. First, all the intersection points of the surface with grid edges are found and stored as the list of vertices, by checking whether each grid edge has end points with different signs for the function. The exact location is calculated assuming that the function values are linearly interpolated along each grid edge. Then, the algorithm “marches” through all the cubes, adding triangles to the triangle list by connecting the surface vertices in the cube. The connectivity within each cube is constructed by checking a lookup table for all possible 28 cases indexed by the signs at the 8 corners. The number of cases is reduced to 15 by symmetry in practice.
Dual contouring
An alternative method called dual contouring [46] extracts an isosurface of the implicit function by first generating surface vertices in the interior of each volume cell (of a regular grid or an adaptive octree), followed by constructing a polygon per edge that intersects the isosurface.
3.3 Finite element meshing
For finite element analysis of molecular surfaces, it is often not enough to have just a triangle mesh, but necessary to also produce one with high quality element shapes. One practical approach is to go through a remeshing process on the results of the marching cubes method or its variants, where the geometric locations of the sample points (vertices) can be optimized and/or the topological connectivity is also optimized so that the mesh quality is improved for the target application. This process leads to a semi-regular mesh with most of its vertices neighboring six triangles. Alternatively, meshes with well-shaped triangles can be directly produced through a constrained 3D Delaunay refinement if an implicit surface is given in the form of a level set of a 3D function [7].
Another requirement for performing finite element analysis on meshes is that incidence relations (e.g., face-edge, or edge-vertex) and adjacency information (e.g., face-face, edge-edge, or vertex-vertex) should be performed with constant time complexity. Such incidence/adjacency information is essential in constructing differential operators, solving differential equations, evaluating geometric quantities, or even simply reducing geometric noise. To provide such efficient query capability, a large number of data structures have been proposed, including winged edge, halfedge, and combinatorial maps.
Halfedge data structure is among the most popular ones in computer-aided geometric design and in geometry processing. It is based on the observation that each edge is adjacent to exactly two polygon faces for a manifold surface, so the connectivity information for each edge-face pair (halfedge) can be stored in a fixed length array. Other incidence/adjacency information can then be restored from the connectivity of halfedges in constant time. In the implementation details of halfedge data structure, each edge in the mesh is split into two halfedges with opposite orientations. Each halfedge stores the references to its incident face, incident vertex, and opposite halfedge. Each face and vertex store one reference to one of its incident halfedges. Traversal from each element to another element is achieved through halfedges.
While halfedge data structure is widely used for representing surface meshes, it is not designed for volumetric meshes. Volumetric meshes are defined as the polyhedral representation of the object’s inside volume. From the data structure point of view, the main difference between volume mesh and surface mesh is whether it includes 3D cell information. Volumetric meshes can be described by combinatorial maps, which provide a way to describe the volume structure using darts (extension of halfedge from edge-face pair to edge-face-cell triple) and maps between darts. There are a number of existing tools to generate volumetric meshes. In this work, we compare two of them, which produce good polygon shapes and provide enough information to reconstruct the combinatorial maps to query the adjacency information. In our implementation, we employed a compact data structure designed for combinatorial maps in 3D [30].
3.4 Surface area and surface enclosed volume
Surface area evaluation for surfaces in Lagrangian representation is straightforward. One only needs to sum up all the triangle areas. The process is essentially akin to taking the Riemann sum for evaluating the definite integral of a continuous function. Thus, it converges to the actual surface area, provided that the underlying surface is continuous.
To evaluate the volume of the 3D object/region enclosed by a surface, one may take the integral of the flux of one third of the coordinates field across the surface boundary. This can be proved by the divergence theorem (Gauss’s law), since the divergence of one third of the coordinates field is 1. Alternative, it can be computed by summing up the signed volumes of all tetrahedra formed by boundary triangles and the origin of the 3D coordinate system.
The accuracy of the above surface area and the volume estimates depends on the extracted mesh quality. If one computes these values on a coarse mesh, one will end up with results with a large deviation from the true value of the underlying smooth surface. However, as the discretization on the original surface becomes finer, the values of the computed area and volume will become closer to the real values of the objects that the meshes represent.
3.5 Electrostatic analysis on surface meshes
To compute the areas of different regions defined by certain properties, such as electrostatics, associated to surface points, we can get a rough and quick estimate by classifying entire triangles into such regions, and sum up the triangle areas in each region. For example, to compute the area of the regions with positive polarity, we can classify each triangle with at least two positive vertices into such regions. For our specific analysis of protein data models, we can classify the surface of the protein model as positive charge regions, negative charge regions and neutral regions. Different types of regions of the surface with different charge densities could be used to analyze the chemical and physical properties of the surface of the protein.
For improved accuracy, we can compute the fractional area within a triangle, assuming linear interpolation of the indicator function stored at each vertex. For instance in Figure 1, given the triangle with vertices vi, vj, and vk, if both vi, vj are with positive charge density, and vk is with negative charge density, we can compute the proportion of the negative parts of edge vivk and edge vjvk. If the proportions are s and t, respectively, the area of the negative part within the triangle would be stA (in red), where A is the total area of the triangle. The rest part would be the area for the positive part (in blue). However, once our mesh refines, the computed area difference between the results produced by the above two methods will diminish.
Figure 1.
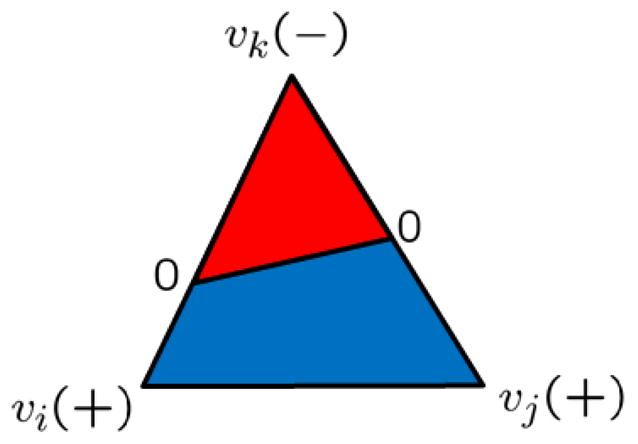
Fractional area. Red is the fractional area for the negative portion; blue is for the positive portion.
3.6 Curvature analysis
Curvature is an important measure describing the rate of change of the normal field near a surface point when moving along different tangent directions. For smooth 2D surfaces, it can be represented as a two-by-two matrix, i.e., the Jacobian of the normal field with respect to motions in the 2D tangent plane. It is often necessary to estimate a smooth curvature tensor field through averaging within geodesic disks around the point of interest, since the direct evaluation of normal change rate would end up with Dirac-like functions since the normals change abruptly across triangle edges. Furthermore, molecular surfaces with geometric singularities do not give rise to valid curvature analysis.
Another approach to get such curvature measurements would be to use differential geometry theorems establishing equivalent expressions to directly estimate Gaussian and mean curvatures (two invariants of the curvature tensor under the rotation of the coordinate systems within the tangent plane).
In the following, we introduce the concepts of first fundamental form and second fundamental form [4, 14] and use them to derive common curvature descriptors used to analyze the surface properties.
For a parameterization x(u, v) = (x(u, v), y(u, v), z(u, v))T on surface M (Figure 2), we form a basis (xu, xv) for the tangent space TP M spanned by the two tangent vectors at point P. Here, we have
Figure 2.
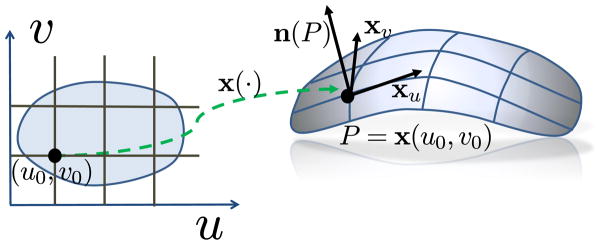
A parameterization of the surface patch shown at the right.
| (32) |
The first fundamental form is defined by the inner products between the basis vectors (namely, xu and xv)
| (33) |
| (34) |
| (35) |
The above equations can be written in a matrix form,
| (36) |
The first fundamental form provides a way to measure distance-related quantities on surface M, such as length, angle and area. Let du and dv be infinitesimal changes in u and v direction respectively in the UV parameter domain. For a point P (u0, v0) on surface, we have Taylor’s expansion at the first order approximation
| (37) |
The length induced by (du, dv) on surface would be
| (38) |
The same analysis also works for area. The area of a parallelogram with corners (u0, v0), (u0+du, v0), (u0, v0 + dv) and (u0 + du, v0 + dv) can be approximated by
| (39) |
where g = det(IP) is the Gram determinant.
The unit normal vector associate with point P on M is determined by the cross product of the basis
| (40) |
By defining the normals, we introduce a very important concept called the Gauss map n(·) of the surface M, which maps each point P on the surface M to the unit normal n(P) at the point, seen as a point on the unit sphere. It encodes all the geometric information related to the local shape around a point. As the normal at a point on the unit sphere centered at the origin is simply the point itself, the corresponding points on the surface and the unit sphere share the same normals. Figure 3 illustrates the concept of the Gauss map. We show the image of a curve on the surface patch under the Gauss map, along with the images of three sample points on that curve.
Figure 3.
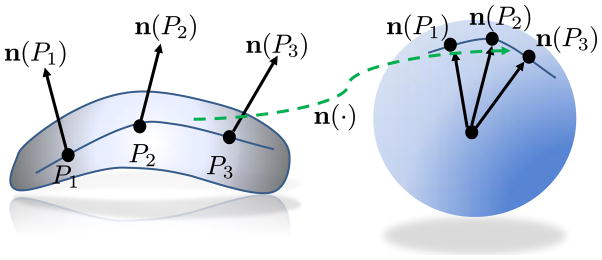
The Gauss map from the surface patch to the unit sphere.
For instance, under the Gauss map, all the points of a flat plane are mapped to a single point on the unit sphere. The points on a cylinder will be mapped to a circle. The tangent planes of the point and of the image under the map are parallel to each other. By using the Taylor expansion, we have
| (41) |
A tangent vector w = (du, dv)T ∈ TP M is mapped to another tangent vector (nudu, nvdv) under Gauss map, both of which can be regarded as in the same tangent plane. We rewrite the mapping for the tangent vectors as the derivative of the Gauss map
| (42) |
where nu and nv are the images of the two basis vectors xu and xv, resp., on the tangent plane, which can be expressed in the basis of the tangent plane itself
| (43) |
and
| (44) |
Thus, Eq. 42 in the matrix form representing the mapping from TP M to TP M with the basis (xu, xv) is
| (45) |
With a careful examination, we can see that
| (46) |
where L, M and N are defined as
| (47) |
| (48) |
and
| (49) |
The second matrix on the right hand side is a bilinear form in the tangent plane called the second fundamental form, which encodes the local shape variation around a point on surface:
| (50) |
One can evaluate the two eigenvalues of the shape operator dn = I−1II. These two eigenvalues are referred to as the principal curvatures. The larger eigenvalue is called the maximum curvature κ1 and the smaller one is called the minimum curvature κ2. The eigenvectors associated with eigenvalues are called the principal directions. We can define Gaussian curvature K and mean curvature H as follows:
| (51) |
| (52) |
The above two formulas can be transformed to another useful representation of K and H:
| (53) |
| (54) |
These two pairs of curvatures are important indicators of the local shape around a point on surface. We show their combinations in Table 1 to illustrate the common surface types and their associated Gaussian curvature and mean curvature values.
Table 1.
The eight local surface types.
| K > 0 | K = 0 | K < 0 | |
|---|---|---|---|
| H > 0 | peak | ridge | saddle ridge |
| H = 0 | none | flat | minimal surface |
| H < 0 | pit | valley | saddle valley |
For a triangle mesh, the Gaussian curvature for a vertex is often estimated by the angle defect and the neighborhood area around that vertex [23]. The discrete estimates of the Gaussian curvature is formulated as follows
| (55) |
where Ki is the estimated Gaussian curvature at vertex i, and Ni is a neighborhood of vertex i, represented by the set that contains all the triangles incident to vertex i, including their vertices and edges. Here θj is the angle at vertex i within triangle tj, and Ai is the neighborhood area around the vertex, evaluated as one third of the area of Ni.
The average mean curvature for the neighborhood around a vertex is estimated from the mean curvature normal, which is the product of H and n. It can be estimated by using the Laplace-Beltrami operator applied to the surface description [23], which is essentially an estimate of the trace of the Hessian of the local description of the surface as the distance field from the tangent plane. Intuitively speaking, the mean curvature normal is equal to the gradient of area, which represents the per unit area change around a surface point when a small perturbation is added onto the location of the point,
| (56) |
where A is the small area around the point on surface.
For triangle mesh representation, the mean curvature normal can be evaluated for each vertex on the mesh. Figure 4 is an example showing how to compute the mean curvature normal on a triangle mesh. The left chart is a triangle with the top vertex v and height h. The fastest way to change the triangle area fixing the bottom two vertices is by changing v along vector h direction. This is the gradient of the triangle area with respect to the change of vertex v. Under the same argument for the subset of the triangle mesh in the right chart, each triangle around a vertex v has its fastest direction to change the area. The weighted sum of these vectors, which is the mean curvature normal integrated in the neighborhood, is the fastest way to change the total area around vertex v. The right part of the figure shows the red mean curvature normal computed around a vertex with five neighbor triangles.
Figure 4.
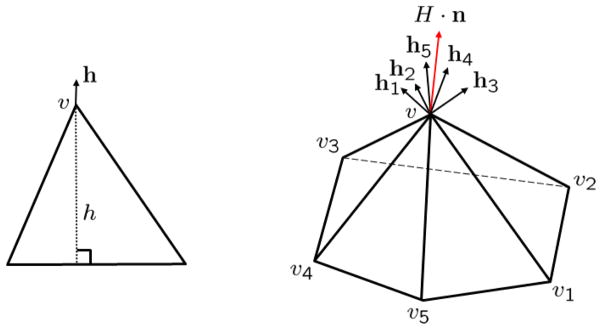
Mean curvature normal as rate of area change.
The discretized mean curvature (Hi) value at vertex i can be computed using the cotangent formula [23]:
| (57) |
where Hini is the mean curvature normal, and the normalized version of the right hand side, ni, is one commonly used estimate for the unit surface normal at vertex i. Here Ai is the area controlled by the vertex i and Ni is the set of neighboring vertices of vertex i. Moreover, vi and vj are the coordinates of vertex i and j, and αij and βij are the opposite angles of the same edge in the two triangles incident to the edge. The angles used in the cotangent formula is illustrated in Figure 5.
Figure 5.
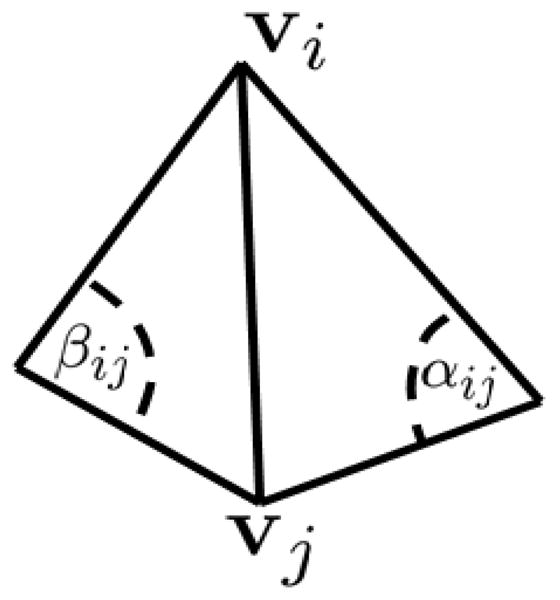
Angles used in the cotangent formula for mean curvature estimation.
4 Numerical experiments
In this section, we demonstrate geometric modeling of biomolecules using our multiscale, multiresolution models. We create volumetric data from our theoretical models and multiresolution biomolecular surfaces are extracted. Surface meshes and volumetric meshes are constructed for these biomolecules. With this structural information, the geometric features, such as Gaussian curvature, mean curvature, minimum and maximum curvatures, and shape index are evaluated. The electrostatic potential distribution is also obtained from our models. The combination of electrostatics, curvature and multiresolution offers a powerful tool for analyzing protein-protein interaction and protein-ligand binding. We also use the toonshading technique for the visualization and analysis. Six proteins from the PDB, namely 1HEW, 1ADS, 1BYH, 1EJN, 2WEB and 1MAG data, are used in our numerical experiments.
4.1 Multiscale multiresolution surfaces
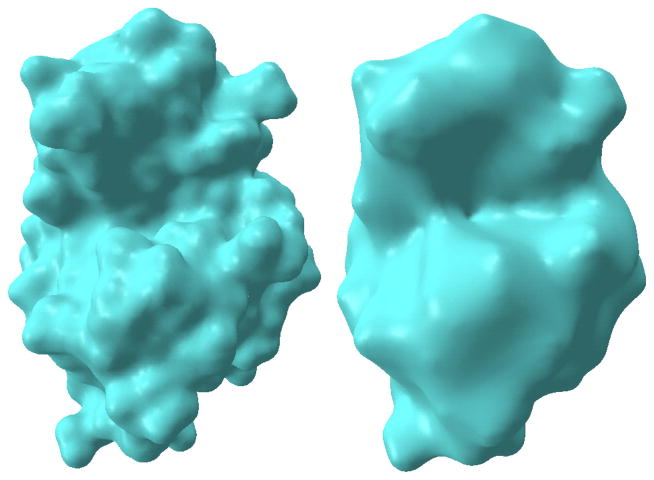
In multiscale multiresolution model, we adjust the initial conditions by choosing different η. In our test, we choose η as 1.3 and 2.0 to deliver protein surfaces of different resolutions. Figure 6 shows the results of two resolutions of protein 1HEW. With the small parameter, a surface with much atomic detail is generated. In contrast, when η = 2.0, the surface is much “thicker” with less atomic detail but with more salient global features. Note that the fine resolution surface can also be generated with a longer integraion time, while the coarse resolution surface can be extracted at an earlier time of integration.
Figure 6.
Multiresolution surfaces for protein 1HEW. The left chart is a protein surface with finer atomic details. The right chart is a “coarser” surface.
Different applications of biomolecular surfaces necessitate multiple resolutions of representation. For example, in ion channels, the radius of the pore is relatively small within the scale of few angstroms. The structure at atomic level contributes to the selectivity of the ion channel. A surface with more atomic detail is preferred. On the other hand, for protein-ligand binding and protein-protein interaction, it is not the detailed atomic shape that matters. Instead, properties like concave or convex regions are more important. Especially, in drug design, the drug molecule binds to the protein just as a key to its lock. Detection and analyses of the concave surface area of a protein provides a way to screen the potential candidate drugs.
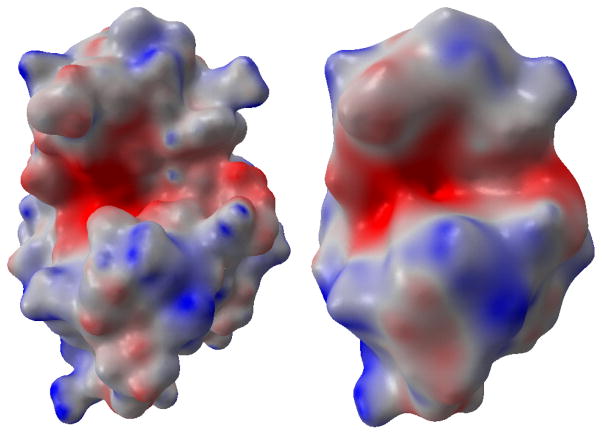
Except for the surface generation, the coupled system of LB-PB or LB-PNP also delivers information of electrostatic potential distribution. The results are rendered on the surfaces of proteins as shown in Figure 7.
Figure 7.
The electrostatic distributions on multiresolution surfaces for the protein 1HEW. The left chart is on a protein surface with finer atomic details.
4.2 Surface mesh generation
In our multiscale multiresolution model, the structural information of a protein is stored in volumetric data, and the surface of a protein can be extracted with a certain isovalue. Basically, we use two methods for surface generation from the volumetric data. One is the marching cubes method. The other is the Delaunay-refinement-based method.
In the marching cubes method, we visit each cell once to extract the connectivity information of triangle meshes within the cell. A pre-computed lookup table is used and the algorithm is of linear complexity in terms of the grid size. In our tests, even for Cartesian grid with dimensions up to 200*200*200, it takes only up to a few seconds to generate the surface mesh on a regular PC. However, the marching cubes algorithm generally suffers from an excessive number of skinny triangles, which cannot be avoided due to the lack of element quality control. Many triangles have acute angles less than 30°. The overall shapes contain terracing artifacts, which are unnecessary for the preservation of the object shape. Figure 9 illustrates the mesh for protein 1HEW generated by the marching cubes algorithm.
Figure 9.
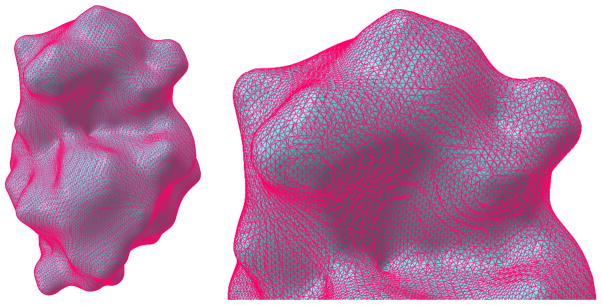
Meshes generated from the marching cubes method for protein 1HEW. The left is the entire surface mesh structure. The right is a close-up for the upper region showing the detailed mesh structure.
The Delaunay-based algorithm is available from the Computational Geometry Algorithms Library (CGAL) [21]. This method provides adjustable Delaunay triangulation parameters for angular bound, radius bound and distance bound. Angular bound is for the minimum angle of mesh triangles. Radius bound is for the radius of the maximum surface Delaunay ball, which circumscribes a mesh triangle and is centered on the surface. Distance bound is for the maximum distance between the circumcenter of a surface triangle and the center of the surface Delaunay ball. The mesh quality and the computational time are directly associated with these parameters. In our tests, we set the angular bound to 30, the radius bound to 0.8 and the distance bound to 0.8 to extract the surface mesh. It also takes a few seconds to extract the surface with relatively good mesh qualities. An example is given in Figure 10.
Figure 10.
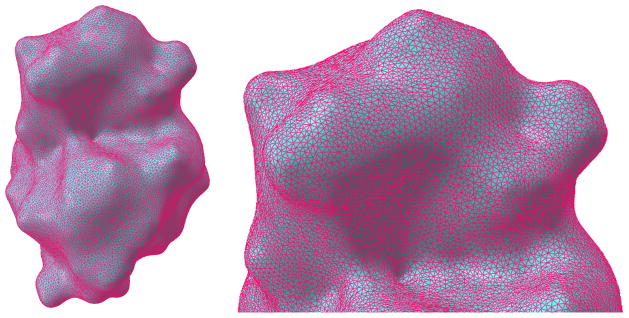
Mesh generated from Delaunay-based algorithm for protein 1HEW. The left chart is surface mesh structure. The right chart is the detailed mesh structure from the enlarged upper surface region.
To quantitatively compare the performance of the above two methods, the angle distribution of the generated mesh is considered. Figure 11 presents the angle histogram calculated from the two meshes in Figs. 9 and 10. It can been seen that the marching cubes method produces many sharp angles, while Delaunay-based algorithm delivers a surface mesh with guaranteed lower bound of 30° for angles. We also count numbers of vertices and triangles for the two meshes. In Figure 9, 45,208 vertices and 90,412 triangles are used. In contrast, the Delaunay-based method result has only 32,755 vertices and 65,506 triangles at a similar accuracy.
Figure 11.

Comparison of the meshed quality for Marching cubes method and Delaunay-based algorithm, the horizontal axis represents angle degree, the vertical axis represents ratio percentage of the vertices number. The left chart is the angle distribution from Marching cubes method. The right chart is the angle distribution from Delaunay-based algorithm.
In the CGAL library [21], remeshing algorithm is also available for improving the mesh quality. Figure 12 demonstrates the remeshed surface triangles based on the marching cube results. From the angle distribution, it is seen that the mesh quality is improved. The numbers for vertices and triangles are reduced to 31,603 and 63,202 respectively. This kind of high quality mesh is necessitated to guarantee the computational accuracy if the finite element methods are to be applied.
Figure 12.
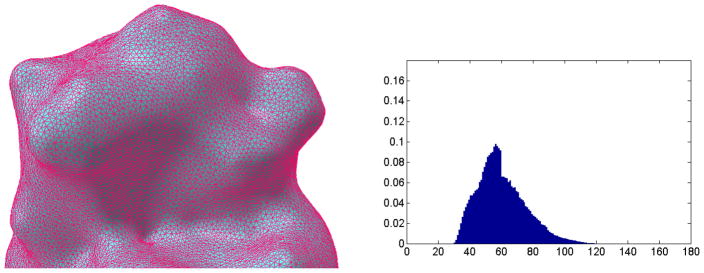
Remeshing results for protein 1HEW based on the structure from Marching cubes method. The left chart is the surface structure after remeshing algorithm. The right is the angle distribution. The horizontal axis represents angle degree, the vertical axis represents ratio percentage.
The two popular libraries, CGAL and TetGen [70], provide algorithms for volumetric meshing based on the generated triangle surface meshes. The algorithm in the CGAL library is implemented through constrained Delaunay triangulation on sampling points. The library employs a restricted Delaunay triangulation process to generate edges and facets. The mesh is continuously refined until there is no cell with facets violating the pre-defined criteria.
The constrained Delaunay triangulation algorithm in the CGAL library is controlled by five parameters, namely angular bound, triangle size bound, triangle distance bound, the surface Delaunay ball center, cell radius edge ratio bound and cell size bound, which can be tuned to achieve desirable meshing quality. The angular bound is for the minimum angle of the surface mesh triangle. The maximum surface Delaunay ball radius is for controlling triangle size bound. The triangle distance bound restricts the maximum distance between triangles’ circumcenters. The cell radius edge ratio bound is for the maximum ratio of the circumradius of a cell to its shortest edge. The maximum cell circumradius is adjusted by cell size bound. These parameters control the mesh quality and determine the computational cost. In our tests, we set the five parameters as 30, 1.8, 1.8, 2, and 1.4 respectively. The right cutaway view in Figure 13 demonstrates the cross section mesh structure generated by constrained Delaunay triangulation algorithm for protein 1HEW.
Figure 13.
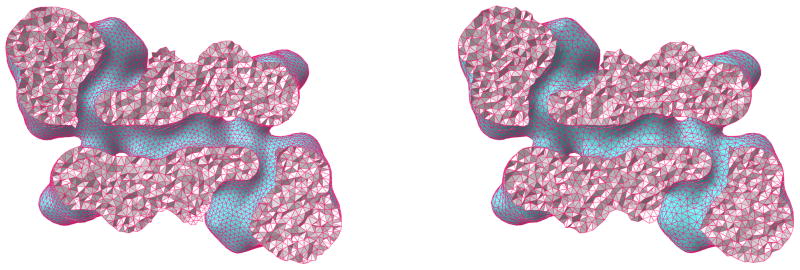
Volumetric meshing results on 1MAG. Left: Generated by TetGen; Right: Generated by CGAL.
The tetrahedralization algorithm provided by the TetGen library also has tunable parameters to control the mesh quality. These parameters include the maximum volume bound on tetrahedra and the cell radius edge ratio bound. We set them as 1 and 1.4 in the test of protein 1HEW. The cross section mesh structure generated by the TetGen library is illustrated in the left image of Figure 13.
4.4 Curvature characterization
Curvatures describe the geometric features of a protein surface. Surface features can be usually characterized by the Gaussian curvature, mean curvature, maximum and minimum curvatures. The Gaussian curvature measures the intrinsic metric properties of a surface and can be used to distinguish the peak and pit region from the saddle ridge and saddle valley region. In contrast, mean curvature describes the extrinsic properties of a surface. Positive mean curvature is found in regions like peaks, ridges and noisy dots. For the pits and valleys area, the mean curvature assumes negative values. The maximum and minimum curvatures are of fundamental importance. They can be combined with each other to form different surface indices, which provide information about the geometric features. The Gaussian curvature and mean curvature are the product and average of the two parameters, respectively. Another set of shape descriptors, the shape index and curvedness, are also functions of the maximum and minimum curvatures.
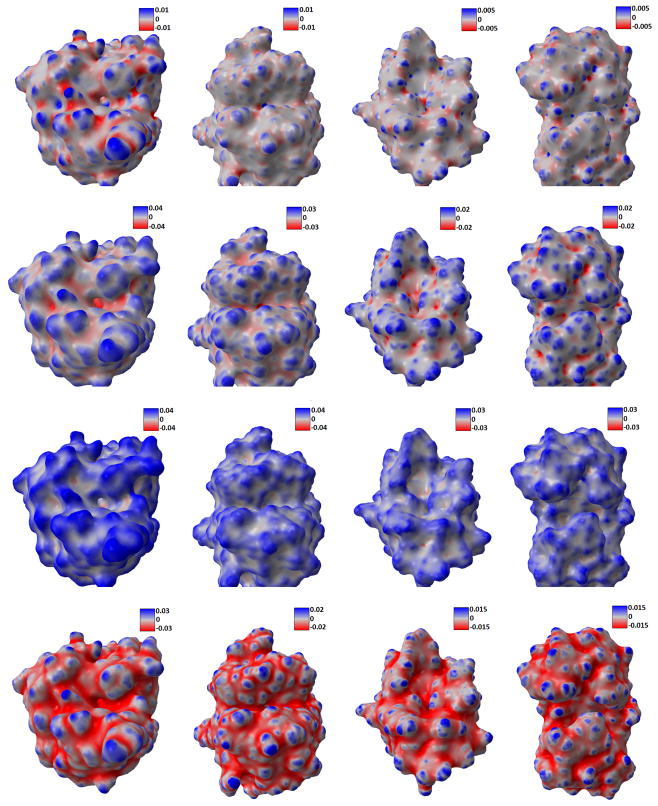
In Figure 14, we present the calculated estimates for Gaussian curvature, mean curvature, maximum and minimum curvature for four protein data. It can be seen that, these parameters capture the geometric features very well. For instance, the Gaussian curvature estimates with large positive value indicate the tips and pits areas very well. Here we make use of our potential driven molecular surface, which is free from geometric singularities. But even this kind of surface may still contain too much atomic detail. Global features such as the concave area with biological application in protein-ligand binding, cannot be derived straightforwardly from it. Therefore, the multiscale multiresolution model is employed. Using protein 1HEW as an example, we compare the surface generated from different initial conditions. In Figure 15, the smaller parameter (η = 1.3) is used, thus revealing more atomic structures. When we use larger parameter (η = 2.0), the resulting protein surface highlights global features, as shown in Figure 16. It is seen that the latter choice of parameter removes a lot of the surface fluctuations and produces much smoother curvature values. Thus, the global structures of the protein emerge as salient features.
Figure 14.
Curvature estimation results. Rows from top to bottom: Gaussian curvature, mean curvature, maximum curvature, and minimum curvature. Columns from left to right: 1ADS, 1BYH, 1EJN, and 2WEB.
Figure 15.
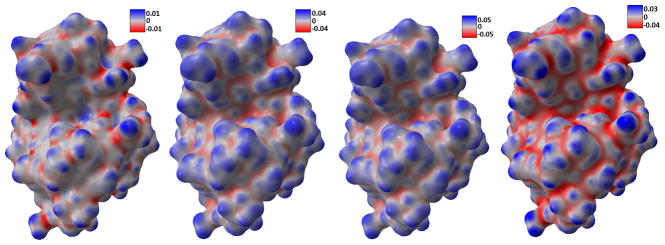
Curvature distributions on 1HEW surface with more atomic details. From left to right, Gaussian curvature, mean curvature, maximum curvature, and minimum curvature.
Figure 16.
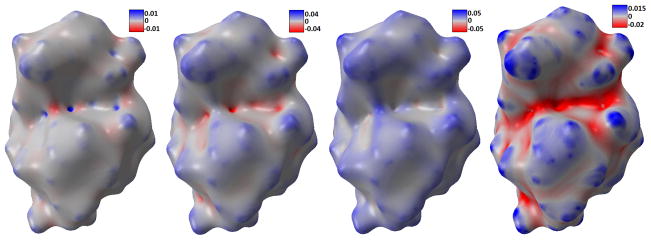
Curvature distributions on 1HEW surface with fewer atomic details. From left to right, Gaussian curvature, mean curvature, maximum curvature, and minimum curvature.
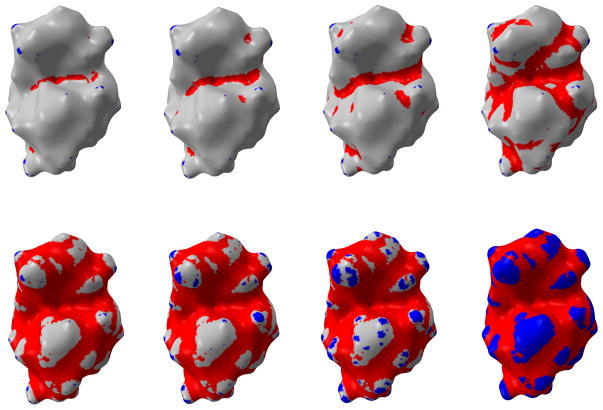
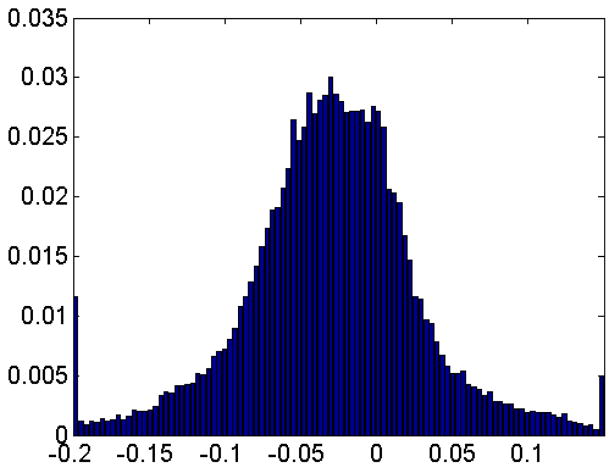
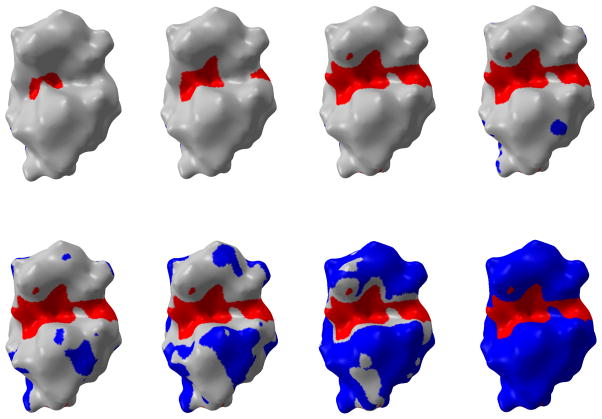
With the consideration that the minimum curvature can be a potential candidate for the indication of concave area, the toon-shading technique, i.e. shading with fewer colors, is used on the protein surface with more visible global features. We set two thresholds κ2min and κ2max with κ2 representing the minimum curvature. If a vertex’s κ2 value is smaller than κ2min, the vertex is rendered as red. When the vertex’s κ2 value is larger than κ2max, the blue color is assigned to it. All the vertices with a κ2 value between κ2min and κ2max assume a grey color. In this way, one can easily tune these two parameters to set proper thresholds to distinguish the valley from other regions on surface. By changing κ2min and κ2max values, we can create a series of pictures by moving one parameter towards zero gradually while keeping the other parameter unchanged. After setting one parameter to zero, we keep it unchanged and move the other parameter towards zero. Through this process, we can observe how the areas below threshold (κ2min or above threshold κ2max) expands. The results are demonstrated in Figure 17. Another advantage of using the toonshading technique is that we can quantify the change of the interested area when we adjust the threshold values. This is demonstrated in Table 2. The distribution of κ2 values is demonstrated in Figure 18. Overall, the minimum curvature is distributed around 0.03.
Figure 17.
The toon-shading of minimum curvature on protein 1HEW.
Table 2.
Area distributions with the change of the two minimum curvature thresholds in Figure 17.
| (κ2min, κ2max) | (−0.2,0.15) | (−0.15,0.15) | (−0.1,0.15) | (−0.05,0.15) | (0,0.15) | (0,0.1) | (0,0.05) | (0,0) |
|---|---|---|---|---|---|---|---|---|
| (−∞, κ2min) | 29.2 | 101.8 | 364.2 | 1373.1 | 3267.7 | 3267.7 | 3267.7 | 3267.7 |
| [κ2min, κ2max] | 4822.0 | 4749.4 | 4487.1 | 3478.1 | 1583.5 | 1529.2 | 1357.5 | 0 |
| [κ2max, +∞] | 6.7 | 6.7 | 6.7 | 6.7 | 6.7 | 61.1 | 232.8 | 1590.2 |
Figure 18.
The histogram of the minimum curvature on protein 1HEW.
4.5 Electrostatic analysis
The electrostatic information can be obtained from the coupled systems of LB-PB or LB-PNP. In these models, the calculated electrostatic distribution is stored in the volumetric format. That is, the data is on the Cartesian grid with each node associated with an electrostatic value. For each vertex on the protein surface mesh, the tri-linear interpolation is used on the surrounding eight grid points to evaluate the electrostatic value. The results on four proteins, namely 1ADS, 1BYH, 1EJN and 2WEB, are demonstrated in Figure 19.
Figure 19.

Electrostatic potential maps. Left to right: 1ADS, 1BYH, 1EJN, and 2WEB.
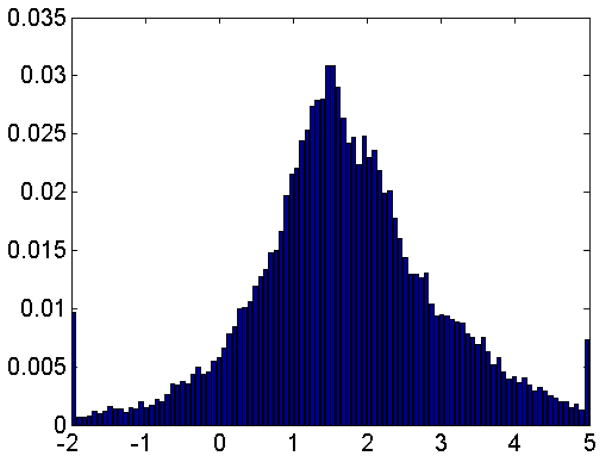
The toonshading method again is used to identify the regions with positive, negative or neutral electrostatic potential values. The protein 1HEW is used here and the basic results is demonstrated in Figure 20 and Table 3. We also analyze the distribution of the electrostatic potential and present the results in the histogram Figure 21. Clearly, the overall surface of protein 1HEW is positively charged.
Figure 20.
The electrostatic potential distribution of protein 1HEW.
Table 3.
The toonshading results regarding the electrostatic potential distribution of protein 1HEW.
| (Φmin, Φmax) | (−2, 5) | (−1,5) | (0,5) | (0,4) | (0,3) | (0,2) | (0,1) | (0,0) |
|---|---|---|---|---|---|---|---|---|
| (−∞, Φmin) | 37.2 | 107.10539 | 318.3 | 318.3 | 318.3 | 318.3 | 318.3 | 318.3 |
| [Φmin, Φmax] | 4803.1 | 4733.2 | 4522.0 | 4397.0 | 3942.5 | 2861.2 | 1034.6 | 0 |
| (Φmax, +∞) | 17.7 | 17.7 | 17.7 | 142.7 | 597.1 | 1678.4 | 3505.0 | 4616.1 |
Figure 21.
Histogram of electrostatic potential distribution on protein 1HEW.
5 Conclusion
Molecular geometric modeling is fundamental for the conceptual understanding of biomolecular structures and interactions. Molecular boundary or molecule shape is a crucial component in molecular geometric modeling. The traditional molecular surface definitions are ad hoc in origin and admit geometric singularities, which lead to computational difficulties in molecular dynamics, energy estimations and curvature calculations. Additionally, traditional geometric models are usually detached from physical modeling, which leads to extra parameterizations for the entire theoretical model. The present work presents a variational multiscale strategy for the unified geometric and physical modeling of aqueous biomolecular systems. We first discuss a variational model for the surface tension effect of a biomolecule in solvent. The Euler-Lagrange variation of the surface energy functional gives rise to the Laplace-Beltrami equation which determines the minimal molecular surface (MMS) of a biomolecule in solvent. Additionally, we take into consideration of cavitation and solvent-solute interactions to obtain a nonpolar solvation model. The addition of electrostatic energy in the energy functional gives us a full solvation model. At a non-equilibrium setting, we further employ Fick’s laws to define a concentration flux and characterize flow motion. We use geometric measure theory to embed a two-dimensional (2D) surface in the 3D Euclidean space via a hypersurface function, which separate the microscopic region of the biomolecule from the macroscopic domain of the solvent. In all of our models, the generalized Laplace-Beltrami equation comes up with the geometric definition of the biomolecular surfaces. The Laplace-Beltrami equation is complemented by the generalized Poisson-Boltzmann and Nernst-Planck equations to describe respectively the electrostatic potential and solvent density in aqueous environment.
From the hypersurface function and its governing generalized Laplace-Beltrami equation, we introduce three approaches for multiresolution analysis of biomolecular surfaces. The first method is to generate multiresolution surfaces via appropriate initial conditions of the hypersurface function. The second approach is to create multiresolution analysis from different evolution durations of the generalized Laplace-Beltrami equation. Finally, proper selections of the isovalues in the isosurface extraction also lead to desirable surface resolutions. In general, fine resolution surfaces are suitable for the local analysis of solvent-solute interactions and ion channel gating, where the detail atomic features matters. In contrast, coarse-scale surfaces are appropriate for the characterization of global features, such as concave regions and convex regions, which are related to protein-DNA specification, protein-ligand binding and protein-protein interaction.
Based on the new multiresolution surface representations, two commonly used surface extraction methods, the marching cubes algorithm and the Delaunay based method in CGAL are discuss. The marching cubes method is relatively straightforward and fast. But its result meshes suffer from skinny triangles. The Delaunay based method incorporates adjustable parameters to control the mesh quality and the resulting high quality meshes are suitable for finite element modeling and curvature characterization. Alternatively, CGAL’s remeshing functions can be used to improve the mesh quality of surfaces generated from the marching cubes algorithm. Once the surface mesh is obtained, volume mesh generation techniques are employed. The volume mesh structures provide the necessary information for finite element or finite volume analysis. In this work, a constrained Delaunay triangulation algorithm is implemented.
In protein-protein and protein ligand interactions, geometric features and electrostatic potential distributions play important roles. Especially in rational drug design, the drug binds to the regions of the protein with complementary electrostatic potential and matching (concave) curvatures. We compute electrostatic potentials associated with multiresolution surfaces. The resulting electrostatic maps are displayed in both continuous scales and discrete levels labeled with different pseudo-colors.
We carry out curvature characterization of various surface features, such as peak, pit, ridge, flat valley, saddle ridge, minimal surface, and saddle valley. These features are associated with appropriate signs of Gaussian curvature and mean curvature. We also develop minimum principle curvature descriptor and maximum principle curvature descriptor for identifying concave and convex regions, respectively. The utility of these curvature methods is amplified when they are performed hand-in-hand with our multiresolution surface representations. The further combination of curvature characterization, electrostatic map and multiresolution representation gives rise to a potential approach for the analysis on solvation, protein-ligand binding and protein-protein interaction.
Figure 8.

Mesh generation results. Left to right:1ADS, 1BYH, 1EJN, 2WEB.
Table 4.
The areas with both κ2 and pbe parameter ranges for 1HEW model.
| (Φmin, Φmax) | (−∞, −1) | [−1, 2] | (2, +∞) |
|---|---|---|---|
| (−∞, −0.1) | 37.3 | 172.9 | 86.9 |
| [−0.1, 0.1] | 72.3 | 2887.8 | 1554.7 |
| (0.1, +∞) | 0 | 21.6 | 24.4 |
Acknowledgments
This work was supported in part by NSF grants CCF-0936830, IIS-0953096 and DMS-1160352 and NIH grant R01GM-090208.
References
- 1.Baker NA. Improving implicit solvent simulations: a Poisson-centric view. Current Opinion in Structural Biology. 2005;15(2):137–43. doi: 10.1016/j.sbi.2005.02.001. [DOI] [PubMed] [Google Scholar]
- 2.Bates PW, Chen Z, Sun YH, Wei GW, Zhao S. Geometric and potential driving formation and evolution of biomolecular surfaces. J Math Biol. 2009;59:193–231. doi: 10.1007/s00285-008-0226-7. [DOI] [PubMed] [Google Scholar]
- 3.Bates PW, Wei GW, Zhao S. The minimal molecular surface. 2006 doi: 10.1002/jcc.20796. arXiv:q-bio/0610038v1, [q-bio.BM] [DOI] [PubMed] [Google Scholar]
- 4.Bates PW, Wei GW, Zhao S. Minimal molecular surfaces and their applications. Journal of Computational Chemistry. 2008;29(3):380–91. doi: 10.1002/jcc.20796. [DOI] [PubMed] [Google Scholar]
- 5.Bazant MZ, Storey BD, Kornyshev AA. Double layer in ionic liquids: Overscreening versus crowding. Physical Review Letters. 2011;106:046102. doi: 10.1103/PhysRevLett.106.046102. [DOI] [PubMed] [Google Scholar]
- 6.Bergstrom C, Strafford M, Lazorova L, Avdeef A, Luthman K, Artursson P. Absorption classification of oral drugs based on molecular surface properties. J Medicinal Chem. 2003;46:558–570. doi: 10.1021/jm020986i. [DOI] [PubMed] [Google Scholar]
- 7.Boissonnat JD, Oudot S. Provably good sampling and meshing of surfaces. Graph Models. 2005 Sep;67(5):405–451. [Google Scholar]
- 8.Chan SL, Purisima EO. Molecular surface generation using marching tetrahedra. J Computat Chem. 1998;11:1268–1277. [Google Scholar]
- 9.Chen D, Chen Z, Chen C, Geng WH, Wei GW. MIBPB: A software package for electrostatic analysis. J Comput Chem. 2011;32:657– 670. doi: 10.1002/jcc.21646. [DOI] [PMC free article] [PubMed] [Google Scholar]
- 10.Chen M, Lu B. Tmsmesh: A robust method for molecular surface mesh generation using a trace technique. J Chem Theory and Comput. 2011;7:203–212. doi: 10.1021/ct100376g. [DOI] [PubMed] [Google Scholar]
- 11.Chen M, Tu B, Lu B. Triangulated manifold meshing method preserving molecular surface topology. J Mole Graph Model. 2012;38:411–418. doi: 10.1016/j.jmgm.2012.09.006. [DOI] [PubMed] [Google Scholar]
- 12.Chen W, Zheng J, Cai Y. Kernel modeling for molecular surfaces using a uniform solution. Computer Aided Design. 2010;42:267–278. [Google Scholar]
- 13.Chen Z, Baker NA, Wei GW. Differential geometry based solvation models I: Eulerian formulation. J Comput Phys. 2010;229:8231–8258. doi: 10.1016/j.jcp.2010.06.036. [DOI] [PMC free article] [PubMed] [Google Scholar]
- 14.Chen Z, Baker NA, Wei GW. Differential geometry based solvation models II: Lagrangian formulation. J Math Biol. 2011;63:1139– 1200. doi: 10.1007/s00285-011-0402-z. [DOI] [PMC free article] [PubMed] [Google Scholar]
- 15.Chen Z, Wei GW. Differential geometry based solvation models III: Quantum formulation. J Chem Phys. 135(194108):2011. doi: 10.1063/1.3660212. [DOI] [PMC free article] [PubMed] [Google Scholar]
- 16.Chen Z, Zhao S, Chun J, Thomas DG, Baker NA, Bates PB, Wei GW. Variational approach for nonpolar solvation analysis. Journal of Chemical Physics. 2012;137(084101) doi: 10.1063/1.4745084. [DOI] [PMC free article] [PubMed] [Google Scholar]
- 17.Cipriano G, Phillips GN, Jr, Gleicher M. Multi-scale surface descriptors. IEEE Transactions on Visualization and Computer Graphics. 2009;15:1201–1208. doi: 10.1109/TVCG.2009.168. [DOI] [PMC free article] [PubMed] [Google Scholar]
- 18.Connolly ML. Depth buffer algorithms for molecular modeling. J Mol Graphics. 1985;3:19–24. [Google Scholar]
- 19.Corey RB, Pauling L. Molecular models of amino acids, peptides and proteins. Rev Sci Instr. 1953;24:621–627. [Google Scholar]
- 20.Crowley P, Golovin A. Cation-pi interactions in protein-protein interfaces. Proteins - Struct Func Bioinf. 2005;59:231–239. doi: 10.1002/prot.20417. [DOI] [PubMed] [Google Scholar]
- 21.Damiand G. Combinatorial maps. CGAL User and Reference Manual. CGAL Editorial Board, 4.0 edition, 2012. www.cgal.org/Manual/4.0/doc_html/cgal_manual/packages.html#Pkg:CombinatorialMaps.
- 22.Decherchi S, Colmenares J, Catalano CE, Spagnuolo M, Alexov E, Rocchia W. Between algorithm and model: Different molecular surface definitions for the Poisson-Boltzmann based electrostatic characterization of biomolecules in solution. Communications in Computational Physics. 2002;13:61–89. doi: 10.4208/cicp.050711.111111s. [DOI] [PMC free article] [PubMed] [Google Scholar]
- 23.Desbrun M, Meyer M, Schröder P, Barr A. Implicit fairing of irregular meshes using diffusion and curvature flow. ACM SIGGRAPH. 1999:317–324. [Google Scholar]
- 24.d’Otreppe V, Boman R, Ponthot J-P. Generating smooth surface meshes from multi-region medical images. International Journal for Numerical Methods in Biomedical Engineering. 2012;28:642–660. doi: 10.1002/cnm.1471. [DOI] [PubMed] [Google Scholar]
- 25.Dragan A, Read C, Makeyeva E, Milgotina E, Churchill M, Crane-Robinson C, Privalov P. Dna binding and bending by hmg boxes: Energetic determinants of specificity. J Mol Biol. 2004;343:371–393. doi: 10.1016/j.jmb.2004.08.035. [DOI] [PubMed] [Google Scholar]
- 26.Du Q, Faber V, Gunzburger M. Centroidal voronoi tessellations: Applications and algorithms. SIAM Review. 1999;41(4):637–676. [Google Scholar]
- 27.Dzubiella J, Swanson JMJ, McCammon JA. Coupling nonpolar and polar solvation free energies in implicit solvent models. Journal of Chemical Physics. 2006;124:084905. doi: 10.1063/1.2171192. [DOI] [PubMed] [Google Scholar]
- 28.Eisenhaber F, Argos P. Improved strategy in analytic surface calculation for molecular systems: Handling of singularities and computational efficiency. J Comput Chem. 1993;14:1272–1280. [Google Scholar]
- 29.Federer H. Curvature Measures. Trans Amer Math Soc. 1959;93:418–491. [Google Scholar]
- 30.Feng X, Wang Y, Weng Y, Tong Y. Compact combinatorial maps: A volume mesh data structure. Graphical Models, (online) 2012:1–18. [Google Scholar]
- 31.Feng X, Xia K, Tong Y, Wei GW. Geometric modeling of subcellular structures, organelles and large multiprotein complexes. International Journal for Numerical Methods in Biomedical Engineering. 2012;28:1198–1223. doi: 10.1002/cnm.2532. [DOI] [PMC free article] [PubMed] [Google Scholar]
- 32.Fogolari F, Briggs JM. On the variational approach to Poisson-Boltzmann free energies. Chemical Physics Letters. 1997;281:135–139. [Google Scholar]
- 33.Gallicchio E, Kubo MM, Levy RM. Enthalpy-entropy and cavity decomposition of alkane hydration free energies: Numerical results and implications for theories of hydrophobic solvation. Journal of Physical Chemistry B. 2000;104(26):6271–85. [Google Scholar]
- 34.Gallicchio E, Levy RM. AGBNP: An analytic implicit solvent model suitable for molecular dynamics simulations and high-resolution modeling. Journal of Computational Chemistry. 2004;25(4):479–499. doi: 10.1002/jcc.10400. [DOI] [PubMed] [Google Scholar]
- 35.Gallicchio E, Zhang LY, Levy RM. The SGB/NP hydration free energy model based on the surface generalized Born solvent reaction field and novel nonpolar hydration free energy estimators. Journal of Computational Chemistry. 2002;23(5):517–29. doi: 10.1002/jcc.10045. [DOI] [PubMed] [Google Scholar]
- 36.Geng W, Wei GW. Multiscale molecular dynamics using the matched interface and boundary method. J Comput Phys. 2011;230(2):435–457. doi: 10.1016/j.jcp.2010.09.031. [DOI] [PMC free article] [PubMed] [Google Scholar]
- 37.George PL, Hecht F, Saltel E. Automatic mesh generator with specified boundary. Computer Methods in Applied Mechanics and Engineering. 1991;92:269– 288. [Google Scholar]
- 38.Giard J, Macq B. Molecular surface mesh generation by filtering electron density map. International Journal of Biomedical Imaging. 2010;(923780):9. doi: 10.1155/2010/923780. [DOI] [PMC free article] [PubMed] [Google Scholar]
- 39.Gillespie D, Nonner W, Eisenberg R. Density functional theory of charged, hard-sphere fluids. Phys Rev E. 2003;68:031503. doi: 10.1103/PhysRevE.68.031503. [DOI] [PubMed] [Google Scholar]
- 40.Gilson MK, Davis ME, Luty BA, McCammon JA. Computation of electrostatic forces on solvated molecules using the Poisson-Boltzmann equation. Journal of Physical Chemistry. 1993;97(14):3591–3600. [Google Scholar]
- 41.Gogonea V, Osawa E. Implementation of solvent effect in molecular mechanics. 1. model development and analytical algorithm for the solvent-accessible surface area. Supramol Chem. 1994;3:303–317. [Google Scholar]
- 42.Gong LD, Yang ZZ. Investigation of the molecular surface area and volume: Defined and calculated by the molecular face theory. Journal of Computational Chemistry. 2010;31:2098–2108. doi: 10.1002/jcc.21496. [DOI] [PubMed] [Google Scholar]
- 43.Heiden W, Moeckel G, Brickmann J. A new approach to analysis and display of local lipophilicity/hydrophilicity mapped on molecular surfaces. Journal of Computer-Aided Molecular Design. 1993;7:503–514. doi: 10.1007/BF00124359. [DOI] [PubMed] [Google Scholar]
- 44.Jackson R, Sternberg M. Dna binding and bending by hmg boxes: Energetic determinants of specificity. J Mol Biol. 1995;250:258–275. doi: 10.1016/j.jmb.2004.08.035. [DOI] [PubMed] [Google Scholar]
- 45.Ju LL, Du Q, Gunzburger M. Probabilistic methods for centroidal voronoi tessellations and their parallel implementations. Parallel Computing. 2002;28:1477C1500. [Google Scholar]
- 46.Ju T, Losasso F, Schaefer S, Warren J. Dual contouring of hermite data. ACM Trans Graph (SIGGRAPH) 2002 Jul;21(3):339–346. [Google Scholar]
- 47.Koenderink JJ, van Doorn AJ. Surface shape and curvature scales. Image and Vision Computing. 1992 Oct;10(8):557–564. [Google Scholar]
- 48.Koltun WL. Precision space-filling atomic models. Biopolymers. 1965;3:667–679. doi: 10.1002/bip.360030606. [DOI] [PubMed] [Google Scholar]
- 49.Kuhn L, Siani MA, Pique ME, Fisher CL, Getzoff ED, Tainer JA. The interdependence of protein surface topography and bound water molecules revealed by surface accessibility and fractal density measures. J Mol Biol. 1992;228:13–22. doi: 10.1016/0022-2836(92)90487-5. [DOI] [PubMed] [Google Scholar]
- 50.Lee B, Richards FM. The interpretation of protein structures: estimation of static accessibility. J Mol Biol. 1971;55(3):379–400. doi: 10.1016/0022-2836(71)90324-x. [DOI] [PubMed] [Google Scholar]
- 51.Levy RM, Zhang LY, Gallicchio E, Felts AK. On the nonpolar hydration free energy of proteins: surface area and continuum solvent models for the solute-solvent interaction energy. Journal of the American Chemical Society. 2003;125(31):9523–9530. doi: 10.1021/ja029833a. [DOI] [PubMed] [Google Scholar]
- 52.LiCata V, Allewell N. Functionally linked hydration changes in escherichia coli aspartate transcarbamylase and its catalytic subunit. Biochemistry. 1997;36:10161–10167. doi: 10.1021/bi970669r. [DOI] [PubMed] [Google Scholar]
- 53.Lorensen WE, Cline HE. Marching cubes: A high resolution 3d surface construction algorithm. COMPUTER GRAPHICS. 1987;21:163–169. [Google Scholar]
- 54.Manciu M, Ruckenstein E. On the chemical free energy of the electrical double layer. Langmuir. 2003;19(4):1114– 1120. [Google Scholar]
- 55.Max NL, Getzoff ED. Spherical harmonic molecular-surfaces. IEEE Computer Graphics and Applications. 1988;8:42–50. [Google Scholar]
- 56.Pan W, Wheel M. A finite-volume method for solids with a rotational degrees of freedom based on the 6-node triangle. International Journal for Numerical Methods in Biomedical Engineering. 2011;27:1411– 1426. [Google Scholar]
- 57.Perkins TDJ, Mills JEJ, Dean PM. Molecular surface-volume and property matching to superpose flexible dissimilar molecules. J Computer-Aided Molecular Design. 1998;9:479–490. doi: 10.1007/BF00124319. [DOI] [PubMed] [Google Scholar]
- 58.Petrey D, Honig B. GRASP2: Visualization, surface properties, and electrostatics of macromolecular structures and sequences. Methods in Enzymology. 2003;374:492–509. doi: 10.1016/S0076-6879(03)74021-X. [DOI] [PubMed] [Google Scholar]
- 59.Qian J, Lu J. Point-cloud method for image-based biomechanical stress analysis. International Journal for Numerical Methods in Biomedical Engineering. 2011;27:1493– 1506. [Google Scholar]
- 60.Raschke T, Tsai J, Levitt M. Quantification of the hydrophobic interaction by simulations of the aggregation of small hydrophobic solutes in water. Proc Natl Acad Sci USA. 2001;98:5965–5969. doi: 10.1073/pnas.111158498. [DOI] [PMC free article] [PubMed] [Google Scholar]
- 61.Richards FM. Areas, volumes, packing, and protein structure. Annual Review of Biophysics and Bioengineering. 1977;6(1):151–176. doi: 10.1146/annurev.bb.06.060177.001055. [DOI] [PubMed] [Google Scholar]
- 62.Rocchia W, Sridharan S, Nicholls A, Alexov E, Chiabrera A, Honig B. Rapid grid-based construction of the molecular surface and the use of induced surface charge to calculate reaction field energies: Applications to the molecular systems and geometric objects. Journal of Computational Chemistry. 2002;23:128– 137. doi: 10.1002/jcc.1161. [DOI] [PubMed] [Google Scholar]
- 63.Rubin B. Macromolecule backbone models. Methods in Enzymology. 1985;115:391–397. doi: 10.1016/0076-6879(85)15028-7. [DOI] [PubMed] [Google Scholar]
- 64.Saksono PH, Nithiarasu P, Sazonov I. Numerical prediction of heat transfer patterns in a subject-specific human upper airway. Journal of Heat Transfer. 2012;134(031022):1–9. [Google Scholar]
- 65.Salo Z, Beek M, Whyne CM. Evaluation of mesh morphing and mapping techniques in patient specific modelling of the human pelvis. International Journal for Numerical Methods in Biomedical Engineering. 2012;28:904– 913. doi: 10.1002/cnm.2468. [DOI] [PubMed] [Google Scholar]
- 66.Sanner MF, Olson AJ, Spehner JC. Reduced surface: An efficient way to compute molecular surfaces. Biopolymers. 1996;38:305–320. doi: 10.1002/(SICI)1097-0282(199603)38:3%3C305::AID-BIP4%3E3.0.CO;2-Y. [DOI] [PubMed] [Google Scholar]
- 67.Sazonov I, Nithiarasu P. Semi-automatic surface and volume mesh generation for subject-specific biomedical geometries. International Journal for Numerical Methods in Biomedical Engineering. 2012;28:133–157. doi: 10.1002/cnm.1470. [DOI] [PubMed] [Google Scholar]
- 68.Sazonov I, Yeo SY, Bevan LT, Xie XH, Loon RV, Nithiarasu P. Modelling pipeline for subject-specific arterial blood flowa review. International Journal for Numerical Methods in Biomedical Engineering. 2011;27:1868–1910. [Google Scholar]
- 69.Sharp KA, Honig B. Calculating total electrostatic energies with the nonlinear Poisson-Boltzmann equation. Journal of Physical Chemistry. 1990;94:7684–7692. [Google Scholar]
- 70.Si H. Constrained delaunay tetrahedral mesh generation and refinement. Finite Elem Anal Des. 2010 Jan;46:33–46. [Google Scholar]
- 71.Spolar RS, Record MT., Jr Coupling of local folding to site-specific binding of proteins to dna. Science. 1994;263:777–784. doi: 10.1126/science.8303294. [DOI] [PubMed] [Google Scholar]
- 72.Wan M, Wang Y, Wang DS. Variational surface reconstruction based on delaunay triangulation and graph cut. Int J Numer Meth Engng. 2011;85:206C229. [Google Scholar]
- 73.Weatherill NP, Hassan O. Efficient three-dimensional delaunay triangulation with automatic point creation and imposed boundary constraints. Int J Numer Meth Engng. 1994;37:2005–2039. [Google Scholar]
- 74.Wei GW. Differential geometry based multiscale models. Bulletin of Mathematical Biology. 2010;72:1562– 1622. doi: 10.1007/s11538-010-9511-x. [DOI] [PMC free article] [PubMed] [Google Scholar]
- 75.Wei GW, Sun YH, Zhou YC, Feig M. Molecular multiresolution surfaces. 2005:1–11. arXiv:math-ph/0511001v1. [Google Scholar]
- 76.Wei GW, Zheng Q, Chen Z, Xia K. Variational multiscale models for charge transport. SIAM Review. 2012;54(4):699–754. doi: 10.1137/110845690. [DOI] [PMC free article] [PubMed] [Google Scholar]
- 77.Wu MC, Liu CR. Analysis on machined feature recognition techniques based on b-rep. Computer-Aided Design. 1996;28:603–616. [Google Scholar]
- 78.Xia YT, Feng KLX, Wei GW. Multiscale geometric modeling of macromolecules. Journal of Computational Physics. 2013 doi: 10.1016/j.jcp.2013.09.034. [DOI] [PMC free article] [PubMed] [Google Scholar]
- 79.Yu XY, Wu JZ. Structures of hard-sphere fluids from a modified fundamental-measure theory. Journal of Chemical Physics. 2002;117:10156–10164. [Google Scholar]
- 80.Yu Z, Holst M, Hayashi T, Bajaj CL, Ellisman MH, et al. Three-dimensional geometric modeling of membrane-bound organelles in ventricular myocytes: Bridging the gap between microscopic imaging and mathematical simulation. Journal of Structural Biology. 2008;164:304–313. doi: 10.1016/j.jsb.2008.09.004. [DOI] [PMC free article] [PubMed] [Google Scholar]
- 81.Yu ZY, Holst M, Cheng Y, McCammon JA. Feature-preserving adaptive mesh generation for molecular shape modeling and simulation. Journal of Molecular Graphics and Modeling. 2008;26:1370–1380. doi: 10.1016/j.jmgm.2008.01.007. [DOI] [PubMed] [Google Scholar]
- 82.Zheng Q, Chen D, Wei GW. Second-order Poisson-Nernst-Planck solver for ion transport. Journal of Comput Phys. 2011;230:5239– 5262. doi: 10.1016/j.jcp.2011.03.020. [DOI] [PMC free article] [PubMed] [Google Scholar]
- 83.Zheng Q, Wei GW. Poisson-Boltzmann-Nernst-Planck model. Journal of Chemical Physics. 2011;134:194101. doi: 10.1063/1.3581031. [DOI] [PMC free article] [PubMed] [Google Scholar]
- 84.Zheng Q, Yang SY, Wei GW. Molecular surface generation using PDE transform. International Journal for Numerical Methods in Biomedical Engineering. 2012;28:291–316. doi: 10.1002/cnm.1469. [DOI] [PMC free article] [PubMed] [Google Scholar]


