

Abstract
Over the last two decades the zebrafish has emerged as a powerful model organism in science. The experimental accessibility, the broad range of zebrafish mutants, and the highly conserved genetic and biochemical pathways between zebrafish and mammals lifted zebrafish to become one of the most attractive vertebrate models to study gene function and to model human diseases. Zebrafish cell lines are highly attractive to investigate cell biology and zebrafish cell lines complement the experimental tools that are available already. We established a straightforward method to culture cells from a single zebrafish embryo or a single tumor. Here we describe the generation of fibroblast-like cell lines from wild-type and ptenb−/− embryos and an endothelial-like cell line from a tumor of an adult ptena+/−ptenb−/− zebrafish. This protocol can easily be adapted to establish stable cell lines from any mutant or transgenic zebrafish line and the average time to obtain a pro-stable cell line is 3–5 months.
Introduction
The zebrafish is an excellent model organism to study developmental processes and is increasingly being used to study specific cancer- and disease-related questions.1 The human and zebrafish genomes encode common genes, including cell cycle genes, oncogenes, and tumor suppressors.2 These genes are highly conserved in zebrafish and reveal the possibility to study the role of zebrafish orthologues of human proteins in diseases or developmental malformations.3–5 Comparative transcriptome analysis demonstrated striking homologies between human and zebrafish liver tumors,6 illustrating that the zebrafish is a bona fide model for human cancer.
The main advantages of zebrafish are the large numbers of offspring and the transparency of the embryo. Further, fertilization is ex uteri and allows analysis of the developing embryo at any time of interest and even continuously. Besides the general molecular biology applications in zebrafish, the cell culture system is becoming an increasingly attractive tool to study cell behavior. Further, cell lines facilitate cell biology and biochemistry approaches.
During the last decade, a lot of progress was made in culturing cells from zebrafish.7–11 Although a range of methods have been described, the protocols vary between laboratories, which have led to open questions. For example, the composition of media7,8,11,41,42 (listed in Table 1), the number of embryos used for culturing cells, and the approach in general to culture cells from an embryo varies from laboratory to laboratory.
Table 1.
Variation in Composition of Media for Zebrafish Cell Culture
| Culture medium | Reference |
|---|---|
| DMEM/Ham's F12 with carbonate or HEPES 10% FCS | 8 |
| 90% 1:1 DMEM/Ham's F12 with 10% FCS (containing 1.2 g/L sodium carbonate, 2.5 mM L-glutamine, 15 mM HEPES, and 0.5 mM sodium pyruvate), or L15 with 15% FCS | 11 |
| DMEM (high glucose, no sodium pyruvate) with 15% FBS, 1% trout serum, 50 μg protein/mL of zebrafish embryo extract, 10 μg/mL bovine insulin, 50 ng/mL bFGF, 100 U/mL penicillin–streptomycin, and 100 U/mL ampicillin | 41 |
| L15 with 20% FCS | 42 |
| LDF medium (50% L-15, 35% DMEM, and 15% Ham's F12 media) supplemented with sodium bicarbonate (0.15 mg/mL), 15 mM (HEPES) buffer (pH 7.2), penicillin (200 U/mL), streptomycin sulfate (200 μg/mL), ampicillin (25 μg/mL), bovine insulin (10 μg/mL; Sigma), trout embryo extract (25 μg/mL), trout serum (0.1%), and FBS (1%) | 7 |
DMEM, Dulbecco's modified Eagle's medium; HEPES, 4-(2-hydroxyethyl)-1-piperazine-ethanesulfonic acid; FCS, fetal calf serum; L15, Leibovitz's medium; FBS, fetal bovine serum; bFGF, basic fibroblast growth factor; LDF, L-15/DMEM/F12.
Several knockout mutants and transgenic lines develop tumors over time, including tp53−/−, ptenb−/−, ptena+/−ptenb−/−, respectively, ptena−/−ptenb+/−, mitf1A:V12RAS, tp53-BRAFV500E, and GFP-H-RASV12.12–17 These mutants have great potential for phenotypical analysis, but also show limitations. Tumors develop spontaneously and have to get a certain size before becoming apparent. Transplantable tumors are an accepted gold standard in cancer studies and provide an alternative method to study tumor progression.18 Recently, the transplantation and grafting methods have been optimized and utilized by several groups.13,18–24 Grafting of human or mouse cancer cells into fish is common and well established.19 However, since the host and donor cells are derived from different species, the cells and the embryos require different growth conditions. Hence, the availability of zebrafish cell lines would boost the applicability of zebrafish for grafting and transplantation purposes. Combined with the transparency of zebrafish embryos, this would be an important addition to the repertoire of techniques that is already available.
For tumor transplantation analysis, in most cases, the tumor is disaggregated and injected into a host. This approach is well established, but also contains a nonpredictable factor, since tumor tissue is composed of a mixture of tumor cells, blood, and stroma cells. Therefore, the host is not only stressed by cancer cells, but also by a cohort of different tumor-associated cells. An alternative approach would be to dissociate the tumors, sort individual cells, based on markers—for instance, a fluorescent marker by fluorescence-activated cell sorting—and grafting these homogenous cells.20 Deriving cell lines from a zebrafish tumor and grafting these cells into zebrafish hosts is another approach to investigate tumor biology in a more controlled and reproducible manner.
In general, fish models with an embryonic lethal mutation in genes like pten, ribosomal proteins, or b-myb show a limitation in approaches due to embryonic lethality.12,25,26 To circumvent this problem, we established a protocol to generate cell lines from single (mutant) embryos with the aim to study cell behavior and migration in vitro as well as in vivo. Until now, zebrafish cell lines were derived from pooled embryos. However, it is desirable to derive stable cell lines from single embryos. Since morphological defects in many mutants only become apparent later in development, it is crucial to derive cell lines from single embryos and subsequently determine the genotype of the cell lines.
Cells in culture are easily accessible for transfection and chemotherapeutic agents. Further, cell lines may be labeled and grafted into a host and reveal a new possibility to study tumor formation and associated events, such as angiogenesis, growth, and formation of metastases. Further, grafting cell lines into hosts with aberrant genetic backgrounds will provide a detailed insight into the molecular genetic basis of tumor formation.
The zebrafish genome encodes two pten genes, referred to as ptena and ptenb.12,27 PTEN (for phosphatase and tensin homologue from chromosome 10) was identified as a tumor suppressor after identification of chromosome 10q23 as a locus that is highly susceptible to mutation in primary cancer.28,29 Somatic deletion in various kinds of tissue leads to tumor formation and cancer.28,30,31 PTEN belongs to the protein tyrosine phosphatase superfamily and is a key player in the signaling network triggered by PI3K/Akt.32–34 Loss of PTEN leads to constitutive activation of the Akt pathway, promoting cell survival, proliferation, growth, and angiogenesis.34,35 The importance of PTEN is emphasized by studies in several organisms, including mouse, where Pten was deleted in all cells as well as using conditional knockouts in adult stages.36–40 Embryos lacking Pten die due to developmental defects and growth retardation. Homozygous ptena−/− or ptenb−/− zebrafish are viable and fertile and do not display developmental defects. Ptena−/−ptenb−/− zebrafish are embryonically lethal around 5 days postfertilization (dpf )12 and only begin to display developmental defects from 2 dpf onward.
Here we describe a straightforward protocol, using wild-type and pten mutant zebrafish for isolation and culturing of zebrafish cells from an embryo or a tumor. This protocol is applicable in every laboratory for any genetic zebrafish mutant provided the embryos survive until 1 dpf. In addition, we adapted the protocol for growing cells from a tumor in pten mutant adult fish. Our protocol to culture cells from a single zebrafish embryo or tumor contributes to the repertoire of methods that are available to understand zebrafish cell behavior.
Materials and Methods
Materials
Composition of all used solutions and media is listed in Table 2.
Table 2.
Media Composition
| Growth media | |
| L15+GlutaMax (Gibco) | 500 mL |
| FBS (Sigma-Aldrich) | 15% |
| Calcium chloride | 0.8 mM |
| Penicillin (Gibco) | 50 U/mL |
| Streptomycin (Gibco) | 0.05 mg/mL |
| Gentamycin (Gibco) | 10 mg/mL |
| Calcium-free Ringer | |
| NaCl2 | 116 mM |
| KCl | 2.9 mM |
| HEPES | 5 mM |
| Bleaching solution | |
| NaOCl in calcium free Ringer | 10%–13% |
| Phosphate-buffered saline | |
| Na2HPO4 | 10 mM |
| KH2PO4 | 1.5 mM |
| NaCl | 137 mM |
| KCl | 2.7 mM |
KCl, potassium chloride; NaOCl, sodium hypochlorite; Na2HPO4, disodium phosphate; KH2PO4, monopotassium phosphate; NaCl, sodium chloride.
Culturing cells from single embryos
The following procedure is optimized to culture embryos at 24 hours postfertilization (hpf ) and is depicted schematically in Figure 1.
FIG. 1.

Workflow how to culture cells from an embryo. Schematical overview of single steps (1–5) is shown. Embryos are collected after natural mating (steps 1 and 2). Embryos are transferred to tubes and washed, bleached, deyolked, and trypsinized. Single-cell suspensions are transferred to a 48-well plate (step 3). After several weeks of culturing and monitoring, cells are split and transferred to a six-well plate (step 4). Confluent wells are split to a 25-cm2 flask (step 5).
Obtaining embryos and dissociation into single cells
Collect embryos after natural spawning and grow them overnight in standard E3 media containing methylene blue at 28°C. Dechorionate embryos with sterile, ethanol cleaned forceps and transfer them to phosphate-buffered saline (PBS) containing 50 U/mL penicillin (Gibco) and 0.05 mg/mL streptomycin (Gibco) (PBS/PS) for at least 30 min (five embryos in a well of a six-well plate with 5 mL PBS/PS). Refresh the PBS/PS solution and transfer a single embryo to a sterile tube (embryo+500 μL PBS/PS) for 20 min. To avoid contamination with bacteria, incubate embryos in a bleaching solution (Table 2). We recommend 200 μL of the bleaching solution for 5 min. Replace the bleaching solution with PBS/PS immediately and incubate for 20 min. See Table 3 for troubleshooting. Remove the yolk sac of an embryo using a 200-μL pipettor and pipette several times up and down. Spin down 1200 g for 2 min at room temperature and discard the supernatant carefully. See Table 3 for troubleshooting. Add 300 μL of TripLE (Gibco; prewarmed to 28°C) and incubate for ∼30 min at 28°C in a thermomixer, while mixing at 800 rpm. Flick the tube several times during incubation and control status of the embryo by eye. The incubation time depends on the status of the embryo. As soon as you see disintegration of the embryo, pipette the embryo- TripLE, with a 200-μL tip, several times up and down under sterile conditions (cell culture hood), centrifuge immediately (4 min, 1200 g at room temperature), discard supernatant, and wash with 400 μL PBS. The difference in disintegration time may differ between zebrafish mutants. If you still see an embryo-like structure (Fig. 2a, arrow), do not extend the incubation in TripLE, but rather continue with the next step. In general, it is possible to culture embryos younger or older than 24 hpf. For younger embryos, we recommend to decrease the time of bleaching from 5 to 3 min and to decrease the time of trypsinization from 30 to 15–20 min. In case of older embryos, we recommend to increase all incubation steps by at least 10 min.
Table 3.
Troubleshooting
| Problem | Possible cause and solution |
|---|---|
| No cells alive after seeding | Either the concentration of the bleaching solution is too high or incubation time with TripLE is too long. Decrease concentration of the bleaching solution and incubate for 5 min followed by washing with PBS/PS. Further, decrease incubation with TripLE from 20 to 15 min. |
| If you still do not get any cells in culture, skip the washing step with PBS/PS and resuspend cell-pellet after centrifugation with growth media and seed cells. | |
| No cells after seeding | You may have lost your pellet after centrifugation and discarding the supernatant. In general, we recommend not to suck off all solution during the washing steps, instead leave a bit in the tube. |
| No cells after splitting | The incubation time could be too long. We recommend to trypsinize cells for 2 min, resuspend in growth media, and transfer to a 24-well dish. Refill the original well with growth media. Check the status of the cells (old well and new well) the next day and trypsinize the well of origin again after one week. |
| No adherence of tumor tissue | In case of no attachment of tissue to the well, cut the tumor pieces in smaller fragments and continue with culturing. If there is still no adherence of cells, transfer the fragments in a tube and spin down for 4 min 1200 g. Add TripLE to the tissue and incubate for 15–30 min and follow with spinning down, washing with PBS/PS. Spin down, remove the supernatant, and resuspend the pellet with media and continue culturing |
FIG. 2.

Cells after seeding. (a) In some cases, parts of the embryo still remain after trypsinization (arrows); some single cells are indicated by arrowheads. (b) The embryo-cell suspension contains single floating cells. (c) After ∼1 h, first attached cells are visible. (d) Enlargement of indicated box in (c), showing an attached cell. (e) After 1 day, cells start to grow out of the embryo fragment (arrow). (f ) One day after culturing small colonies of cells are noticeable. Color images available online at www.liebertpub.com/zeb
Transferring single-cell suspension to culture conditions
Resuspend cell pellets in 400 μL growth media and transfer cell suspension to a 48-well plate (Fig. 2b). We recommend a volume of 400 μL per well of a 48-well plate, 2 mL per well of a 6-well plate, 5 mL for a 25-cm2 flask, and 20 mL for a 75-cm2 flask. There is no need to coat the wells with gelatin, for example, zebrafish cells attach to the surface of a cell culture dish easily. For air exchange and sterile conditions, the plates should be closed by a parafilm and caps of flasks should not be closed completely. The optimal temperature for growing and culturing zebrafish cells is 26°C–28°C (no need for CO2 supply). After ∼1 h, the first attached cells are visible (Fig. 2c, d). Twenty-four hours after seeding, the first cohorts of cells are visible (Fig. 2e, f). If you see the first sign of contamination, like small objectives moving in the well, a smell, or unclear media replace the media immediately. Check the cells on the next day and, if necessary, change the medium again. In case of severe contamination after 6 h, wash wells several times with PBS/PS and incubate overnight in media. Proceed on the next day with washing and replacement of media.
Maintenance and passaging of zebrafish cells
In general, media of growing cells should be replaced every 6–7 days. In case the wells contain a lot of dead cells or small particles (Fig. 3a), wash cells once with PBS/PS followed by replacement of growth media. If the media get a deep pink/purple color, indicating a pH switch, we also recommend replacing the media (Fig. 3b). Cells should grow for around 3–4 weeks in the 48-well plate. After 3–4 days culturing, different types of cells are detectable (Fig. 4a) and become more distinguishable after ∼10 days (Fig. 4b–d). To obtain a single cell type, start splitting the cells after 3–4 weeks (Fig. 4e–h): wash cells once with 400 μL PBS, followed by a short incubation with 400 μL TripLE. Remove TripLE leaving about 1/20 of volume in a well and continue incubation for 3–4 min with TripLE at room temperature. Resuspend cells with 400 μL growth media and transfer cell suspension to a six-well dish containing 2 mL of growth media. Under optimal conditions, the trypsinized well still contains some cells. Add growth media to those wells even if you do not see any signs of cells and check this well again on the next day. The incubation time with TripLE depends on the status of cells. Check the cells under a microscope after 2 min. As soon as cells are seen to be detaching, resuspend the cells with growth media. See Table 3 for troubleshooting.
FIG. 3.
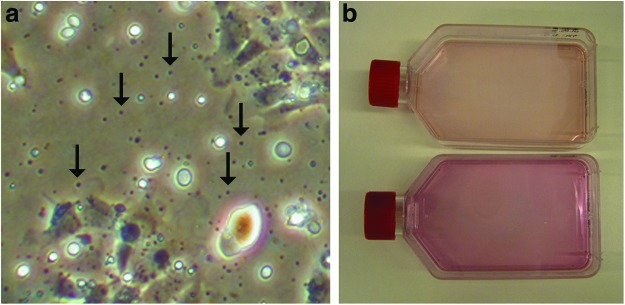
Contamination and color switch of growth media. Small moving particles are indication of a contamination (arrow in a). A freshly added growth medium to a 75-cm2 flask (b, top flask) is shown. After one week, the color switched to deep pink (b, bottom flask). Color images available online at www.liebertpub.com/zeb
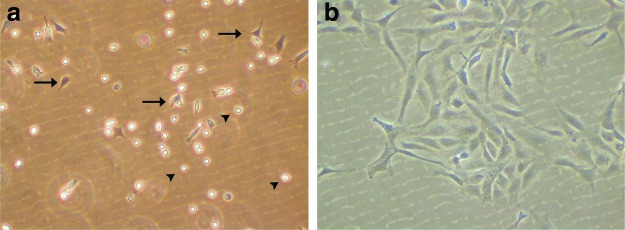
FIG. 4.

Culturing cells for about 5 weeks. (a) Four days after culturing, different cell types are detectable. (b–d) After 10 days, these cell types become more distinguishable. (e) Cells were passaged to a 6-well plate after 4 weeks of culturing in a 48-well plate and after reaching confluence, they were passaged further to 6-well plates. (f–h) After three passages in 3 weeks, single cell types are observed. Color images available online at www.liebertpub.com/zeb
Check cells after each passage on the next day. In case of contamination or a large amount of dead cells, wash cells and refresh growth media. Continue culturing cells in a six-well plate. As soon as cells are confluent, split them to another six-well plate and continue with culturing until you get a single type of cell. Once cells of a single cell type are confluent in a six-well format, start splitting (1:10) cells to a 25-cm2 flask, and then to a 75-cm2 flask.
Long-term storage of zebrafish cells
For long-term storage, trypsinize a confluent 75-cm2 flask and freeze immediately. Briefly, wash cells with PBS/PS, trypsinize, and resuspend cells in growth media (conditions mentioned above). Spin down at 1100 g for 4 min and resuspend pellets in 500 μL of growth media/freezing media (1:1, v/v). Transfer the cell solution to cryovials and store for one day at −80°C in a polystyrene box or wrap cryovial with tissue. Transfer frozen cells to liquid nitrogen for longer storage. To reculture frozen cells, thaw cells carefully in your hands; be aware that 37°C kills zebrafish cells. Mix cells with a 5 mL prewarmed medium (28°C), spin down for 4 min at 1100 g, and resuspend pellets in desired growth media and plate out (Fig. 5).
FIG. 5.
Reculturing frozen cells. (a) One h after seeding, the first cells start to attach to the plate (arrows), single cells in suspension are indicated by arrowheads. (b) Cells adhere and grow after 2 days Color images available online at www.liebertpub.com/zeb.
Culturing cells from tumor tissue
All protocols using live animals must be approved by the local animal welfare committees according to national governmental regulations and legislature. Adult ptena+/−ptenb−/− fish develop tumors that were identified as hemangiosarcomas.17
Prepare fish for tumor isolation
Incubate tumor-bearing live fish overnight in E3 media containing 50 U/mL penicillin and 0.05 mg/mL streptomycin (E3/PS). Refresh next morning the E3/PS solution and incubate fish for 2 h. Refresh E3 media with double amount of PS for at least 1 h. Euthanize the tumor-bearing zebrafish with an overdose of MS222 (Sigma-Aldrich) and iced water. The total cessation of gill movement and lack of visible heart beat through the skin indicates death of zebrafish.
Isolation of tumor cells
Position the fish for proper tumor preparation under a stereomicroscope. We recommend fixing the fish with needles, for example, on sheets of parafilm. Remove excess water on the surface of the fish and dish using tissue. Slice the tumor carefully and transfer tumor tissue to a six-well plate, incubate for 20 min in PBS with double PS. Externally growing tumors are easy to slice, whereas an internal tumor requires surgery (Fig. 6a). In both cases, avoid a contamination with healthy tissue. Fix the remaining part of the fish and/or a small piece of the tumor for histological analysis. Replace the PBS double PS solution with 2 mL growth media. Shear the tumor with either a sterile pistil or a blade. The method of choice to hackle the tumor depends on the tumor mass and tissue of origin. In case of a soft tumor, we recommend to use a pistil, if your tumor is more solid, use a blade. It is not necessary to get the tumor tissue completely in suspension. Validation of different methods in our experience leads us to the conclusion that slicing the tumor in several pieces yields best results. The pieces will attach to the surface of the plate and cells will grow out of the tissue (Fig. 6b).
FIG. 6.

Culturing cells from a tumor. (a) An external growing tumor mass (marked by box) in a ptena+/−ptenb−/− fish. Part of the tumor tissue was sliced and cut into several pieces. The rest of the tumor was fixed and embedded in paraffin. (b) After 7 days, cells have grown out of the tissue and form a cell layer surrounding the tissue. (c, d) After 3 weeks of culturing, different cell types are visible. (e) After 3–4 months, a single cell type is established (pro-cell line). (f ) After 1 year, a stable cell line is generated. (g, h) The fixed part of the tumor from panel (a), embedded in paraffin was sectioned transversally, and sections were stained with hematoxylin and eosin. (h) Enlargement of indicated box in (g), showing a hemangiosarcoma. Images were taken with 20× (g) and 40× (h), respectively. Color images available online at www.liebertpub.com/zeb
Transferring single-cell suspension to culture conditions
Cover the tumor suspension with 2 mL growth media under sterile conditions (cell culture hood). In optimal conditions, remove the tissue after 5–7 days and perform immunohistological analysis for tumor characterization. Cells from a tumor tissue need a longer time to attach to the surface of a culture plate. As mentioned above, the risk of contamination is high. Check your cells after ∼6 h and, if necessary, take action to remove the contamination. In case of minor contamination (Fig. 3), wash cells, respectively, clump of tissue several times with PBS/PS, and replace media. Note, try not to discard pieces of tumor tissue. If the contamination is more than minor (double amount of bacteria or small particle as shown in Fig. 3), wash cells with PBS/PS and discard all nonadherent cells/tissue. In case of severe contamination, wash cells several times with PBS/double PS and discard all nonadherent cell/tissue. Wash cells again the next day. Depending on the grade of contamination, treatment has to be adapted individually. Monitor cells every other day and proceed with steps described in section Maintenance and passaging zebrafish cells (above). After 3–4 weeks of culturing, certain cell types are established (Fig. 6c, d) and the well has almost grown to confluence. To get a single type of cell, passage the cells further in six-well plates (Fig. 6e, f) and follow subsequently by growing in a 25-cm2 flask, respectively, 75 cm2 flask.
Immunoblotting
Protein lysates are obtained from cell lines using the standard procedure. Briefly, cells were washed with ice-cold PBS. Add 1.5 mL of the cell lysis buffer (50 mM HEPES, [pH 7.4], 150 mM sodium chloride, 1 mM magnesium chloride, 10% glycerol, 1% Triton X-100, 1% sodium orthovanadate [Na3VO4], and protease inhibitors, including 5 mM betaglycerophosphate, 1 μg/mL aprotinin, 5 mM sodium fluoride, 1 mM Na3VO4, and 1 μg/mL leupeptin) and incubate 15–20 min on ice. Collect cells using the cell scraper, spin down (10 min at 12,000 rpm), and transfer the supernatant to a tube. Measure the protein concentration using the standard procedure, samples were mixed with the 2× Laemmli sample buffer and boiled for 5 min. Immunoblotting was performed according to the standard procedure using antibodies against pAkt-ser473 (Cell Signaling) and Actin (Sigma-Aldrich).17
Transfection
Transfection of a CMV:eGFP construct was performed using Lipofectamine (Invitrogen) following the manufacturer's instruction. All incubation steps were performed at 28°C and without any supply of CO2. Transfection efficiency was analyzed using an AMG Evos microscope and counting of (fluorescent) cells.
Immunohistochemistry
Euthanized fish were fixed with the Bouins's fixative solution overnight at room temperature and subsequently washed with 70% ethanol. Immunohistochemistry (IHC) was performed according to standard protocols. Briefly, fish were embedded in paraffin, sectioned (6 μm) transversally, placed on charged slides, deparaffinized, and stained with hematoxylin and eosin. Pictures were taken using a Leica DFC 500 connected to a Nikon Eclipse microscope with 20× and 40× objectives.
Reverse transcription PCR
RNA isolation was done using the RNeasy kit (Qiagen). Reverse transcription was performed using oligo(dT) and MMLV reverse transcriptase (Promega). Orthologs of human pecam1 (cd31) and cd34 were identified by BLAST searching in the zebrafish genome. Primers for pecam1, cd34, and fli1 were designed using Primer3 software. The identity of the resulting polymerase chain reaction (PCR) products was verified by sequencing. The kdr primers have been described before43 and actin beta-1 (actb1) was used as a control. All primers that were used for the reverse transcription polymerase chain reaction experiment and accession numbers for pecam1, cd34, and fli1 are depicted in Table 4.
Table 4.
Reverse Transcription Primers for Endothelial Markers
| Gene name | Identifier | Forward primer | Reverse primer |
|---|---|---|---|
| pecam1 (cd31) | NM 001113799 | tcaccaaagacggcacca | gcgttgaccatctttaagca |
| cd34l | XM 002662526 | gctcactcaactcaacgtacca | aacttcccagccattccttt |
| fli1 | NM 131348 | tcaatggatccagagagtcg | cgtctttgctcatcttgcag |
| Kdr | XM 684185 | acagagaaagatgctgggaat | gctactgccgtacatgtgga |
| actb1 | NM 131031 | cttgcggtatccacgagac | gcgccatacagagcagaa |
Results
The protocol described here was designed for generating cell lines from single zebrafish embryos or a single tumor, respectively, which will enable multiple applications in cancer and biomedical research. We derived cell lines from an incross of ptena+/−ptenb−/− fish and established the genotypes of the cell lines once they were stable. In addition, we derived a cell line from a tumor of a ptena+/−ptenb−/− fish, which was histologically established as a hemangiosarcoma17 (Fig. 6g, h). For culturing the cell lines, we used different media compositions as listed in Table 1 and optimized the L15 media by adding supplements as listed in Table 2. The composition of L15 growth media allows the cells to grow without additional CO2 supply. Established cell lines from zebrafish are able to grow at room temperature even in the absence of an incubator. For sterile conditions, we recommend the use of a simple incubator with minimal ventilation. The main objective during the first 3–4 weeks is to keep the cells alive and allow them to adjust to the media and culture conditions. Cell passage allows a new arrangement of cells and stimulates proliferation. The main goal is to establish a single cell type since different cell types behave differently and need different growth conditions. The time estimation is around 3–5 months to establish a pro-stable line. After 6 months of culturing, the cell line is prestable and after 1 year, a stable cell line is generated that is morphologically homogeneous. In general, to definitively ensure the homogeneity of a cell line requires cloning, for instance, by limiting dilution, which is feasible with the culture conditions described here. We found that after passaging for more than 57 times in 2 years, cell lines from zebrafish are stable for long-term culture. The hemangiosarcomas are endothelial cell-derived tumors and we used reverse transcription-PCR to investigate whether the tumor-derived cell line expressed endothelial markers, including pecam1, cd34, fli1, and kdr. All four markers were expressed by the tumor and by 3 dpf embryos (positive control). The tumor-derived cell line expressed all, but one (pecam1), markers, whereas a control cell line, which was derived from a zebrafish embryo with the same genotype as the tumor-derived cell line (ptena+/−ptenb−/−), did not express any of the endothelial markers (Fig. 7a). These results are consistent with the tumor-derived cell line being of endothelial origin. Further characterization of these cell lines, for instance, by expression profiling will allow us to assess to what extent the cell lines have deviated from the original tumor.
FIG. 7.

Zebrafish cells are amenable for experimental approaches. (a) Reverse transcription-PCR using RNA from 3 dpf embryos, hemangiosarcoma (tumor), contralateral control tissue, tumor cell line, a control cell line with the same genotype as the tumor-derived cell line (ptena+/−ptenb−/−) and H2O as a control. The primers that were used for the four endothelial markers and the loading control (actin beta 1, actb1) are depicted in Table 4. (b) Cells lacking Pten display an increased phosphoAkt level compared to wild type, illustrated by immunoblotting using phosphoAkt-specific antibodies. Anti-actin is included as a loading control. (c, d) Zebrafish cells are readily transfectable using lipofectamine (Invitrogen), illustrated by transfection of a CMV:eGFP construct that results in green fluorescent protein (GFP) expression throughout the cell. Pictures were taken using an AMG Evos microscope.
Zebrafish cells are easy to handle and can be used for many applications. For example, we isolated cell lysates from two distinct cell lines and used these lysates for genotyping and immunoblotting. The two cell lines were derived from wild-type and ptena+/−ptenb−/− zebrafish embryos, respectively, and their genotypes were confirmed by sequencing.12 Immunoblotting using phosphoAkt-specific antibodies illustrated as expected that ptena+/−ptenb−/− cells had elevated phosphoAkt levels compared to wild-type cells (Fig. 7b). Equal loading of proteins was monitored by blotting for Actin. These immunoblots demonstrate that zebrafish cell lines can be used to analyze signaling in zebrafish cell lines.
Next, we transfected wild-type zebrafish cell lines with a CMV promoter-driven expression vector for eGFP, using lipofectamine. It is evident that these cells are readily transfectable using this method (Fig. 7c, d). Without optimization of the transfection protocol, transfection efficiencies were around 10%. Transfection experiments will allow us to label cell lines with fluorescent proteins and to introduce target proteins in mutant cells, which may rescue the mutant phenotype.
Conclusion
Here, we successfully established a protocol to culture cells from an embryo or tumor tissue. We established cell lines from single embryos with distinct genetic backgrounds as well as from tumor tissues. Notably, we derived a fibroblast-like ptenb−/− cell line from an embryo and a ptena+/−ptenb−/− endothelial-like cell line from a tumor. These cell lines have been in culture for more than 2 years demonstrating that our conditions allow establishment of stable cell lines. Further, we used several experimental approaches on these cell lines as proof-of-principle, including immunoblotting and transfection. We envision that these cell lines may also be used for biochemical analyses, IHC, and grafting before or after genetic manipulation. The protocol described here is straightforward and can easily be adapted to establish cell lines from zebrafish embryos with any mutant or transgenic background. The use of cell lines complements the repertoire of experimental approaches that are being used in zebrafish research.
Acknowledgments
The authors would like to thank Jeroen Paardekooper Overman for critical reading of the article and Jeroen Korving for excellent histotechnical support. This project was supported, in part, by an EU (FP7) grant, HEALTH-F2-2008-201439 (ZF-CANCER).
Author Disclosure Statement
The authors declare that they have no competing financial interests.
References
- 1.Lieschke GJ. Currie PD. Animal models of human disease: zebrafish swim into view. Nat Rev Genet. 2007;8:353–367. doi: 10.1038/nrg2091. [DOI] [PubMed] [Google Scholar]
- 2.Amatruda JF. Shepard JL. Stern HM. Zon LI. Zebrafish as a cancer model system. Cancer Cell. 2002;1:229–231. doi: 10.1016/s1535-6108(02)00052-1. [DOI] [PubMed] [Google Scholar]
- 3.Alders M. Hogan BM. Gjini E. Salehi F. Al-Gazali L. Hennekam EA, et al. Mutations in CCBE1 cause generalized lymph vessel dysplasia in humans. Nat Genet. 2009;41:1272–1274. doi: 10.1038/ng.484. [DOI] [PubMed] [Google Scholar]
- 4.Cirstea IC. Kutsche K. Dvorsky R. Gremer L. Carta C. Horn D, et al. A restricted spectrum of NRAS mutations causes Noonan syndrome. Nat Genet. 42:27–29. doi: 10.1038/ng.497. [DOI] [PMC free article] [PubMed] [Google Scholar]
- 5.Jopling C. van Geemen D. den Hertog J. Shp2 knockdown and Noonan/LEOPARD mutant Shp2-induced gastrulation defects. PLoS Genet. 2007;3:e225. doi: 10.1371/journal.pgen.0030225. [DOI] [PMC free article] [PubMed] [Google Scholar]
- 6.Lam SH. Wu YL. Vega VB. Miller LD. Spitsbergen J. Tong Y, et al. Conservation of gene expression signatures between zebrafish and human liver tumors and tumor progression. Nat Biotechnol. 2006;24:73–75. doi: 10.1038/nbt1169. [DOI] [PubMed] [Google Scholar]
- 7.Collodi P. Kamei Y. Ernst T. Miranda C. Buhler DR. Barnes DW. Culture of cells from zebrafish (Brachydanio rerio) embryo and adult tissues. Cell Biol Toxicol. 1992;8:43–61. doi: 10.1007/BF00119294. [DOI] [PubMed] [Google Scholar]
- 8.Driever W. Rangini Z. Characterization of a cell line derived from zebrafish (Brachydanio rerio) embryos. In Vitro Cell Dev Biol Anim. 1993;29A:749–754. doi: 10.1007/BF02631432. [DOI] [PubMed] [Google Scholar]
- 9.Ma C. Fan L. Ganassin R. Bols N. Collodi P. Production of zebrafish germ-line chimeras from embryo cell cultures. Proc Natl Acad Sci U S A. 2001;98:2461–2466. doi: 10.1073/pnas.041449398. [DOI] [PMC free article] [PubMed] [Google Scholar]
- 10.Xing JG. Lee LE. Fan L. Collodi P. Holt SE. Bols NC. Initiation of a zebrafish blastula cell line on rainbow trout stromal cells and subsequent development under feeder-free conditions into a cell line, ZEB2J. Zebrafish. 2008;5:49–63. doi: 10.1089/zeb.2007.0512. [DOI] [PubMed] [Google Scholar]
- 11.He S. Salas-Vidal E. Rueb S. Krens SF. Meijer AH. Snaar-Jagalska BE, et al. Genetic and transcriptome characterization of model zebrafish cell lines. Zebrafish. 2006;3:441–453. doi: 10.1089/zeb.2006.3.441. [DOI] [PubMed] [Google Scholar]
- 12.Faucherre A. Taylor GS. Overvoorde J. Dixon JE. Hertog J. Zebrafish pten genes have overlapping and non-redundant functions in tumorigenesis and embryonic development. Oncogene. 2008;27:1079–1086. doi: 10.1038/sj.onc.1210730. [DOI] [PubMed] [Google Scholar]
- 13.Patton EE. Widlund HR. Kutok JL. Kopani KR. Amatruda JF. Murphey RD, et al. BRAF mutations are sufficient to promote nevi formation and cooperate with p53 in the genesis of melanoma. Curr Biol. 2005;15:249–254. doi: 10.1016/j.cub.2005.01.031. [DOI] [PubMed] [Google Scholar]
- 14.Michailidou C. Jones M. Walker P. Kamarashev J. Kelly A. Hurlstone AF. Dissecting the roles of Raf- and PI3K-signalling pathways in melanoma formation and progression in a zebrafish model. Dis Model Mech. 2009;2:399–411. doi: 10.1242/dmm.001149. [DOI] [PubMed] [Google Scholar]
- 15.Berghmans S. Murphey RD. Wienholds E. Neuberg D. Kutok JL. Fletcher CD, et al. tp53 mutant zebrafish develop malignant peripheral nerve sheath tumors. Proc Natl Acad Sci U S A. 2005;102:407–412. doi: 10.1073/pnas.0406252102. [DOI] [PMC free article] [PubMed] [Google Scholar]
- 16.Santoriello C. Deflorian G. Pezzimenti F. Kawakami K. Lanfrancone L. d'Adda di Fagagna F, et al. Expression of H-RASV12 in a zebrafish model of Costello syndrome causes cellular senescence in adult proliferating cells. Dis Model Mech. 2009;2:56–67. doi: 10.1242/dmm.001016. [DOI] [PMC free article] [PubMed] [Google Scholar]
- 17.Choorapoikayil S. Kuiper RV. de Bruin A. den Hertog J. Haploinsufficiency of the genes encoding the tumor suppressor Pten predisposes zebrafish to hemangiosarcoma. Dis Model Mech. 2012;5:241–247. doi: 10.1242/dmm.008326. [DOI] [PMC free article] [PubMed] [Google Scholar]
- 18.Mizgirev I. Revskoy S. Generation of clonal zebrafish lines and transplantable hepatic tumors. Nat Protoc. 2010;5:383–394. doi: 10.1038/nprot.2010.8. [DOI] [PubMed] [Google Scholar]
- 19.Lee LM. Seftor EA. Bonde G. Cornell RA. Hendrix MJ. The fate of human malignant melanoma cells transplanted into zebrafish embryos: assessment of migration and cell division in the absence of tumor formation. Dev Dyn. 2005;233:1560–1570. doi: 10.1002/dvdy.20471. [DOI] [PubMed] [Google Scholar]
- 20.Taylor AM. Zon LI. Zebrafish tumor assays: the state of transplantation. Zebrafish. 2009;6:339–346. doi: 10.1089/zeb.2009.0607. [DOI] [PMC free article] [PubMed] [Google Scholar]
- 21.White RM. Sessa A. Burke C. Bowman T. LeBlanc J. Ceol C, et al. Transparent adult zebrafish as a tool for in vivo transplantation analysis. Cell Stem Cell. 2008;2:183–189. doi: 10.1016/j.stem.2007.11.002. [DOI] [PMC free article] [PubMed] [Google Scholar]
- 22.Langenau DM. Ferrando AA. Traver D. Kutok JL. Hezel JP. Kanki JP, et al. In vivo tracking of T cell development, ablation, and engraftment in transgenic zebrafish. Proc Natl Acad Sci U S A. 2004;101:7369–7374. doi: 10.1073/pnas.0402248101. [DOI] [PMC free article] [PubMed] [Google Scholar]
- 23.Langenau DM. Traver D. Ferrando AA. Kutok JL. Aster JC. Kanki JP, et al. Myc-induced T cell leukemia in transgenic zebrafish. Science. 2003;299:887–890. doi: 10.1126/science.1080280. [DOI] [PubMed] [Google Scholar]
- 24.Langenau DM. Keefe MD. Storer NY. Guyon JR. Kutok JL. Le X, et al. Effects of RAS on the genesis of embryonal rhabdomyosarcoma. Genes Dev. 2007;21:1382–1395. doi: 10.1101/gad.1545007. [DOI] [PMC free article] [PubMed] [Google Scholar]
- 25.Amsterdam A. Sadler KC. Lai K. Farrington S. Bronson RT. Lees JA, et al. Many ribosomal protein genes are cancer genes in zebrafish. PLoS Biol. 2004;2:E139. doi: 10.1371/journal.pbio.0020139. [DOI] [PMC free article] [PubMed] [Google Scholar]
- 26.Shepard JL. Amatruda JF. Stern HM. Subramanian A. Finkelstein D. Ziai J, et al. A zebrafish bmyb mutation causes genome instability and increased cancer susceptibility. Proc Natl Acad Sci U S A. 2005;102:13194–13199. doi: 10.1073/pnas.0506583102. [DOI] [PMC free article] [PubMed] [Google Scholar]
- 27.Croushore JA. Blasiole B. Riddle RC. Thisse C. Thisse B. Canfield VA, et al. Ptena and ptenb genes play distinct roles in zebrafish embryogenesis. Dev Dyn. 2005;234:911–921. doi: 10.1002/dvdy.20576. [DOI] [PMC free article] [PubMed] [Google Scholar]
- 28.Li J. Yen C. Liaw D. Podsypanina K. Bose S. Wang SI, et al. PTEN, a putative protein tyrosine phosphatase gene mutated in human brain, breast, and prostate cancer. Science. 1997;275:1943–1947. doi: 10.1126/science.275.5308.1943. [DOI] [PubMed] [Google Scholar]
- 29.Steck PA. Pershouse MA. Jasser SA. Yung WK. Lin H. Ligon AH, et al. Identification of a candidate tumour suppressor gene, MMAC1, at chromosome 10q23.3 that is mutated in multiple advanced cancers. Nat Genet. 1997;15:356–362. doi: 10.1038/ng0497-356. [DOI] [PubMed] [Google Scholar]
- 30.Ali IU. Schriml LM. Dean M. Mutational spectra of PTEN/MMAC1 gene: a tumor suppressor with lipid phosphatase activity. J Natl Cancer Inst. 1999;91:1922–1932. doi: 10.1093/jnci/91.22.1922. [DOI] [PubMed] [Google Scholar]
- 31.Li DM. Sun H. TEP1, encoded by a candidate tumor suppressor locus, is a novel protein tyrosine phosphatase regulated by transforming growth factor beta. Cancer Res. 1997;57:2124–2129. [PubMed] [Google Scholar]
- 32.Myers MP. Pass I. Batty IH. Van der Kaay J. Stolarov JP. Hemmings BA, et al. The lipid phosphatase activity of PTEN is critical for its tumor supressor function. Proc Natl Acad Sci U S A. 1998;95:13513–13518. doi: 10.1073/pnas.95.23.13513. [DOI] [PMC free article] [PubMed] [Google Scholar]
- 33.Salmena L. Carracedo A. Pandolfi PP. Tenets of PTEN tumor suppression. Cell. 2008;133:403–414. doi: 10.1016/j.cell.2008.04.013. [DOI] [PubMed] [Google Scholar]
- 34.Maehama T. Dixon JE. The tumor suppressor, PTEN/MMAC1, dephosphorylates the lipid second messenger, phosphatidylinositol 3,4,5-trisphosphate. J Biol Chem. 1998;273:13375–13378. doi: 10.1074/jbc.273.22.13375. [DOI] [PubMed] [Google Scholar]
- 35.Stambolic V. Suzuki A. de la Pompa JL. Brothers GM. Mirtsos C. Sasaki T, et al. Negative regulation of PKB/Akt-dependent cell survival by the tumor suppressor PTEN. Cell. 1998;95:29–39. doi: 10.1016/s0092-8674(00)81780-8. [DOI] [PubMed] [Google Scholar]
- 36.Di Cristofano A. Pesce B. Cordon-Cardo C. Pandolfi PP. Pten is essential for embryonic development and tumour suppression. Nat Genet. 1998;19:348–355. doi: 10.1038/1235. [DOI] [PubMed] [Google Scholar]
- 37.Podsypanina K. Ellenson LH. Nemes A. Gu J. Tamura M. Yamada KM, et al. Mutation of Pten/Mmac1 in mice causes neoplasia in multiple organ systems. Proc Natl Acad Sci U S A. 1999;96:1563–1568. doi: 10.1073/pnas.96.4.1563. [DOI] [PMC free article] [PubMed] [Google Scholar]
- 38.Suzuki A. de la Pompa JL. Stambolic V. Elia AJ. Sasaki T. del Barco Barrantes I, et al. High cancer susceptibility and embryonic lethality associated with mutation of the PTEN tumor suppressor gene in mice. Curr Biol. 1998;8:1169–1178. doi: 10.1016/s0960-9822(07)00488-5. [DOI] [PubMed] [Google Scholar]
- 39.Trotman LC. Niki M. Dotan ZA. Koutcher JA. Di Cristofano A. Xiao A, et al. Pten dose dictates cancer progression in the prostate. PLoS Biol. 2003;1:E59. doi: 10.1371/journal.pbio.0000059. [DOI] [PMC free article] [PubMed] [Google Scholar]
- 40.Wang S. Gao J. Lei Q. Rozengurt N. Pritchard C. Jiao J, et al. Prostate-specific deletion of the murine Pten tumor suppressor gene leads to metastatic prostate cancer. Cancer Cell. 2003;4:209–221. doi: 10.1016/s1535-6108(03)00215-0. [DOI] [PubMed] [Google Scholar]
- 41.Badakov R. Jazwinska A. Efficient transfection of primary zebrafish fibroblasts by nucleofection. Cytotechnology. 2006;51:105–110. doi: 10.1007/s10616-006-9018-3. [DOI] [PMC free article] [PubMed] [Google Scholar]
- 42.Nicoli S. De Sena G. Presta M. Fibroblast growth factor 2-induced angiogenesis in zebrafish: the zebrafish yolk membrane (ZFYM) angiogenesis assay. J Cell Mol Med. 2009;13:2061–2068. doi: 10.1111/j.1582-4934.2008.00432.x. [DOI] [PMC free article] [PubMed] [Google Scholar]
- 43.van Rooijen E. Voest EE. Logister I. Bussmann J. Korving J. van Eeden FJ, et al. von Hippel-Lindau tumor suppressor mutants faithfully model pathological hypoxia-driven angiogenesis and vascular retinopathies in zebrafish. Dis Model Mech. 2010;3:343–353. doi: 10.1242/dmm.004036. [DOI] [PubMed] [Google Scholar]