Abstract
Epithelial-mesenchymal transition (EMT) of adherent epithelial cells to a migratory mesenchymal state has been implicated in tumor metastasis in preclinical models. To investigate its role in human cancer, we characterized EMT in circulating tumor cells (CTCs) from breast cancer patients. Rare primary tumor cells simultaneously expressed mesenchymal and epithelial markers, but mesenchymal cells were highly enriched in CTCs. Serial CTC monitoring in 11 patients suggested an association of mesenchymal CTCs with disease progression. In an index patient, reversible shifts between these cell fates accompanied each cycle of response to therapy and disease progression. Mesenchymal CTCs occurred as both single cells and multicellular clusters, expressing known EMT regulators, including transforming growth factor (TGF)–β pathway components and the FOXC1 transcription factor. These data support a role for EMT in the blood-borne dissemination of human breast cancer.
Most cancer-related deaths are caused by metastasis, the dissemination of cancer cells from the primary tumor through the blood to new organ sites (1). Aberrant activation of epithelial-mesenchymal transition (EMT) has been implicated in this process, based on studies with human cancer cell lines and mouse models (2, 3). Immunohistochemical approaches to identify EMT in tumors is complicated by the presence of reactive mesenchymal stromal cells (4, 5), and analysis of circulating tumor cells (CTCs) has been hampered by reliance on epithelial markers to separate cancer cells from surrounding hematopoietic cells of mesenchymal origin (6, 7). To address these technical challenges, we optimized microfluidic capture of CTCs with epithelial- and tumor-specific antibodies, and we then used this technology to analyze EMT in CTCs from breast cancer patients.
We established a quantifiable, dual-colorimetric RNA–in situ hybridization (ISH) assay to examine tumor cells for expression of seven pooled epithelial (E) transcripts [keratins (KRT) 5, 7, 8, 18, and 19; EpCAM (epithelial cell adhesion molecule); and CDH1 (cadherin 1)] and three mesenchymal (M) transcripts [FN1 (fibronectin 1), CDH2 (cadherin 2), and SERPINE1/PAI1 (serpin peptidase inhibitor, clade E)]. These probes were validated in cell lines to confirm differential expression in epithelial versus mesenchymal cancer cells and the absence of expression in blood cells that contaminate CTC preparations (table S1 and fig. S1A). After validating the E/M RNA-ISH analysis in mouse xenografts of epithelial or mesenchymal breast cancer cells (fig. S1B), we applied the assays to primary human breast cancer specimens.
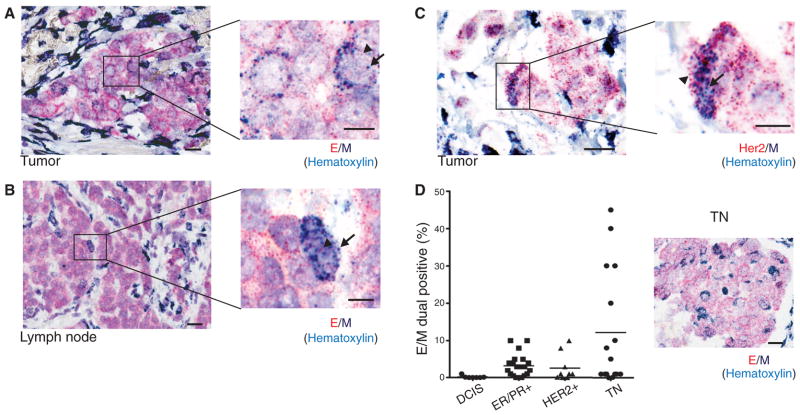
Among the majority of E+ cancer cells, and distinct from the M+ stromal cells, we detected a small number of biphenotypic E+/M+ cells with clear epithelial histology, both in primary tumors and in draining lymph nodes (Fig. 1, A and B). Dual–RNA-ISH staining for M markers and a tumor-specific marker (HER2) confirmed the identity of such mesenchymal cells as tumor-derived (Fig. 1C). We scored tissue microarrays (TMAs) containing multiple primary breast cancers of various histological subtypes for the number of dual E+/M+ cells. Using this assay, we found that benign breast tissue (N = 6 cases) and tumor cells in pre-invasive ductal carcinoma in situ (DCIS) lesions (N = 7 cases) were exclusively epithelial, whereas reactive stromal cells were exclusively mesenchymal. In contrast, we found that all three major histological subtypes of invasive breast cancer contained rare tumor cells with epithelial morphology that stained with both E and M markers: ER/PR+ subtype (mean = 3.3%, range 0 to 10%, N = 20 cases); HER2+ subtype (mean = 2.7%, range 0 to 10%, N = 9 cases); and the triple negative (TN) (ER−/PR−/HER2−) subtype (mean = 12.1%, range 0 to 45%, N = 16 cases) (Fig. 1D). The higher number of M+ tumor cells in primary TN breast cancer is consistent with this type of breast cancer being enriched for mesenchymal markers, including vimentin (8, 9). Some TN cases contained clusters of cells in the middle of the tumor mass that were strongly positive for both E and M markers, yet were histologically indistinguishable from the neighboring E+ tumor cells (Fig. 1D). Thus, human primary breast tumors contain rare cancer cells that co-express mesenchymal and epithelial markers.
Fig. 1.
RNA-ISH analysis of EMT markers in human breast tumors. Representative RNA-ISH analysis of pooled epithelial (E) (red dots, arrowheads) and mesenchymal (M) (dark blue dots, arrows) markers in (A) primary tumor and (B) tumor-infiltrated lymph node of a patient with ductal ER+/PR+ type breast cancer. (C) RNA-ISH analysis of HER2 (red dots, arrowheads) and M (dark blue dots, arrows) expression in a HER2+ primary breast tumor. (D) Quantitation of E and M dual-positive tumor cells (percentage of total tumor cells) in a TMA consisting of premalignant DCIS (N = 7 cases) and ER+/PR+ (N = 20 cases), HER2+ (N = 9 cases), and TN (N = 16 cases) breast cancers. A representative image from a TN case is shown on the right. E, red dots; M, dark blue dots; nuclei are stained with hematoxylin, light blue. Scale bars: (A) to (D), 20 μm; inserts, 10 μm.
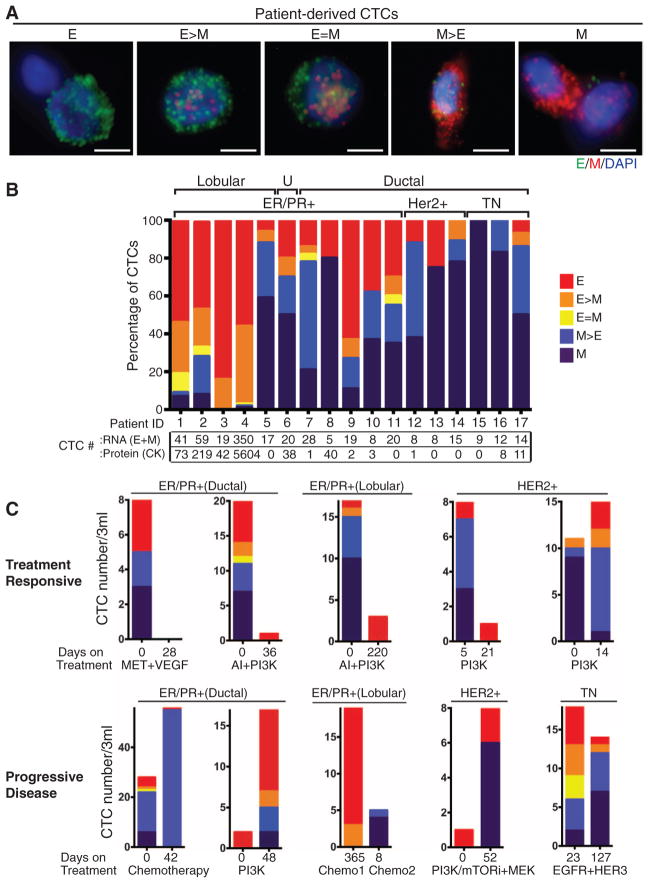
To extend our EMT analysis to CTCs, we used the microfluidic HB (herringbone)–chip (10) to capture CTCs from blood with an antibody cocktail directed against EpCAM, EGFR (epithelial growth factor receptor), and HER2 (human epithelial growth factor receptor 2) (fig. S2). Human breast cancer cell lines exhibiting epithelial (MCF7 and SKBR3) and mesenchymal (MDA-MB-231) characteristics were spiked into blood and captured on the triple-antibody cocktail-coated CTC-chip to ensure capture efficiencies of 80 to 90%. MCF10A cells expressing the EMT-inducing transcription factor LBX1 (11) were used to optimize the quantitative immunofluorescence–based E and M RNA-ISH detection of cells captured on the CTC-chip (fig. S3). Using this assay, we defined five categories of cells ranging from exclusively epithelial (E) to intermediate (E > M, E = M, M > E) and exclusively mesenchymal (M) (fig. S3 and Fig. 2A).
Fig. 2.
RNA-ISH analysis of EMT markers in CTCs from patients with metastatic breast cancer. (A) Representative images of five types of CTCs isolated from patients with metastatic breast cancer, based on RNA-ISH staining of E (green dots) and M (red dots) markers. Scale bar, 5 μm (B) Quantitation of EMT features in CTCs based on E and M RNA-ISH staining of histological subtypes of breast cancer [lobular, ductal, and U (unknown)], along with molecular classification (ER/PR, HER2, TN). CTC numbers per 3 ml of blood based on RNA (E+M) or protein (CK) staining are listed below. (C) Fractionation of CTCs according to E/M ratios in five patients who were clinically responding to treatment (top) and five patients who had progressive disease on treatment (bottom). The subtype of breast cancer, each patient’s treatment regimen, and the number of days on treatment are shown. The drugs used to inhibit the signaling pathways shown on the figure are as follows: MET + VEGF (vascular endothelial growth factor), cabozantinib; AI (aromatase inhibitor), letrozole; PI3K (phosphatidylinositol 3-kinase), BKM120, INK1117, and BYL719; PI3K/mTOR (mammalian target of rapamycin), SAR245409; MEK (MAP kinase kinase), MSC193639B; EGFR/HER3 (human epidermal growth factor receptor 3), MEHD7945A. The chemotherapeutic drugs used were cisplatin, taxol, and adriamycin. Tumor genotypes are given in table S2.
To determine the cutoff for a positive CTC score, we first analyzed samples from five healthy blood donors. Two mesenchymal cells were identified in one of the five specimens (median 0, range 0 to 2 cells per 3 ml). To set a conservative threshold, we established 5 cells per 3 ml as cutoff for a positive CTC score. We next analyzed blood samples from 41 patients at various stages of treatment for metastatic breast cancer. Seventeen patients (41%) scored positive for CTCs, with EMT features varying according to histological subtype (Fig. 2, A and B). CTCs from patients with lobular type cancers (typically ER+/PR+) were predominantly epithelial, whereas those from the TN subtype were predominantly mesenchymal. Interestingly, CTCs from patients with HER2+ breast cancer, whose primary tumors typically contain few E+/M+ cells, were also predominantly mesenchymal (Fig. 2B). Of note, standard cytokeratin-based protein staining of CTCs was comparable to RNA-ISH for scoring epithelial CTCs but dramatically undercounted cases with mesenchymal CTCs (12).
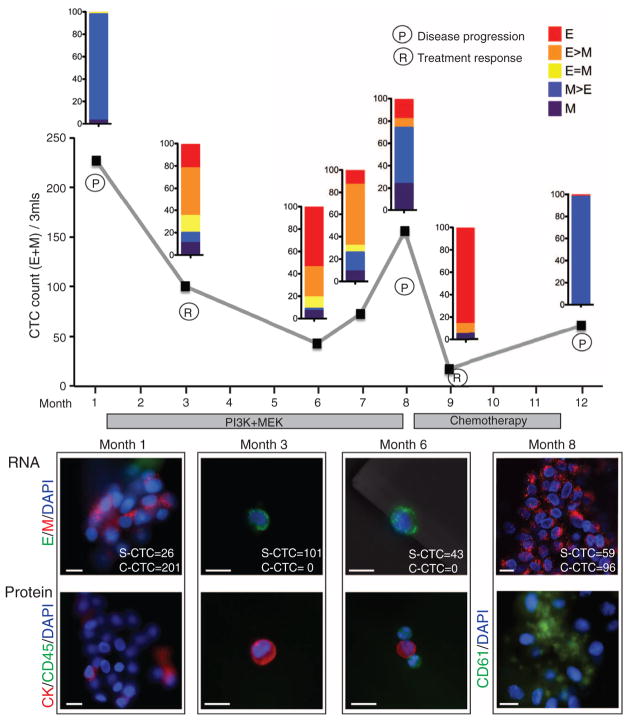
We next compared CTC features in pre- and posttreatment blood samples from 10 of these cases. Five patients who responded to therapy showed a decrease in CTC numbers and/or a proportional decrease in M+ compared with E+ CTCs in the posttreatment sample (Fig. 2C). In contrast, five patients who had progressive disease while on therapy showed an increased number of M+ CTCs in the posttreatment sample. We obtained serial specimens from one index patient with ER/PR+ lobular carcinoma. This patient had initially responded to an experimental regimen, developed resistance, and then responded transiently to standard chemotherapy (Fig. 3). A high number of M+ CTCs was evident at the first time point. The first clinical response to the experimental regimen was accompanied by declining CTC numbers and a switch to predominantly E+ cells. After 7 months of this therapy, the patient showed disease progression, which was associated with an increase in M+ CTCs. These cells declined in number again and switched to an E+ phenotype during a second response to the chemotherapy regimen. After 3 months, the patient again showed disease progression, along with a switch to M+ CTCs (Fig. 3).
Fig. 3.
Longitudinal monitoring of EMT features in CTCs from an index patient. Plot of CTC counts per 3 ml of blood based on RNA (E and M markers) detection methods in a patient with KRAS- and PIK3CA-mutant ER/PR+ lobular breast cancer, who was serially sampled during treatment with inhibitors targeting the PI3K (GDC0941) and MEK (GDC0973) pathways, followed by adriamycin chemotherapy. Color-coded quantitation of EMT features based on RNA-ISH staining is shown above each time point. Treatment history and clinical responses are noted on the chart. P, disease progression; R, treatment response). M+ clusters were detected at time points 1, 8, and 12. Images of CTCs staining for E (green) and M (red) markers and protein staining for CK (red), CD45 (green), or platelet marker CD61 (green) from different time points are shown below the chart. The number of single CTCs (S-CTC) detected on the entire CTC-chip upon processing 3 ml of blood and the number of CTCs within the CTC clusters (C-CTC) are indicated. Nuclei are stained with 4′,6-diamidino-2-phenylindole (DAPI) (blue). Scale bar, 10 μm. Criteria for disease progression (P) or treatment response (R) are described in the supplementary materials.
The increase in M+ CTCs in the index patient was accompanied by the appearance of multicellular CTC clusters, ranging from 4 to 50 cells, with one cluster having ~100 tumor cells (Fig. 3, fig. S4, and movie S1). These clusters were absent from specimens with predominantly E+ CTCs. CTC clusters are seen in patients with advanced cancer (10) and can be detected with different CTC isolation platforms (13, 14). The CTC clusters were strongly positive for M markers and weakly positive for E markers by ISH and were stained weakly with epithelial cytokeratin antibodies (Fig. 3). This observation is at odds with the prevailing hypothesis that EMT results in highly migratory single cells rather than clusters of cells bearing mesenchymal markers (2, 3). However, consistent with the recent observation that platelets bound to tumor cells release transforming growth factor β (TGF-β), potentially inducing EMT within the circulation (15), staining of CTC clusters showed an abundance of attached (CD61-positive) platelets (Fig. 3). We detected M+ CTC clusters of 2 to 20 cells not only in the index patient but in two additional patients, both with ER/PR+ breast cancer (fig. S5).
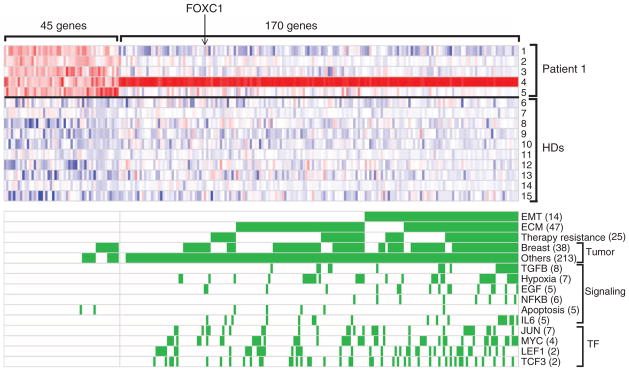
To identify signaling pathways within CTCs that contribute to EMT in breast cancer patients, we subjected these to RNA sequencing, using a single-molecule platform to avoid amplification bias associated with rare templates (16, 17). Because captured CTCs are contaminated with abundant leukocytes, we processed each specimen through paired anti-EpCAM–capture and mock-capture CTC-chips, allowing us to subtract digital gene expression (DGE) profiles of adherent blood cells from the CTC-enriched cells. DGE profiles for CTC-enriched cell populations from the index patient at five serial time points identified 45 enriched genes, compared with similarly processed blood samples from 10 healthy donors used to measure anti-EpCAM–capture background [permutation-based statistical model applied to each of five time points with a false discovery rate (FDR) threshold of 0.15] (Fig. 4 and table S3). Enriched transcripts included epithelial keratins KRT 8 and 19, and breast tumor markers, mammaglobins (SCGB2A2 and SCGB2A1), and trefoil factors 1 and 3 (TFF1 and TFF3), the most abundant of which (TFF1) was highly expressed in both primary tumor and metastatic lymph node from this patient (fig. S6). CTC-associated transcripts identified 12 signatures in the Gene Set Enrichment Analysis (GSEA) database, with an FDR < 0.25 (Fig. 4 and table S4). The strongest association was with a gene signature up-regulated in bone relapse of breast cancer (P = 1.32 × 10⁻⁷; FDR = 0.000767), which is noteworthy because the patient had metastatic bone lesions at the time of CTC analysis.
Fig. 4.

RNA-sequence analysis of transcripts enriched in CTCs. Heat map representing transcripts enriched in CTCs captured from the index patient, who was sampled at multiple time points during treatment. A CTC signature of 45 genes was derived by comparing 5 time points from the patient (rows 1 to 5) with identically processed blood specimens from 10 healthy donors (HDs) (rows 6 to 15). An EMT-specific signature of 170 genes was derived from comparing M+ cluster-enriched CTCs (row 4) with E+ CTCs. Red and blue colors indicate relative high and low gene expression, respectively. Categories of gene signatures in the GSEA database are shown for both the 45 gene CTC signature and the 170 gene EMT-cluster CTC signature, with genes contributing to the enrichment highlighted in green. The number of enriched signatures within each category is given in parentheses.
An additional set of 170 transcripts was enriched in CTCs captured at a mesenchymal predominant time point, characterized by multiple (>18) M+ CTC clusters (Fig. 4 and table S5). SERPINE1/PAI1 and FN1, two mesenchymal probes used in the RNA-ISH panel, were the most and third most abundant CTC cluster-associated transcripts. The GSEA database identified 717 gene signatures (FDR of 0.25) (Fig. 4 and table S6) with dramatic enrichment for EMT-related expression changes, including significant overlap with a core EMT signature (18) (table S7) (11 out of 90; P = 8.1 × 10⁻⁸; odds ratio = 9.8). In addition, enrichment for extracellular matrix (ECM) and ECM-related membrane receptors (including integrin and interleukin receptors) were potentially associated with the clustering phenomenon. Signatures reported in invasive ductal and lobular carcinomas, therapy resistance, and TGF-β, interleukin-6, and WNT (LEF1) signaling pathways were also noted. Among these, the most significant was TGF-β (P = 2.96 × 10⁻¹¹), a potent initiator of mesenchymal transformation (2), directly implicated in platelet-induced EMT (15). Expression of Snail, Slug, or other well-established transcriptional regulators of EMT was not detected in the M+ CTC clusters, but Forkhead box protein C1 (FOXC1) (Fig. 4), a transcription factor that induces EMT in cell culture models (19, 20), was detected. RNA-ISH revealed FOXC1 expression in CTCs and within localized regions of primary breast cancer and a tumor-infiltrated lymph node from the index patient and other cases (fig. S7). Thus, along with TGF-β activation, aberrant expression of FOXC1 may contribute to EMT in human breast cancer.
In summary, we have provided evidence of EMT in human breast cancer specimens, both in rare cells within primary tumors and more abundantly in CTCs. These findings are consistent with results derived from mouse tumor models, including recent studies using lineage tracing in Kras/Tp53 pancreatic and Her2-transgenic breast cancers (21, 22) and with the detection of vimentin-stained and/or CK− CTCs in patients with cancer (23–25). Notably, we found a striking association between expression of mesenchymal markers and clusters of CTCs, rather than single migratory cells. The expression of mesenchymal markers by these adherent cells could result from proliferation of a single cell that has undergone EMT into a cluster of such cells or, alternatively, from the mesenchymal transformation of preexisting CTC clusters within the bloodstream. The proposal that mesenchymal transformation of epithelial cells is mediated by TGF-β released from platelets (15) is supported by our observation of strong TGF-β signatures in mesenchymal CTC clusters, many of which carry attached platelets. Collective migration of grouped cells that maintain their cell-cell and cell-matrix connections has been implicated in cancer metastasis (26, 27), and may involve increased survival signals as CTC clusters circulate in the blood (17, 28, 29). The clinical importance of EMT as a potential bio-marker of therapeutic resistance and as a potential drug target in breast cancer warrants further investigation.
Supplementary Material
Acknowledgments
We are grateful to all the patients who participated in this study; we thank D. Juric, C. Koris, and the Massachusetts General Hospital (MGH) clinical research coordinators for help with clinical studies; A. Gilman, B. Brannigan, and M. Zeinali for technical support; F. Ozsolak and P. Milos (Helicos) for RNA sequencing; A. Forrest-Hay and Q. Nguyen (Affymetrix) for RNA-ISH reagents; L. Libby for mouse studies; and J. Walsh for expertise with microscopy. This work was supported by grants from the Breast Cancer Research Foundation (D.A.H.), Stand Up To Cancer (D.A.H., M.T., and S.M.), Susan G. Komen for the Cure KG090412 (S.M.), NIBIB EB008047 (M.T., D.A.H.), NCI CA129933 (D.A.H.), the National Cancer Institute–MGH Federal Share Program (S.M.), and the Howard Hughes Medical Institute (M.Y. and D.A.H.). The MGH and M.T. have filed a patent for the HB (Herringbone) microchip (U.S. patent 09816815.4). Sequencing data have been deposited in the Gene Expression Omnibus database (accession no. GSE41245).
Footnotes
References and Notes
- 1.Nguyen DX, Bos PD, Massagué J. Nat Rev Cancer. 2009;9:274. doi: 10.1038/nrc2622. [DOI] [PubMed] [Google Scholar]
- 2.Thiery JP. Nat Rev Cancer. 2002;2:442. doi: 10.1038/nrc822. [DOI] [PubMed] [Google Scholar]
- 3.Kalluri R, Weinberg RA. J Clin Invest. 2009;119:1420. doi: 10.1172/JCI39104. [DOI] [PMC free article] [PubMed] [Google Scholar]
- 4.Brabletz T. Nat Rev Cancer. 2012;12:425. doi: 10.1038/nrc3265. [DOI] [PubMed] [Google Scholar]
- 5.Ledford H. Nature. 2011;472:273. doi: 10.1038/472273a. [DOI] [PubMed] [Google Scholar]
- 6.Pantel K, Brakenhoff RH, Brandt B. Nat Rev Cancer. 2008;8:329. doi: 10.1038/nrc2375. [DOI] [PubMed] [Google Scholar]
- 7.Yu M, Stott S, Toner M, Maheswaran S, Haber DA. J Cell Biol. 2011;192:373. doi: 10.1083/jcb.201010021. [DOI] [PMC free article] [PubMed] [Google Scholar]
- 8.Jeong H, Ryu YJ, An J, Lee Y, Kim A. Histopathology. 2012;60:E87. doi: 10.1111/j.1365-2559.2012.04195.x. [DOI] [PubMed] [Google Scholar]
- 9.Jiang Z, et al. Cell Cycle. 2011;10:1563. doi: 10.4161/cc.10.10.15703. [DOI] [PubMed] [Google Scholar]
- 10.Stott SL, et al. Proc Natl Acad Sci USA. 2010;107:18392. [Google Scholar]
- 11.Yu M, et al. Genes Dev. 2009;23:1737. doi: 10.1101/gad.1809309. [DOI] [PMC free article] [PubMed] [Google Scholar]
- 12.Payne RE, et al. Br J Cancer. 2012;106:1790. doi: 10.1038/bjc.2012.137. [DOI] [PMC free article] [PubMed] [Google Scholar]
- 13.Krebs MG, et al. J Thorac Oncol. 2012;7:306. doi: 10.1097/JTO.0b013e31823c5c16. [DOI] [PubMed] [Google Scholar]
- 14.Cho EH, et al. Phys Biol. 2012;9:016001. doi: 10.1088/1478-3975/9/1/016001. [DOI] [PMC free article] [PubMed] [Google Scholar]
- 15.Labelle M, Begum S, Hynes RO. Cancer Cell. 2011;20:576. doi: 10.1016/j.ccr.2011.09.009. [DOI] [PMC free article] [PubMed] [Google Scholar]
- 16.Ozsolak F, et al. Nat Methods. 2010;7:619. doi: 10.1038/nmeth.1480. [DOI] [PMC free article] [PubMed] [Google Scholar]
- 17.Yu M, et al. Nature. 2012;487:510. doi: 10.1038/nature11217. [DOI] [PMC free article] [PubMed] [Google Scholar]
- 18.Taube JH, et al. Proc Natl Acad Sci USA. 2010;107:15449. doi: 10.1073/pnas.1004900107. [DOI] [PMC free article] [PubMed] [Google Scholar]
- 19.Polyak K, Weinberg RA. Nat Rev Cancer. 2009;9:265. doi: 10.1038/nrc2620. [DOI] [PubMed] [Google Scholar]
- 20.Bloushtain-Qimron N, et al. Proc Natl Acad Sci USA. 2008;105:14076. doi: 10.1073/pnas.0805206105. [DOI] [PMC free article] [PubMed] [Google Scholar]
- 21.Hüsemann Y, et al. Cancer Cell. 2008;13:58. doi: 10.1016/j.ccr.2007.12.003. [DOI] [PubMed] [Google Scholar]
- 22.Rhim AD, et al. Cell. 2012;148:349. doi: 10.1016/j.cell.2011.11.025. [DOI] [PMC free article] [PubMed] [Google Scholar]
- 23.Armstrong AJ, et al. Mol Cancer Res. 2011;9:997. doi: 10.1158/1541-7786.MCR-10-0490. [DOI] [PMC free article] [PubMed] [Google Scholar]
- 24.Lecharpentier A, et al. Br J Cancer. 2011;105:1338. doi: 10.1038/bjc.2011.405. [DOI] [PMC free article] [PubMed] [Google Scholar]
- 25.Pecot CV, et al. Cancer Discov. 2011;1:580. doi: 10.1158/2159-8290.CD-11-0215. [DOI] [PMC free article] [PubMed] [Google Scholar]
- 26.Ilina O, Friedl P. J Cell Sci. 2009;122:3203. doi: 10.1242/jcs.036525. [DOI] [PubMed] [Google Scholar]
- 27.Duda DG, et al. Proc Natl Acad Sci USA. 2010;107:21677. doi: 10.1073/pnas.1016234107. [DOI] [PMC free article] [PubMed] [Google Scholar]
- 28.Kim YN, Koo KH, Sung JY, Yun UJ, Kim H. Int J Cell Biol. 2012;2012:306879. doi: 10.1155/2012/306879. [DOI] [PMC free article] [PubMed] [Google Scholar]
- 29.Hou JM, et al. J Clin Oncol. 2012;30:525. doi: 10.1200/JCO.2010.33.3716. [DOI] [PubMed] [Google Scholar]
Associated Data
This section collects any data citations, data availability statements, or supplementary materials included in this article.


