Abstract
This study evaluates reliability of current technology for measurement of renal arterial blood flow by breath-held velocity-encoded MRI. Overall accuracy was determined by comparing MRI measurements with known flow in controlled flow loop phantom studies. Measurements using prospective and retrospective gating methods were compared in phantom studies with pulsatile flow, not revealing significant differences. Phantom study results showed good accuracy with deviations from true flow consistently below 13% for vessel diameters 3 mm and above. Reproducibility in human subjects was evaluated by repeat studies in six healthy control subjects, comparing immediate repetition of the scan, repetition of the scan plane scouting, and week-to-week variation in repeated studies. The standard deviation in the four-week protocol of repeated in-vivo measurements of single-kidney renal flow in normal subjects was 59.7 ml/min, corresponding with an average coefficient of variation of 10.55%. Comparison of RBF reproducibility with and without gadolinium contrast showed no significant differences in mean or standard deviation. A breakdown among error components showed corresponding marginal standard deviations (coefficients of variation) 23.8 ml/min (4.21%) for immediate repetition of the breath-held flow scan, 39.13 ml/min (6.90%) for repeated plane scouting, and 40.76 ml/min ( 7.20%) for weekly fluctuations in renal blood flow.
Keywords: quantitative flow, renal blood flow, flow validation, kidney imaging
1. Introduction
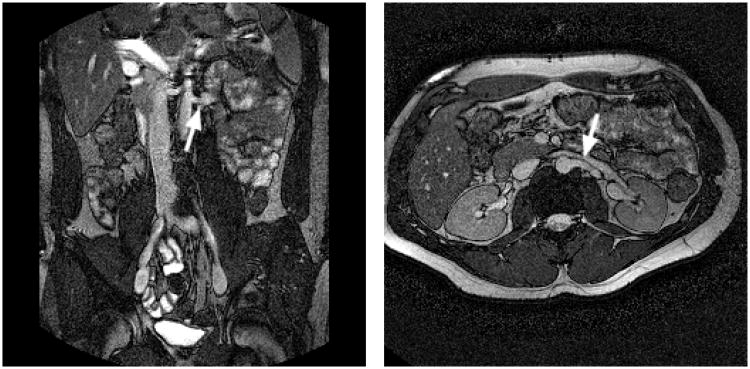
Renal arterial blood flow (RBF) is an important parameter of kidney function, of interest for a range of kidney diseases including renal artery stenosis1, ischemic nephropathy, hypertension, and recently also as early progression marker of polycystic kidney disease (PKD)2. The potential of MRI as a non-invasive method for measuring blood flow in-vivo is well-established3-5. Widespread clinical application has been limited by patient motion during imaging, limitations in signal-to-noise ratio (SNR), and long imaging times. RBF measurement by MRI is a challenging imaging problem. The renal arteries are located at oblique orientation to the aorta, variable among individuals (see Figure 1). Kidneys are subject to cardiac, respiratory, and bowel motion, and relatively common accessory arteries are often small and difficult to identify. Several technological innovations have over the years improved clinical feasibility of phase-contrast imaging by MRI, including oblique slice plane definition, ciné flow techniques6,7 to allow time-resolved imaging, and fast segmented k-space imaging8,9, now allowing high-resolution breath-held imaging. Furthermore, SNR has improved greatly by use of phased-array receiver coil technology, and vector electro-cardiographic techniques10 greatly improved synchronization of the scans with the cardiac cycle. Where just over a decade ago bilateral RBF imaging alone required 45-130 minutes12,18, it currently requires only about 10-15 minutes including flow plane scouting, comfortably allowing inclusion of RBF measurements in 1-hour scan slots. Alternative methods for RBF measurement by MRI are concurrently being explored including quantification of first-pass Gd-contrast perfusion19, but these technologies is still under development.
Figure 1.
Breath-held bFFE scout images, used for determination of the renal artery (RA) flow plane; (a) coronal view visualizing the branch of the left RA from the descending aorta, and its direction relative to the axial plane; (b) axial view showing the same RA and its angle with the coronal plane. The flow plane is defined perpendicular to the RA (see arrows) in both views.
Validation studies for RBF measurement by phase velocity MRI have been reported at various stages of technological maturity11-18,20,21, highlighting the importance of several technical advancements. Generally good correlation was shown of MRI with “gold standard” methods for measurement of total or single-kidney RBF, including para-amino hippurate clearance11,12,14,16,18, Doppler ultrasound flow probe measurements13, or 99mTc-DTPA scintigraphy18. A comprehensive overview, however, of the reliability of current technique for breath-held renal blood flow measurement by MRI, including all above-mentioned technological improvements, is not available in the literature. The importance of good control of respiratory motion was recently underscored by a study17 on normal human subjects using uncompensated free-breathing methods, reporting limited success rate and poor reproducibility with coefficients of variation (CV) of 15-25%. In light of this, despite the fact that breath-held phase velocity RBF imaging is considered a reliable and mature technology by many experts in the field, more comprehensive validation data are required for broad clinical acceptance. Information about reliability and error levels are also critical for successful design and power analysis for use of RBF measurement in clinical investigations of specific renal diseases.
The present study had two specific aims: (1) to determine the accuracy of current technique for breath-hold ciné PC-MRI imaging for renal artery blood flow through controlled phantom studies, and (2) to test and analyze reproducibility limits of these methods in-vivo through analysis of repeat scans on normal volunteers. In this study, RBF imaging was performed in “turn-key” fashion, i.e., using commercially available instrumentation and software for imaging and flow analysis.
2. Materials and Methods
Experimental Design
Flow Phantom MRI Data: Accuracy of MRI Methods for RBF Measurement
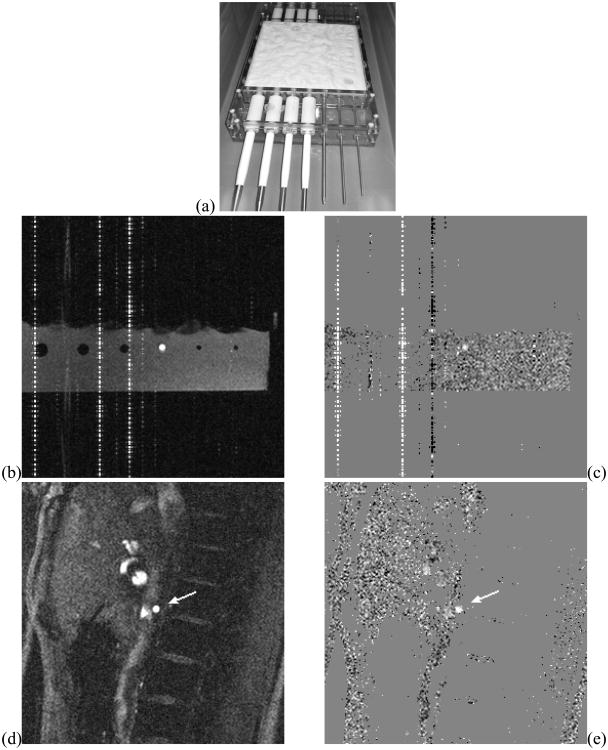
Evaluation of the accuracy of ciné phase velocity mapping was performed using simulation phantoms in computer-controlled flow loops. MRI flow in a flow phantom (Figure 2a) was compared to carefully timed fluid collection for steady flow to evaluate best-case accuracy of the imaging protocol, and to programmed pulsatile flow with a simulated renal arterial flow waveform (see Figure 3) to evaluate more specifically suitability for RBF. The pulsatile-flow study also compared imaging with prospective and retrospective ECG gating. Figures 2b,c show example flow phantom images.
Figure 2.
PVA Flow phantom (a) and example flow-encoded MRI scans of the flow phantom (b: magnitude, c: velocity map), and of a right renal artery (arrow) of a normal volunteer (d: magnitude, e: velocity map). The vertical (phase encoding) line artifacts in the phantom images are associated with fixed-frequency interference of the flow loop electronics systems scanner's RF chain. The positioning of the phantom within the field of view was adjusted to ensure artifact-free imaging at the flow site.
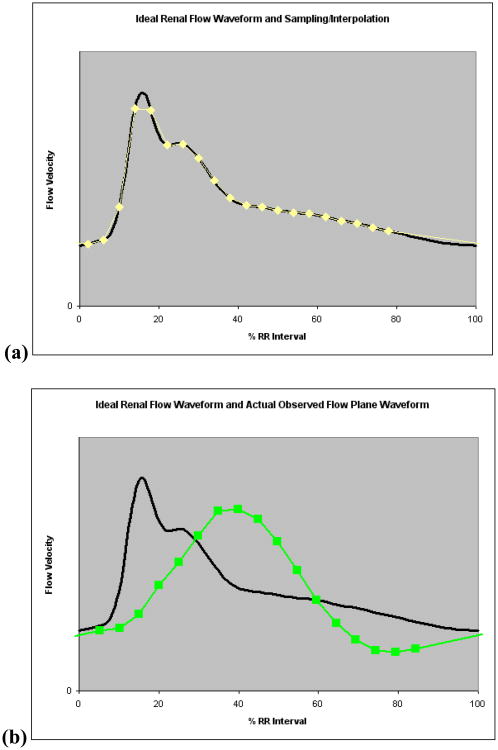
Figure 3.
(a) Renal arterial flow waveform used in pulsatile-flow phantom experiments, and sampling/interpolation of this waveform for prospective gating for a situation with 20 equidistant sampling points spanning 80% of the cardiac cycle; (b) Input renal flow waveform, and sampling points of an actual observed waveform in phantom flow plane (4.76 mm channel) illustrating dampening effects by elastic properties of the flow loop.
Human Subject Data: Modeling of random errors in Renal Blood Flow measurement
Our human subject experiments for this study involved repeated quantitative flow imaging in six normal volunteer subjects (see Figure 3d-e). Each subject underwent an MRI study during four successive weeks, and in each study blood flow in the renal arteries was measured multiple times, with and without repetition of the scouting process to define the flow plane.
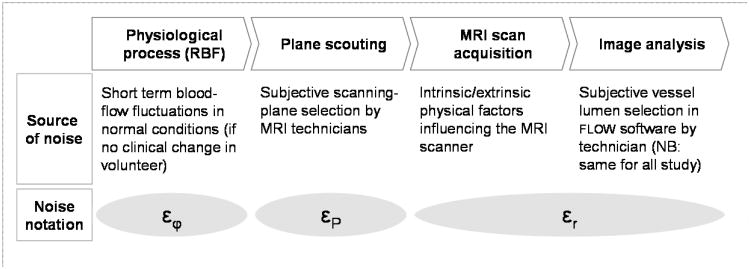
We can model a renal blood flow estimate f̂ as the sum f̂ = f + ε of the true flow f and a random noise term ε. In addition to evaluation of overall short-term reproducibility of RBF, this scan protocol allows analysis of three individual error terms in the measurement: ε = εr+εP +εφ (See Figure 4). In this model εr represents all random effects in the MRI flow scan and image analysis. The plane scouting error εP specifically embodies variations due to the flow plane definition process, and εφ represents “physiological noise”, i.e., normal short-term fluctuations in actual blood flow assuming no clinical changes in renal function. Immediate repetition of the MRI scan at the same plane location allows isolated analysis of εr. Repetition of the scan including the plane scouting process can reveal the spread in (εr + εP). The sequence of weekly repeat MRI studies can provide insight into the composite measurement error ε and allow isolation of physiological fluctuations εφ, although it should be recognized that it may generally not be possible to completely decouple this noise from all measurement errors. Isolated estimates of the standard deviation of each individual error component may be obtained by assumption of statistical independence of the underlying processes.
Figure 4.
Various sources of noise in renal blood flow measurement by MRI, measured and estimated in this study.
Physiological fluctuations εφ may be controlled to some degree by subject compliance with a stricter dietary and fluid intake protocol prior to the scan, but residual noise may ultimately determine limits in the diagnostic value of renal blood flow. The error in definition of the flow plane has historically been considered a limiting factor in reliability of quantitative flow mapping. This was particularly challenging in the days before oblique plane scouting was readily available, but even today the problem of double-oblique plane definition, orthogonal to a curving blood vessel, is still not considered a trivial matter. Quantification of this noise term is of interest to determine if improvements in methods or software for slice plane scouting are still relevant, based on a comparison with other random noise effects (εr), which incorporate all fluctuations associated with an immediately repeated experiment for flow imaging. Such effects include measurement noise and operator interactions in image analysis, but also some physiological terms like differences in breath-hold position, with associated air and blood pressure differentials. Inter-operator variability in the image analysis has also historically been recognized as a possible factor in overall reproducibility, and can be isolated by repeated processing of the same image data. Results of such an analysis have been published previously for a very similar RBF imaging protocol2, reporting excellent intra-observer and inter-observer CV for total renal blood flow of 1.3% and 2.5%, respectively. In this study these effects are modeled as part of the random measurement errors component εr.
The influence of Gd-DTPA contrast on the renal flow measurement was also investigated. The higher signal due to T1 shortening may improve the SNR of the RBF measurement, possibly manifested in a reduction in the standard deviation for immediately repeated RBF measurements. Moreover, injection of a freely filtered agent may have an effect on actual blood flow, resulting in a change in observed mean flow. To investigate these effects, all RBF measurements were performed prior to contrast injection and repeated 10 minutes after injection of contrast.
MRI Methods
All MRI studies were performed on a 1.5T Philips Gyroscan Intera scanner (Philips Medical Systems, Cleveland, OH), software release 8 (phantom data) or 10.3.1 (human volunteer studies), both prior to the incorporation of the Maxwell Correction for concomitant gradient field effects in the application software. In order to minimize gradient nonlinearity effects, the flow plane FOV was always centered at the site of the renal artery, and the flow plane center was in all cases placed at the table position of the isocenter of the magnet.
Renal Artery Scouting
Following a rough scout scan to determine the location and extent of the kidneys and the descending aorta, the location of the renal arteries (RA) was revealed by a breath-held oblique coronal breath-held bFFE scan (TR=3ms, TE=1ms, flip angle 60 degrees, 256×256 reconstruction matrix, see Figure 1a), aligned with the descending aorta. From this scan the angle of the RA's with the horizontal plane was also read. The posterior angulation of the RA's was observed in a subsequent axial scan (see Figure 1b). In sporadic difficult cases, where these views did not provide definitive localizing information, additional scout images are acquired with oblique angiographic views capturing a segment of the RA in the slice plane, using gradient echo or the same bFFE imaging protocols.
Quantitative Flow Imaging
All velocity-encoded images were acquired, unless indicated otherwise, using prospective vector-cardiographic (VCG) gating without view sharing, by a FE-EPI (multi-shot echo-planar) single-slice imaging sequence with 7 lines per segment (i.e. 7 EPI echoes following each RF pulse) , with 12-24 phases across the cardiac cycle, depending on heart rate, with typically 65-85% coverage of the cardiac cycle. Scan parameters: TR=18-27ms (temporal resolution: 2×TR); TE=9-11ms; excitation angle 35°; 192-224 phase encoding views, and 448 (2× over-sampled) readout samples on a 200 mm field of view; NEX=1; VENC=100 cm/s, adjusted if velocity aliasing was observed in the flow maps; 6 mm slice thickness; readout bandwidth: 92 Hz/pixel. Only the standard pre-scan procedures were used for shimming, tuning, and matching. The imaging time was 20 to 30 seconds, depending on heart rate. A four-element body synergy receiver coil was used in all studies. Parallel imaging was not used; the background phase error correction in the application software was turned off for all scans. Figure 2 shows example images of a flow phantom (a,b) and a normal volunteer (c,d). When occasional severe signal loss was observed during systole, this often indicated oblique angle between RA and flow plane, usually remedied by carefully repeating the plane scouting.
Flow Analysis
All obtained sequences and Flow maps were analyzed on a Blade 100 workstation (Sun MicroSystems, Sunnyvale, Ca), following transfer of the DICOM images from the scanner. The FLOW software was used for all flow analyses (Leiden University Medical Center/MEDIS Inc., Leiden, The Netherlands).
Vessel flux values at all time points of the cardiac cycle were calculated by integration of pixel velocities across lumen cross-sections, defined interactively in a semi-automated fashion. The flow per heart cycle was calculated by integration of the flux values over the cardiac cycle using a trapezoid rule (i.e., by linear interpolation between sample points), the RR interval recorded in the DICOM image files, and the image delay times also stored with the image data (see Figure 3b). The blood flow per minute was obtained by multiplication of the stroke volume by the heart rate.
The vessel border was defined manually, drawn on the velocity map images, in one single frame of the sequence (phantom scans) or every fourth frame in the image sequence (human subjects). The FLOW software automatically generates the missing contours for the remaining frames. This segmentation was followed by manual inspection, and if necessary further manual correction. Vessel border definition typically requires 2-5 minutes of operator time per scan. The remainder of the analysis procedure is fully automatic and completes in seconds.
Background subtraction to compensate for offset errors in the velocity map was applied “as needed”, i.e., whenever mean velocity in (static) background regions, sampled once or twice per study, exceeded the standard deviation in the same region. To test this condition, the background region was drawn in the first frame of a sequence in an approximately annular shape, surrounding the RA with a annulus width and distance similar to the RA diameter. If the mean background velocity was significantly non-zero (i.e., exceeded a threshold of 1-2 standard deviations in the distribution within the ROI) the ROI was copied to all frames, and the mean background velocity was subtracted from the vessel velocity.
Flow Loop/Phantom Simulations
The accuracy of flow measurements was studied with vessel simulation phantoms made of Poly-Vinyl Alcohol (PVA)22. A block of solid-gel PVA was constructed by pouring a solution of 30% (weight) of PVA (Sigma Aldrich, Inc., Saint Louis, MO) in water into a Lexan mold (Figure 2a), followed by 4 freeze/thaw cycles (12 hours at -20°C/12 hours at 20°C) to obtain desired firmness. Straight, parallel flow channels, with diameters sampling the range of human RA16, were formed by inserting Lexan rods in the PVA, which were removed after hardening. The phantom used in steady-flow experiments contained six diameters 3.18 mm, 4.76 mm, 6.35 mm, 7.94 mm, 9.53 mm, and 11.1 mm. A second version of the phantom, used for pulsatile-flow studies, added an additional channel with diameter 2.1 mm to simulate smaller accessory renal arteries. A total flow range of 50-1200 ml/min was selected based on values found in literature2,12,14,16,17,18.
One channel of the phantom was connected at a time to a flow loop of stiff mesh-core acrylic hose. A mix of 40% Glycerin and 60% purified water was used as flow media to mimic blood viscosity (≈ 3.5 mPa.s). The PVA phantom was connected distal to a straight tube segment to obtain fully developed flow at the flow plane site.
Steady-flow experiments
For steady-flow experiments the flow loop was driven by an MRI-compatible submersible flow pump (Model 550, Little Giant, New Haven, CT). The flow rate was controlled by an adjustable valve to a desired approximate value, read by a rotameter. True flow rates were determined from 60-second fluid collections, obtained before and after MRI experiments. Collected fluid was weighed and divided by the specific weight of the mixture. A relevant range of flow rates for RA flow was sampled for each vessel diameter (Table I), and measurements for each flow rate were obtained at two flow plane sites (three for the 11.11 mm channel).
Table I.
Flow rates, measured by 60 s fluid collection, for each phantom vessel diameter in MRI experiments for steady flow measurements.
| Diameter (mm) | Flow rates (ml/min) |
|---|---|
| 3.18 | 123.3, 242.1, 378.0, 397.7, 531.2, 764.9 |
| 4.76 | 278.1, 411.7, 510.0, 660.3, 771.4, 864.2 |
| 6.35 | 337.0, 457.9, 654.5, 686.1, 743.9, 869.9 |
| 7.94 | 477.2, 573.1, 691.4, 787.2, 896.5, 979.1 |
| 9.53 | 532.1, 706.9, 795.9, 808.2, 964.4, 1142.2 |
| 11.1 | 694.4, 796.64, 851.56, 919.18, 1010.44, 1189.41 |
Pulsatile-Flow experiments
The pulsatile flow system was driven by a MRI-compatible computer-controlled flow pump (CardioFlow 1000 MR; Shelley, Toronto, Canada), specified stable within 0.1 ml/s 23. An input waveform was constructed from time- and amplitude-scaled averaging of flow curves from MRI renal arterial blood flow studies on 10 normal and 10 PKD patient subjects (see Figure 3a). This waveform corresponds well with normal RBF waveforms in the literature8,12,16 featuring forward-only flow with a narrow fading systolic peak, followed by a smaller second velocity peak or plateau, then decreasing diastolic flow. The input flow waveform was scaled by the pump controller to the desired flow rate. Despite best efforts to minimize the flow loop length and use of stiff materials, the flow loop system response introduced some unavoidable losses at higher frequencies, resulting in delay and smoothing of the input waveform at the observation sites in the phantom (an example is shown in Figure 3b). This smoothing did not affect total actual flow per cycle/minute. A synchronized trigger pulse signal was generated by the pump's computer to simulate ECG-gating at a heart rate of 60 bpm. Table II lists the pulsatile flow rates sampled for each diameter. All pulsatile-flow measurements were performed at least twice, once using prospective gating, and once more using retrospective gating. For most channel diameters more than one measurement was obtained for each flow rate. In some occasions measurements which upon review were found contaminated by RF interference artifacts (see Figure 2b,c) near the flow channel were excluded. The second column of Table V shows the total number of flow scans analyzed for each channel.
Table II.
Programmed flow rates for each phantom vessel diameter in flow loop validation experiments of simulated renal arterial blood flow.
| Diameter (mm) | Flow rates (ml/min) |
|---|---|
| 2.1 | 50, 100, 200, 300 |
| 3.18 | 50, 100, 200, 300 |
| 4.76 | 200, 300, 400, 500, 600 |
| 6.35 | 200, 300, 400, 500, 600, 800 |
| 7.94 | 300, 400, 500, 600, 700, 800, 1000 |
| 9.53 | 200, 300, 400, 500, 600, 700, 800, 900, 1000 |
| 11.1 | 400, 600, 800, 1000, 1200 |
Table V.
Pulsatile Flow: comparison of MRI and programmed flow rates for phantom experiments (prospective gating). Concordance Correlation Coefficients are listed as observed for each vessel diameter individually, along with 95% Bland-Altman limits of agreement of absolute measurements and relative ratios.
| Diam (mm) | N | CCC | mean diff (ml/min) | SD Diff (ml/min) | 95% lim. (ml/min) | mean ratio | SD ratio | 95% lim. ratio |
|---|---|---|---|---|---|---|---|---|
| 2.1 | 7 | 0.943 | -24.03 | 14.33 | (-52.1,4.1) | 0.84 | 0.0059 | (0.83,0.85) |
| 3.18 | 19 | 0.995 | -5.52 | 5.89 | -(17.1,6.0) | 0.96 | 0.042 | (0.88,1.04) |
| 4.76 | 11 | 0.969 | 28.61 | 21.23 | (-13.0,70.2) | 1.09 | 0.052 | (0.98,1.18) |
| 6.35 | 14 | 0.999 | 0.91 | 4.79 | (-8.5,10.3) | 1.00 | 0.022 | (0.96,1.05) |
| 7.94 | 8 | 0.982 | -7.68 | 22.05 | (-50.9,35.5) | 0.99 | 0.027 | (0.94,1.04) |
| 9.53 | 16 | 0.995 | -25.71 | 14.05 | (-53.3,1.8) | 0.95 | 0.026 | (0.90,1.00) |
| 11.1 | 4 | 0.992 | -27.05 | 30.09 | (-86.0,31.9) | 0.97 | 0.028 | (0.92,1.03) |
| ALL | 79 | 0.996 | -6.66 | 22.60 | (-51.0,37.6) | 0.97 | 0.067 | (0.84,1.10) |
Normal Volunteer Studies. Six healthy adult subjects, (4 male, 2 female, ages 24-39) without known current or past renal disease, current medications, or other illnesses, were recruited, following informed consent per IRB-approved and HIPAA-compliant protocol. Normal kidney function was confirmed before every MRI exam by serum creatinine < 1.1 mg/dl and normal urinalysis. Further eligibility criteria included the absence of common MR imaging contra-indications (pacemaker, metal implants, claustrophobia, pregnancy). Each volunteer underwent four one-hour MRI scans at one-week intervals. Scans were scheduled in the mornings following 12-hour fast and 24-hour alcohol abstinence. Prior to MRI, vital signs were recorded, pregnancy and kidney function tests were performed, and an IV catheter was inserted in preparation for contrast agent administration. Blood pressure was recorded at baseline upon enrollment and before and after each MRI exam to screen out any events affecting kidney function.
Subjects were screened for MRI safety, instructed on breath-holding, and prepared with ECG electrodes and respiration sensors. Following plane scouting, left and right renal flow scans were acquired, each repeated immediately. Either the left or right RBF scan was repeated following re-definition of flow plane, again followed by immediate repetition. This scan repetition protocol was alternated between the left and right side from week to week. Next, 0.1 mmol/kg of a Gadolinium DTPA agent (Omniscan, GE Healthcare, Milwaukee, WI) was administered intravenously by power injector at a rate of 1 ml/s. Ten minutes post-contrast the entire quantitative flow imaging protocol was repeated, including flow plane scouting.
Statistical Methods
Flow Phantom Data
Fluid displacement volumes (steady flow) and programmed flow rates (pulsatile flow) were considered “gold standard” in evaluation of accuracy of calculated MRI flow rates. Bland-Altman analysis25 was used to assess the agreement between fluid displacement and MRI flow measurements, further evaluated by computing Lin's concordance correlation coefficient (CCC)26 which measures the variation of two or more fixed sets of measurements from the “concordance line” of identity. The Bradley–Blackwood method27 was used for testing the equivalence of sets of paired measurements to compare flow from the same data with and without background correction in steady-flow phantom MRI data, and to compare the same flow observed using prospective and retrospective ECG gating in pulsatile-flow phantom MRI scans.
In-vivo normal human subject data
Average RBF for each session was correlated with vital systolic and diastolic blood pressure, heart rate, and serum creatinine measurements links after individual baseline correction of all these variables.
No suitable “gold standard” technique exists for in-vivo testing of renal blood flow. Therefore, reliability was evaluated by analysis of reproducibility in repeated measurements. The subject population of this study, which was not designed as a clinical study, was too small for a linear mixed model with random subjects to fully differentiate the variance within the data. We used the well-known premise from probability theory29 that the sum of two normally distributed, independent, random variables with standard deviations σ1 and σ2, is also normally distributed with standard deviation , to further characterize the individual error components. The unknown truth values were removed from repeated measurements of the same true flow by analyzing the distribution of pair-wise differences. The standard deviation in single measurements of the same flow is estimated as the standard deviation in the difference of two measurements, divided by √2. It appears reasonable to assume independence (orthogonality) of random noise, repeated flow plane scouting, and fluctuations in actual flow, as three individual error components. The spread in the isolated effect of repeated plane scouting is thus estimated as , where σε is the standard deviation of flow estimates, repeated including plane scouting. Similarly, the standard deviation σφ of physiological fluctuation is calculated as where σE is the spread in averaged measurements (with composite error εE) analyzed from pair-wise differences between four weekly values for each kidney. These values are computed for each week from a total of four averaged RBF measurements, i.e., two at each of two flow plane scouting locations.
3. Results
Steady Flow Phantom Studies
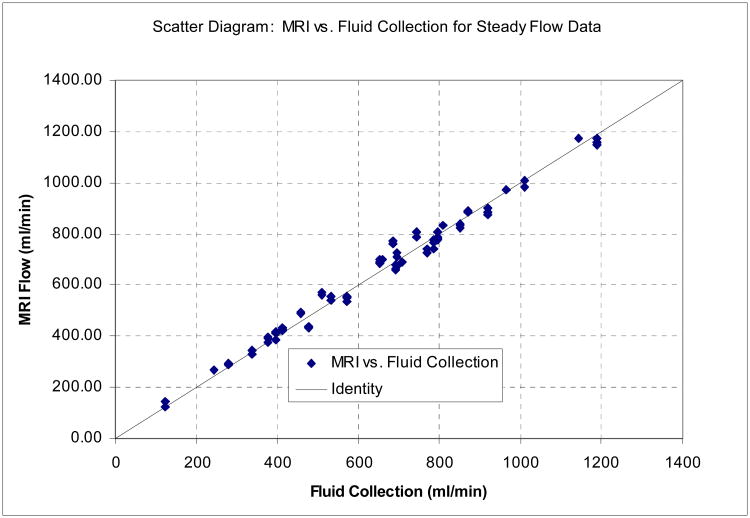
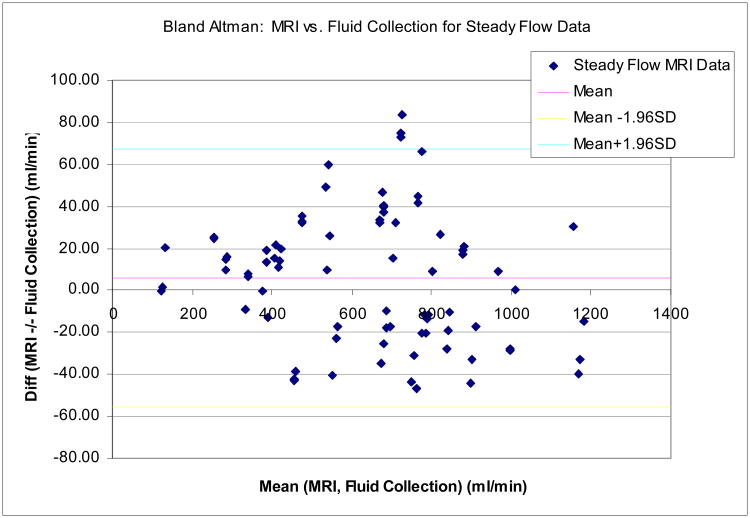
Figure 5 shows a scatter diagram (a) and a Bland-Altman plot (b) comparing flow rates measured by MRI with true flow for the steady-flow data, combined over all flow rates and vessel diameters. Table III summarizes the Concordance Correlation Coefficients and the Bland-Altman analysis, for all six vessel diameters individually and in combination. Separated by vessel diameter CCC values ranged from 0.966 (6.35mm) to 0.994 (3.175mm and 9.525mm), indicating almost uniformly excellent accuracy across all vessel diameters. The standard deviation of the difference between MRI flow and fluid collection was 31.27 ml/min, averaged across all flow rates and channel diameters listed in Table I.
Figure 5.
(a)Results for phantom experiments with steady flow: Scatter diagram comparing MRI flow measurements with 60-second fluid collection. The reference line shows identity. Data for all flow channel diameters were combined in this plot (N=80). The Concordance Correlation Coefficient (CCC) for these data is 0.992. (b) Results for phantom experiments with steady flow: Bland-Altman plot showing difference vs. average of MRI flow measurements and 60-second fluid collection, with 95% limits of agreement. Data for all flow channels were combined.
Table III.
Steady Flow: Concordance Correlation Coefficients (CCC) and Bland-Altman 95% confidence intervals for phantom flow measurements for individual and combined channel diameters.
| Diam (mm) | N | CCC | mean diff (ml/min) | SD diff (ml/min) | 95% limits (ml/min) | mean ratio | SD ratio | 95% limits ratio |
|---|---|---|---|---|---|---|---|---|
| 3.18 | 13 | 0.994 | 13.7 | 12.65 | (-11.08,38.48) | 1.05 | 0.054 | (0.94,1.15) |
| 4.76 | 13 | 0.979 | 18.27 | 29.40 | (-39.35,75.90) | 1.04 | 0.047 | (0.95,1.13) |
| 6.35 | 18 | 0.966 | 36.71 | 25.31 | (-12.90,86.32) | 1.06 | 0.038 | (0.98,1.13) |
| 7.94 | 12 | 0.979 | -29.45 | 13.04 | (-55.01,-3.88) | 0.95 | 0.027 | (0.89,1.00) |
| 9.53 | 6 | 0.994 | 6.27 | 21.31 | (-35.50,48.04) | 1.01 | 0.025 | (0.96,1.06) |
| 11.1 | 18 | 0.983 | -15.64 | 19.88 | (-54,60,23.32) | 0.98 | 0.023 | (0.96,1.03) |
| ALL | 80 | 0.992 | 5.99 | 31.27 | (-55.31,67.28) | 1.018 | 0.054 | (0.91,1.12) |
A Bradley–Blackwood test yielded a significance of p=0.28 for comparative analysis with and without background correction, indicating that for these data background correction neither improved nor degraded these flow measurements.
Pulsatile Flow Phantom Studies
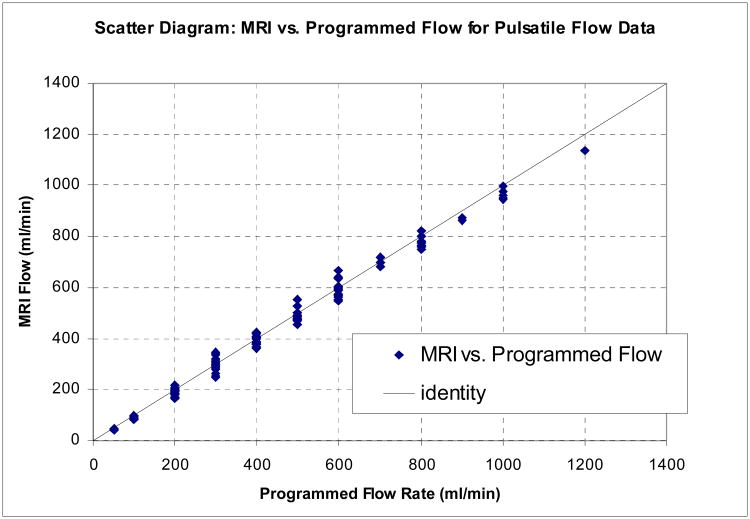
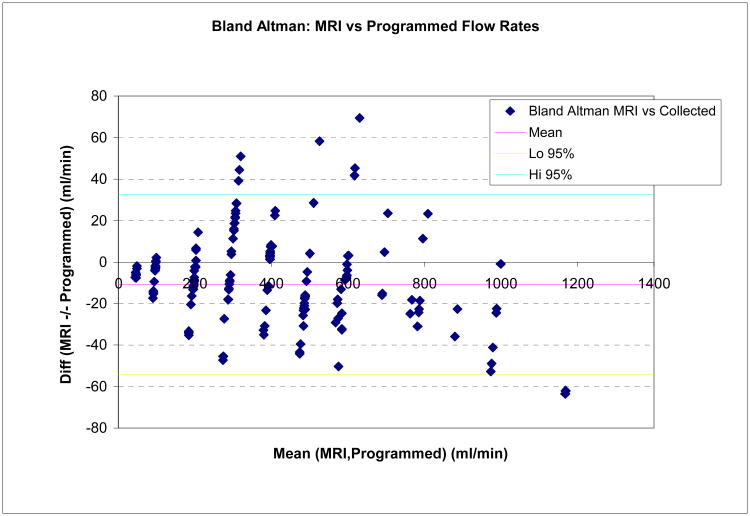
CCC values and Bland-Altman analysis of pulsatile flow experiments with simulated renal flow input waveform are summarized in Tables IV and V, showing again excellent agreement between MRI and gold standard flow. Table IV compares CCC and 95% confidence limits of absolute and relative differences in MRI flow experiments with prospective and retrospective gating with otherwise identical scan parameters, pooling data from all vessel diameters and flow rates. The two gating methods gave very similar results, further confirmed by a Bradley-Blackwood test (p=0.38) which failed to indicate significant differences between these methods. Figure 6 shows a scatter diagram (a) and a Bland-Altman plot (b) of MRI vs. true flow for the pulsatile flow phantom data combined for all diameters.
Table IV. Pulsatile Flow: Concordance Correlation Coefficients and Bland-Altman Analysis for Phantom Experiments: Programmed Volume Pump vs. MRI Flow, comparing prospective and retrospective gating (all diameters combined).
| Gating | N | CCC | mean diff (ml/min) | SD Diff (ml/min) | 95% lim. (ml/min) | mean ratio | SD ratio | 95% lim. ratio |
|---|---|---|---|---|---|---|---|---|
| PROSP | 79 | 0.996 | -6.66 | 22.60 | (-51.0,37.6) | 0.97 | 0.067 | (0.84,1.10) |
| RETRO | 78 | 0.995 | -15.22 | 20.91 | (-56.2,25.8) | 0.95 | 0.059 | (0.84,1.07) |
| COMB. | 157 | 0.995 | -10.91 | 22.12 | (-54.3,32.5) | 0.97 | 0.064 | (0.84,1.09) |
Figure 6.
(a) Scatter Diagram for flow phantom MRI measurements with pulsatile flow: Programmed flow (true values) and MRI flow. Accumulated results are shown for all vessel diameters, flow rates, and prospective /retrospective gating methods. (b) Bland-Altman diagram showing difference versus average of programmed (“true”) and MRI flow, with 95% limits of agreement (All diameters, prospective /retrospective gating methods, and flow rates combined).
Table V shows the CCC and Bland-Altman confidence intervals each for the 7 vessel diameters individually, showing excellent correlation and absence of absolute bias for all diameters. For the smallest diameter (2.1 mm) we observed slight underestimation of the MRI/true flow ratio.
Normal Volunteer Studies
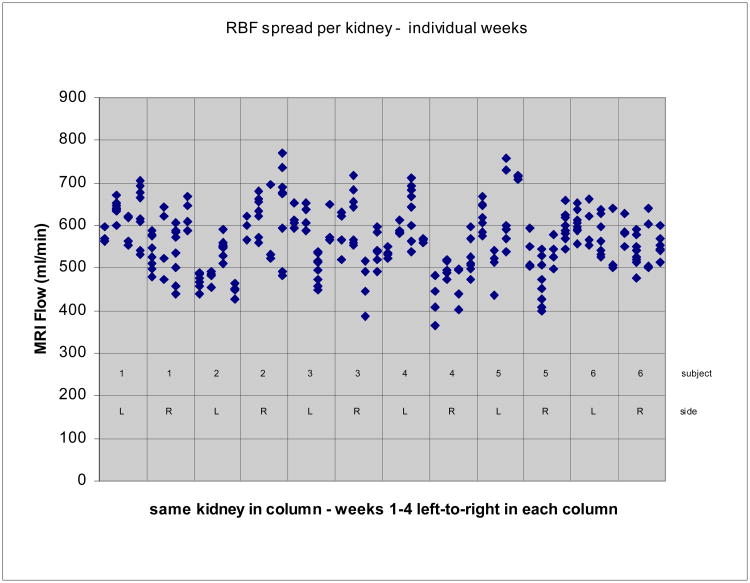
A total of 284 quantitative flow scans were acquired on six normal volunteer subjects over a five-week period. Four scans were not acquired due to scan protocol mistakes. [(6 subjects) × (4 weeks) × (pre+post) × (left+right) × (2 immediate repeats) × (50% rescout =1.5) − (4 missing data points) = 288 − 4 = 284 scans]. Eight further scans were discarded due to poor image quality, yielding a success rate of 97%. No subjects had accessory renal arteries. Single-kidney RBF measurements ranged from 365.8 to 771.1 ml/min; averaged flow measurements for the same kidney ranged from 477.6 to 616.8 ml/min, and estimated RA diameters 4.23 to 5.39 mm. The estimated over-all standard deviation in single measurements of single-kidney RBF was 59.77 ml/min (see Figure 7).
Figure 7.
Variability in RBF measurements for each kidney across the four weekly scans. All measurements in each of four weekly scans are shown together. Data from consecutive weeks are shown left-to-right for one kidney in each of the columns.
Total (average, bilateral) RBF ranged between 957-1311 ml/min, with mean +/- standard deviation 1130 +/- 88 ml/min, with mean CV within each subject of 7.7%. Recorded heart rates ranged 42-89/min, with mean +/- standard deviation 63 +/- 11.7 ml/min and average weekly within-subject CV of 8.8%, and no significant correlation was observed with RBF (r=0.042, p=0.868, N=22, [6 subjects × 4 weeks − 2 missing values]). Serum creatinine levels ranged 0.7-1.2 mg/dl, with mean +/- standard deviation 0.93+/- 0.18 mg/dl with mean within-subject CV of 6.3%, and no significant correlation with RBF (r=-0.152, p=0.548, N=22). systolic (diastolic) blood pressures ranged from 98 (46) to 144 (86) mmHg, with mean +/- standard deviation 124.6 (70.7) +/- 12.2 (7.7) mmHg. Only diastolic blood pressure was significantly (Pearson) correlated to RBF (r=0.604, p=003, N=22), but adjustment for this effect was not found to improve measured variability and is not represented in further results.
Pre- and post-contrast RBF flow measurements within the same MRI study were nearly identical, with mean difference (+/- stderr) of 1.71 ml/min +/- 12.3 ml/min (N=40) [(6 subjects) × (4 weeks) × (L+R) − (8 incomplete sets)]. The estimated standard deviations (+/- stderr) in the difference between immediately repeated measurements (N=40) were 30.84 +/- 3.45 ml/min for pre-contrast, and 30.39 +/- 3.40 ml/min post-contrast RBF, indicating equivalence of methods.
Table VI summarizes the over-all standard deviation in the measurements and the analysis of pair-wise differences between repeat flow measurements in the same kidney. This analysis isolates spread in the data due to random measurement noise (immediate repetition), flow plane scouting of the renal arteries, and week-to-week variations in RBF, by estimation of the associated individual standard deviations. The table also lists the average CV, based on mean flow observed in all subjects. The sample sizes were different for the various components calculations: mean over-all spread per kidney: N = (12 kidneys) × (2 imm. repeats × (pre+post) × 4 weeks =16 data points per kidney) − 6 missing points = 186; weekly spread: N = 12 kidneys × 6 pairwise differences between 4 weekly measurements = 72; immediate repetitions: N = 288/2 total repeat pairs − 7 missing data points = 137; repetition w/plane scouting: N = 12 kidneys × 4 weeks × (2×2) pairwise differences between immediate repeats − 8 missing points = 192–8 = 184.
Table VI.
Standard deviations and coefficients of variation of error components, estimated from pair-wise differences in repeated RBF measurements of the same kidney in healthy volunteer subjects (pooled pre & post-contrast data).
| Random Variable | Standard deviation (dml/min) | CV (%) | |
|---|---|---|---|
| ε: mean variability in RBF per kidney (N=186) | σ = 59.77 | 10.55 | |
| εE: weekly variability in 4-way averaged RBF(see text, N=72) | σE = 50.69 | 8.95 | |
| εr: immediate repetition effect (N=137) | σr = 23.84 | 4.21 | |
| repetition including plane scouting (N=184) |
|
8.09 | |
| εP (plane scouting effect only, calculated) | σP = 39.12 | 6.90 | |
| εφ (weekly fluctuation effect only, calculated) | σφ = 40.77 | 7.20 |
Figure 7 shows the spread in all RBF measurements within and across the four weekly scans for each kidney in all six subjects.
4. Discussion
The results of this study show that current breath-held MRI technology for measuring renal blood flow, using 200 mm FOV, 192 or more phase encodings, and 12 or more phases per cardiac cycle, is quite accurate in phantom experiments, and had good reproducibility under repeated imaging in normal adults.
Phantom experiments with steady flow showed excellent agreement with gold-standard fluid displacement measurements. These results show that fast MRI velocity-encoded imaging sequences are capable of accurately quantifying flow within reasonable breath-held imaging times. Experiments with pulsatile flow simulating RBF wave forms confirm very similar accuracy estimates, indicating that breath-held MRI has adequate temporal resolution for measuring renal flow. These experiments also reveal that current technique may be less suitable for blood vessel diameters less than 3mm, where we observed underestimation of flow. This observation, likely associated with increasing phase averaging/partial volume errors at the vessel boundaries, was only apparent in our data in the measurements at 2.1 mm diameter. Phantom measurements in vessels 3 mm or larger reliably measured flow within 10-13% of true values or better, and with a standard deviation of about 22.6 ml/min in differences from truth. These observations reflect the whole body FOV constraints for RBF imaging, as well as the number of phase encodings and time points that can be sampled within a breath-hold interval.
Patient safety with gadolinium contrast agents have been the subject of considerable discussion in recent years, especially for imaging of severe renal disease30- 32. Gadolinium agents are linked to a rare but serious condition now known as Nephrogenic Systemic Fibrosis (NSF). This discovery is resulting in ongoing review of indications and dosage for gadolinium contrast. Our experiments in normal subjects were conducted prior to this recent awareness. No adverse events were reported in this study, and none of the subjects were in categories currently considered at risk for this complication. Moreover, our studies indicate that reproducibility of RBF in healthy subjects was equivalent in MRI with and without contrast, suggesting that use of Gd-DTPA contrast is not of critical importance for reliable quantitative flow measurement in renal arteries. The similarity of reproducibility statistics for imaging with and without contrast also suggests that occasionally observed signal loss in non-contrast imaging usually does not have a detrimental effect on non-contrast quantitative flow measurement.
Analysis of repeated scans on healthy volunteers shows good immediate reproducibility, with estimated standard deviation σr=23.84 ml/min, and a CV of 4.21%. This indicates that the breath-held imaging protocol meets with good compliance in subjects who are not severely ill, and the impact of pressure differences etc. on RBF in repeat breath-hold scans is limited. An isolated estimate of repeat scan plane scouting error, a technologist skill factor, is slightly higher at σP=39.12 ml/min (CV=6.9%), approximately of the same magnitude as the estimated weekly spread in actual RBF (σφ=40.77 ml/min, CV=7.20%). Let us here cautiously interpret the estimated weekly spread in the 4-week repeat RBF scan protocol in our subjects to represent the actual average normal variation in true RBF over such a period. These results, compared with over-all variability in single measurements of single-kidney flow with estimated average standard deviation of σ=59.77 ml/min (CV=10.55%), suggest that further improvement of plane scouting technique may possibly reduce over-all standard deviation by at most approximately 15 ml/min, were the re-scouting error with spread σr=39.12 ml/min to be eliminated completely: σ=√(59.772-39.122)=45.19 ml/min. This corresponds with a 25% reduction of the over-all CV from 10.55% to approximately 8% of the mean RBF. Expanding on this analysis of error factors, improving the measurement by averaging a large number of immediately repeated breath-held RBF scans at the same scouting location may theoretically be expected to result in a modest reduction of about 5ml/min in σ: √(59.772-23.842)=54.80 ml/min, with a corresponding reduction of the over-all CV to about 9.7% of mean RBF.
The large contribution of week-to-week variability in renal blood flow measurement is not completely surprising. In healthy controls, day-to-day variability in renal function measured by creatinine or iothalamate clearance reaches 10-15%33, and is driven primarily by changes in renal blood flow. The sources contributing to this variability are derived primarily from variation in dietary solute intake including sodium, potassium and protein. The studies performed here were done following a 12-hour fast but without a rigorous “prescribed diet”. This may account for much of the week-to-week variability.
This study is inherently limited in the sense that it can only present a snapshot of current technology, while imaging technology is still improving at a reasonably rapid pace. In addition, the subject population in this study is small and consists of only healthy subjects without known renal disease. Therefore accuracy and in-vivo reproducibility may be somewhat worse in renal patients, who may have narrowed vessels and/or compromised flow rates. Nevertheless, the study presents valuable and relatively comprehensive benchmarking results for current RBF measurement technology. The data presented here should help facilitate effective design of clinical studies and imaging protocols for further validation and use of the RBF measurement for specific clinical applications. In general our data suggest that within reasonable limitations breath-held RBF measurement by MRI may be considered a viable and stable technology with current technique. In comparison, a study by Bax et al.17, observed RBF in volunteers and patients with free-breathing MRI, reported substantially lower success rate (78-85%) and greater variability (CV 17% for immediate repetition, 23% with repeated scouting). The hybrid FE/EPI segmented sequence used in this work is fast and therefore well-suited for breath-held imaging with good temporal resolution, but may be more sensitive to shimming or flow artifacts than segmented gradient echo methods in highly turbulent flow as may be encountered near stenosis. Measurement of stenotic flow may be most reliable safely distal to the stenosis, if this is an option. Overall, breath-held ciné imaging appears to be the method of choice for RBF measurement by current MRI technology.
5. Conclusions
Current breath-held MRI technology for renal arterial blood flow measurement was validated by phantom flow studies and repeat MRI studies of normal volunteer subjects. Good accuracy was shown for controlled blood flow measurement in vessels with diameters of 3 mm and greater. Reproducibility of blood flow in adult healthy volunteer subjects was found good. Gadolinium contrast was found not to have significant influence on the renal blood flow measurements. Retrospective and prospective ECG gating showed equivalent results in pulsatile phantom studies. Factors related to technical and operator skills in the imaging process were found to have a similar contribution to the over-all variability in repeated renal flow measurements as the effect of week-to-week variations. These findings suggest that any further maturation of imaging technology and operator skills can decrease the variability in measurements by approximately 25%, with the remaining spread of approximately 8% of mean RBF predominantly due to physiological sources.
Acknowledgments
This work was supported in part by grants UO1-DK56956 and MO1-RR00039 from the NIH. We thank Dr. Gladys Hirschman of NIH/NIDDK who championed support for this study, and Rob van der Geest of the Leiden University Medical Center for his continued support with the FLOW software. We thank the manuscript reviewers for their important suggestions and careful critique of the paper.
References
- 1.Schoenberg SO, Knopp MV, Bock M, Kallinowski F, Just A, Essig M, Hawighorst H, Schad L, van Kaick G. Renal Artery Stenosis: Grading of Hemodynamic Changes with Cine Phase-Contrast MR Blood Flow Measurements. Radiology. 1997;203:45–53. doi: 10.1148/radiology.203.1.9122415. [DOI] [PubMed] [Google Scholar]
- 2.King BF, Torres VE, Brummer ME, Chapman AB, Bae KT, Glockner JF, Arya K, Felmlee JP, Grantham JJ, Guay-Woodford LM, Bennett WM, Klahr S, Hirschman GH, Kimmel PL, Thompson PA, Miller JP, the Consortium for Radiologic Imaging Studies of Polycystic Kidney Disease (CRISP) Magnetic Resonance Measurements of Renal Blood Flow as a Marker of Disease Severity in Autosomal Dominant Polycystic Kidney Disease. Kidney Int. 2003;64(6):2214–21. doi: 10.1046/j.1523-1755.2003.00326.x. [DOI] [PubMed] [Google Scholar]
- 3.Van Dijk P. Direct cardiac NMR imaging of heart wall and blood flow velocity. J Comput Assist Tomogr. 1984;8(3):429–36. doi: 10.1097/00004728-198406000-00012. [DOI] [PubMed] [Google Scholar]
- 4.Bryant DJ, Payne JA, Firmin DN, Longmore DB. Measurement of Flow with NMR Imaging Using a Gradient Pulse and Phase Difference Technique. J Comput Assist Tomogr. 1984;8(4):588–593. doi: 10.1097/00004728-198408000-00002. [DOI] [PubMed] [Google Scholar]
- 5.Axel L. Blood Flow Effects in Magnetic Resonance Imaging. Am J Roentgenol. 1984;143:1157–1166. doi: 10.2214/ajr.143.6.1157. [DOI] [PubMed] [Google Scholar]
- 6.Pelc NJ, Shimakawa A, Glover G. Phase Contrast Cine MRI. Magn Reson Med. 1989;1:101. [Google Scholar]
- 7.Fredrickson JO, Pelc NJ. Time-resolved MR imaging by automatic data segmentation. J Magn Reson Imaging. 1994;4(2):189–96. doi: 10.1002/jmri.1880040217. [DOI] [PubMed] [Google Scholar]
- 8.Thomsen C, Cortsen M, Söndergaard L, Henriksen O, Stahlberg F. A Segmented K-Space Velocity Mapping Protocol for Quantification of Renal Arterial Blood Flow During Breath-Holding. J Magn Reson Imaging. 1995;4:393–401. doi: 10.1002/jmri.1880050405. [DOI] [PubMed] [Google Scholar]
- 9.Bock M, Schoenberg SO, Schad LR, Knopp MV, Essig M, van Kaick G. Interleaved gradient echo planar (IGEPI) and phase contrast CINE-PC flow measurements in the renal artery. J Magn Reson Imaging. 1998 Jul-Aug;8(4):889–95. doi: 10.1002/jmri.1880080419. [DOI] [PubMed] [Google Scholar]
- 10.Fischer SE, Wickline SA, Lorenz CH. Novel real-time R-wave detection algorithm based on the vectorcardiogram for accurate gated magnetic resonance acquisitions. Magn Reson Med. 1999;42(2):361–70. doi: 10.1002/(sici)1522-2594(199908)42:2<361::aid-mrm18>3.0.co;2-9. [DOI] [PubMed] [Google Scholar]
- 11.Sommer G, Noorbehesht B, Pelc N, Jamison R, Pinevich AJ, Newton L, Myers B. Normal Renal Blood Flow Measurement Using Phase-Contrast Cine Magnetic Resonance Imaging. Invest Radiol. 1992;27:465–470. doi: 10.1097/00004424-199206000-00012. [DOI] [PubMed] [Google Scholar]
- 12.Lundin B, Cooper TG, Meyer RA, Potchen EJ. Measurement of Total and Unilateral Renal Blood Flow by Oblique-Angle Velocity Encoded 2D-Cine Magnetic Resonance Angiography. Magn Reson Imaging. 1993;11:51–59. doi: 10.1016/0730-725x(93)90411-6. [DOI] [PubMed] [Google Scholar]
- 13.Pelc LR, Pelc NJ, Rayhill SC, Castro LJ, Glover GH, Herfkens RJ, Miller DC, Jeffrey RB. Arterial and Venous Blood Flow: Noninvasive Quantitation with MR Imaging. Radiology. 1992;185:809–812. doi: 10.1148/radiology.185.3.1438767. [DOI] [PubMed] [Google Scholar]
- 14.Wolf RL, King BF, Torres VE, Wilson DM, Ehman RL. Measurement of Renal Artery Blood Flow: Cine Phase Contrast MR Imaging vs Clearance of p-Aminohippurate. Am J Roentgenol. 1993;161:995–1002. doi: 10.2214/ajr.161.5.8273644. [DOI] [PubMed] [Google Scholar]
- 15.Wolf RL, Ehman RL, Riederer SJ, Rossman PJ. Analysis of Systematic and Random Error in MR Volumetric Flow Measurements. Magn Res Med. 1993;30:82–91. doi: 10.1002/mrm.1910300113. [DOI] [PubMed] [Google Scholar]
- 16.Debatin JF, Ting RH, Wegmüller H, Sommer FG, Fredrickson JO, Brosnan TJ, Bowman BS, Myers BD, Herfkens RJ, Pelc NJ. Renal Artery Blood Flow: Quantitation with Phase-Contrast MR Imaging with and without Breath Holding. Radiology. 1994;190(2):371–378. doi: 10.1148/radiology.190.2.8284383. [DOI] [PubMed] [Google Scholar]
- 17.Bax L, Bakker CJG, Klein WM, Blanken N, Beutler JJ, Mali WPTRM. Renal Blood Flow Measurements with Use of PhaseContrast Magnetic Resonance Imaging: Normal Values and Reproducibility. J Vasc Interv Radiol. 2005;16:807–814. doi: 10.1097/01.RVI.0000161144.98350.28. [DOI] [PubMed] [Google Scholar]
- 18.Cortsen M, Petersen LJ, Ståhlberg F, Thomsen C, Søndergaard L, Petersen JR, Ladefoged SD, Henriksen O. MR Velocity Mapping Measurement of Renal Artery Blood Flow in Patients with Impaired Kidney Function. Acta Radiologica. 1996;37(1):79–84. doi: 10.1177/02841851960371P116. [DOI] [PubMed] [Google Scholar]
- 19.Martin DR, Sharma P, Salman K, Jones RA, Grattan-Smith JD, Mao H, Lauenstein TC, Burrow BK, Tudorascu DL, Votaw JR. Individual kidney blood flow measured with contrast-enhanced first-pass perfusion MR imaging. Radiology. 2008 Jan;246(1):241–8. doi: 10.1148/radiol.2461062129. [DOI] [PubMed] [Google Scholar]
- 20.Schoenberg SO, Just A, Bock M, Knopp MV, Persson PB, Kirchheim HR. Noninvasive analysis of renal artery blood flow dynamics with MR cine phase-contrast flow measurements. American J Physiol. 1997;272:H2477–H2484. doi: 10.1152/ajpheart.1997.272.5.H2477. [DOI] [PubMed] [Google Scholar]
- 21.de Haan MW, Kouwenhoven M, Kessels AGH, van Engelshoven JMA. Renal Artery Blood Flow: Quantification with breath-hold or respiratory triggered phase-contrast MR imaging. European Radiology. 2000;10:1133–1137. doi: 10.1007/s003300000362. [DOI] [PubMed] [Google Scholar]
- 22.Chu KC, Rutt BK. Polyvinyl Alcohol Cryogel: An Ideal Phantom Material for MR Studies of Arterial Flow and Elasticity. Magn Reson Med. 1997;37:314–319. doi: 10.1002/mrm.1910370230. [DOI] [PubMed] [Google Scholar]
- 23.Holdsworth DW, Rickey DW, Drangova M, Miller DJ, Fenster A. Computer-controlled positive displacement pump for physiological flow simulation. Med Biol Eng & Comput. 1991;29:565–570. doi: 10.1007/BF02446086. [DOI] [PubMed] [Google Scholar]
- 24.Hackstein N, Heckrodt J, Rau WS. Measurement of Single-Kidney Glomerular Filtration Rate Using a Contrast-Enhanced Dynamic Gradient Echo Sequence and the Rutland-Patlak Plot Technique. J Magn Reson Imaging. 2003;18:714–725. doi: 10.1002/jmri.10410. [DOI] [PubMed] [Google Scholar]
- 25.Bland JM, Altman DG. Measuring Agreement in Method Comparison Studies. Statistical Methods in Medical Research. 1999;8:135–160. doi: 10.1177/096228029900800204. [DOI] [PubMed] [Google Scholar]
- 26.Lin L. A concordance correlation coefficient to evaluate reproducibility. Biometrics. 1989;45:255–268. [PubMed] [Google Scholar]
- 27.Bradley EL, Blackwood LG. Comparing paired data : A simultaneous test of means and variances. The American Statistician. 1989;43:234–235. [Google Scholar]
- 28.Borror CM, Montgomery DC, Runger GC. Confidence intervals for variances components from gauge capability studies. Quality and Reliability Engineering International. 1997;13:361–369. [Google Scholar]
- 29.Papoulis A. Probability, Random Variables, and Stochastic Processes. 2nd. McGraw Hill; New York NY: 1984. [Google Scholar]
- 30.Cowper SE, Robin HS, Steinberg SM, Su LD, Gupta S, LeBoit PE. Scleromyxoedema-like cutaneous diseases in renal-dialysis patients. Lancet. 2000;356(9234):1000–1. doi: 10.1016/S0140-6736(00)02694-5. [DOI] [PubMed] [Google Scholar]
- 31.Nainani N, Panesar M. Nephrogenic Systemic Fibrosis. Am J Nephrol. 2008 Jul 29;29(1):1–9. doi: 10.1159/000149628. [DOI] [PubMed] [Google Scholar]
- 32.Bhave G, Lewis JB, Chang SS. Association of gadolinium based magnetic resonance imaging contrast agents and nephrogenic systemic fibrosis. J Urol. 2008;180(3):830–5. doi: 10.1016/j.juro.2008.05.005. [DOI] [PMC free article] [PubMed] [Google Scholar]
- 33.Toffaletti JG, McDonnell EH. Variation of Serum creatinine, Cystatin C, and Creatinine Clearance Tests in Persons with Normal Renal Function. Clinica Chimica Acta. 2008;395:115–119. doi: 10.1016/j.cca.2008.05.020. [DOI] [PubMed] [Google Scholar]


