Abstract
We report that redox-inactive Sc3+ can trigger O2 activation by the FeII(TMC) center (TMC = tetramethylcyclam) to generate the corresponding oxoiron(IV) complex in the presence of BPh4− as an electron donor. To model a possible intermediate in the above reaction, we generated an unprecedented Sc3+-adduct of [FeIII(η2-O2)(TMC)]+, which was characterized to have an FeIII-(μ-η2:η2-peroxo)-Sc3+ core and found to convert to the oxoiron(IV) complex. These results have important implications for the role a Lewis acid can play in facilitating O–O bond cleavage during the course of O2 activation at nonheme iron centers.
There is much current interest in investigating the ability of redox-inactive metal ions to modulate redox reactions by virtue of their Lewis acidity, particularly with respect to their possible roles in O2 evolution1 and activation.2,3 For example, the oxygen-evolving complex of Photosystem II requires a redox-inactive Ca2+ ion to produce O2.1 In addition, redox-inactive ions have been found to affect the stability and reactivities of high-valent metal-oxo complexes in biomimetic systems2 as well as to accelerate O2 activation by FeII and MnII complexes.3 For the latter, heterobimetallic O2 adducts and high-valent metal-oxo species are presumably involved but have not been observed. We previously demonstrated that [FeII(TMC) (NCCH3)]2+ (1) (TMC = 1,4,8,11-tetramethylcyclam) reacts with O2 in CH3CN in the presence of stoichiometric H+ and BPh4− to form [FeIVO(TMC)(NCCH3)]2+ (4).4 Herein, we report that a redox-inactive Sc3+ ion can replace the strong acid in this reaction to trigger the formation of 4. An unprecedented Sc3+ adduct (3) of [FeIII(η2-O2)(TMC)]+ (2) was trapped, spectroscopically characterized in detail, and found to convert to 4 (Scheme 1).
Scheme 1.
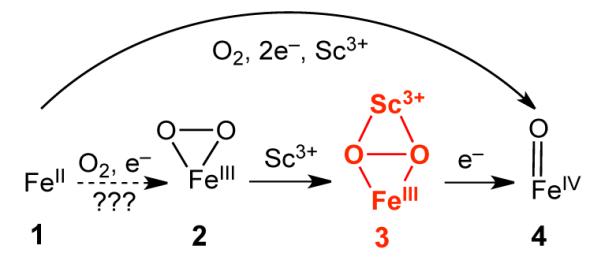
Proposed mechanism for the formation of 4 from 1 and O2
Complex 1 is air stable in acetonitrile solution for days. However, the addition of 1 equiv. Sc(OTf)3 together with 1 equiv. NaBPh4 to an aerobic solution of 1 resulted in the formation of 4 in >70% yield over the course of ~1 h at 0 °C, as indicated by its signature near-IR band at 820 nm (Figure 1A).5 Electrospray ionization mass spectra of the solution revealed the evolution of a prominent peak at m/Z = 477.0, assigned to the {[FeIV(O)(TMC)](OTf)}+ ion based on its position and isotope distribution pattern (Figure S1). When the reaction was carried out with 18O2, the m/Z = 477 peak showed an upshift of 2 units (Figure S2), confirming that the oxo moiety of 4 derived from dioxygen and that O–O bond cleavage must occur for the formation of 4 from 1 and O2.
Figure 1.
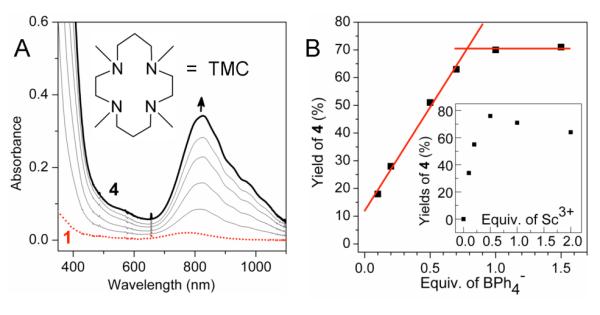
Reaction of 0.96 mM 1 with NaBPh4 and Sc(OTf)3 in aerobic CH3CN at 0 °C. (A) UV-visible spectral changes observed with 1 equiv. NaBPh4 and 1 equiv. Sc(OTf)3. Inset: TMC ligand. (B) Plot of the yield of 4 vs. equiv. BPh4− in the presence of 1 equiv. Sc3+. Inset: plot of the yield of 4 vs. equiv. of Sc3+ with 1 equiv. BPh4−.
Further investigation demonstrated the requirement for both Sc3+ and BPh4− for the formation of 4 from 1, as addition of either BPh4− or Sc3+ alone to 1 in air-saturated CH3CN solution did not elicit any detectable change in the UV-visible spectra. In addition, the yield of 4 correlated linearly with the amount of BPh4− added, plateauing at 1.0 equiv. BPh4− (Figure 1B). 1H-NMR studies of the final solution showed that BPh4− had decomposed to 1,1′-biphenyl (Figure S3) with a stoichiometry of 0.95±0.15 equiv. relative to 1, demonstrating that BPh4− provides the two electrons needed to convert 1 and O2 into 4. On the other hand, a sub-stoichiometric amount of Sc3+ was sufficient for the maximal formation of 4 (Figure 1B inset), suggesting that Sc3+ can act somewhat ‘catalytically’.
As shown in Figure 1A, no intermediates are evident in the UV-Vis spectra during the conversion of 1 to 4.6 To account for the role of Sc3+ in this transformation, we propose the formation of a Sc3+-peroxo-Fe3+ adduct that is reminiscent of the FeIII–OOH species proposed in the H+-and-BPh4−-promoted generation of 4 from O2 and 1.4,7 To test this hypothesis, Sc(OTf)3 was added to a solution of the blue FeIII(η-O2) complex 2 (purified via precipitation as its BPh4 salt; see SI for details), which resulted in the immediate generation of a magenta intermediate (3) and its subsequent conversion to 4 in ~70% yield over the course of ~1 h at −10 °C (Figure 2A).
Figure 2.
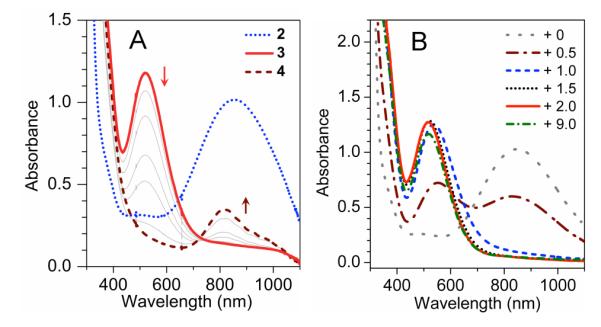
(A) UV-visible spectral changes upon addition of 3 equiv. Sc3+ to 1.5 mM purified 2 (ε835 = 650 M−1cm−1) in CH3CN at −10 °C instantly generating 3 (ε520 = 780 M−1cm−1), which in turn decayed to 4. (B) UV-visible changes upon titration of 1.5 mM 2 in CH3CN at −40 °C with Sc3+ (0, 0.5, 1.0, 1.5, 2.0, 9.0 equiv, respectively).
What is the identity of 3? Complex 3 exhibits a λmax of 520 nm (ε520 = 780 M−1cm−1) established from its UV-visible spectrum (Figure 2A) and Mössbauer analysis. The large blue shift observed for the peroxo-to-Fe(III) charge transfer band of 2 (λmax 835 nm) is reminisent of that seen upon protonation of 2 to form [FeIII(TMC)(η1-OOH)]2+ in CH3CN (5),7a indicating partial neutralization of the negative charge of the peroxo ligand. Titration of 2 with Sc(OTf)3 showed that 1 equiv Sc(OTf)3 was nearly sufficient to cause the 835-nm band of 2 to disappear, suggesting a 1:1 stoichiometry for the Sc3+-adduct of 2 (Figure 2B). The EPR spectrum of 3 shows features at g = 9.1, 5.1, 3.6 and ~2, consistent with an S = 5/2 iron(III) center with an E/D of 0.18 (Figure 3 left), compared to E/D values of 0.28 and 0.097 for 2 and 5,7a respectively. The Mössbauer spectra of 3 (Figure 3 right) are typical of high-spin iron(III); their analysis is described in the SI and Mössbauer parameters are listed in Table 1 and Figure 3 caption. A comparison of the spectroscopic properties in Table 1 shows that 3 is quite different from 2 and 5, indicating that Sc3+ significantly affects the properties of the peroxoiron(III) unit.
Figure 3.
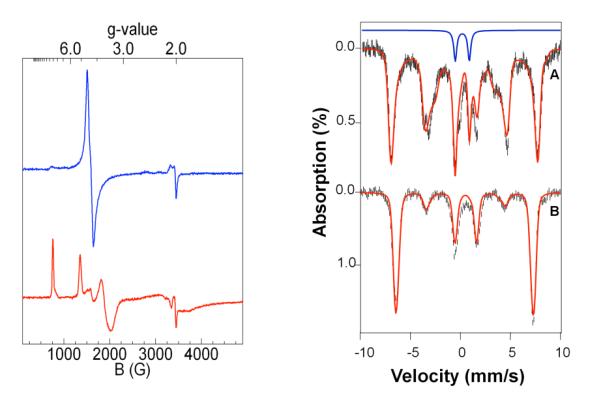
Left panel: EPR spectra of 2 (blue line, top)7a and 3 (red line, bottom) at 2 K and 0.2 mW microwave power. Right panel: 4.2 K Mössbauer spectra of 3 in MeCN recorded in parallel applied fields of 0.5 T (A) and 8.0 T (B). The red lines in (A) and (B) are theoretical curves based on eq 1 of the SI, using the following parameters: D = +1.3 cm−1, E/D = 0.18, g0 = 2.00, Ax/gnβn = −20.0T, Ax/gnβn = −20.6 T Ax/gnβn = −19.9 T , ΔEQ = 0.50 mm/s, η = −0.5, δ = 0.47 mm/s. The Mössbauer sample contained 90% 38 and 10% FeIV=O species (blue line).
Table 1.
Spectroscopic comparison of FeIII(TMC)-peroxo complexes (S = 5/2) in CH3CN
|
λmax, nm |
ΔEQ, mm/s |
δ, mm/s |
D, cm−1 |
E/D | Pre-edge area |
ref | |
|---|---|---|---|---|---|---|---|
| 2 | 835 | −0.92 | 0.58 | −0.91 | 0.28 | 17.9 | 7a |
| 3 | 520 | 0.50 | 0.47 | 1.3 | 0.18 | 14.4 | * |
| 5 | 500 | 0.20 | 0.51 | 2.5 | 0.097 | 22.4 | 7a |
this work.
We also carried out Fe K-edge X-ray absorption spectroscopic (XAS) studies to investigate the structural features of 3. Complex 3 exhibits an Fe K-edge at 7125.3 eV and a pre-edge feature at 7113.3 eV, which are comparable to those of 2 and 5 obtained in CH3CN solvent (Figure S4, Table S1).7a The pre-edge feature of 3 has an area of 14.4(6) units, compared to 17.9 for 2 and 22.4 for 5 (Table S1). As the pre-edge area reflects the extent to which the iron center deviates from centrosymmetry, the coordination environment of 3 must be closer to that of 2 with an η2-peroxo ligand than that of 5 with an η1-OOH ligand.
Analysis of the EXAFS data of 3 provides additional structural insight. Best fits reveal 4 N scatterers at 2.18 Å and 4 C scatterers each at 3.00 and 3.15 Å; all these features arise from the TMC ligand and have distances close to those found for 2 (Figure 4, Table S2). In addition, there is an O subshell at 1.98(1) Å arising from the peroxo ligand. Notably, the Fe–O distance of 3 is significantly longer than the 1.91-Å distance found for 2,7a implying the addition of Sc3+ significantly weakens the iron-peroxo interaction. This 0.07-Å lengthening is inconsistent with conversion of the η2-peroxo ligand to an η1-isomer, as related η1-peroxo complexes 5 and 6 both have shorter Fe–O distances (Table 2). CuII adducts to (η2-peroxo)heme complexes also have one short Fe–O bond of ~1.93 Å in a highly unsymmetric η2-peroxo ligand that binds to the iron.9 Thus, the 0.07-Å lengthening of the r(Fe–O) of 3 relative to that of 2 favors a symmetric η2-peroxo binding mode for 3. This conclusion is also supported by a comparison of fits 7 and 8 in Table S2, where the 2-O subshell in fit 7 has a σ2 value of ~4, while the 1-O subshell in fit 8 has a σ2 value of −0.4. A negative σ2 value for the latter indicates that either a bond is more rigid than would be expected for its distance or that there are too few scatterers associated with that shell.10 A negative σ2 value was also found when only one O-scatterer (instead of two) was used in fitting the EXAFS data for 2. Our EXAFS results thus demonstrate that the binding of Sc3+ retains the symmetric side-on binding mode of the peroxo ligand in 3 but elongates the r(Fe–O) by 0.07 Å.11
Figure 4.
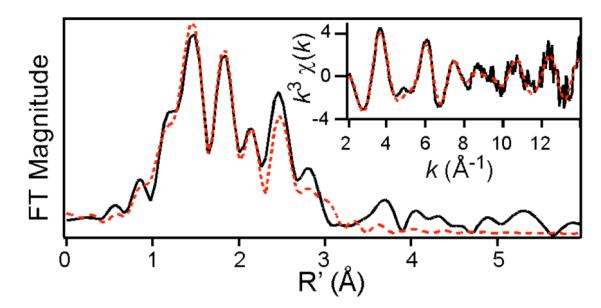
Fourier transform of Fe K-edge EXAFS data for 3 over a k-range of 2-14 Å−1, with k3χ(k) vs k data shown in the inset. The solid black lines represent the experimental data, while the red dashed lines correspond to the best fit with 2 O @ 1.98 Å and 4 N @ 2.18 Å (fit #22 in Table S3).
Table 2.
Comparison of Structural and Raman data for S = 5/2 FeIII-peroxo complexes.
| Complexes |
r(Fe–N) (Å) |
r(Fe–O) (Å) |
ν(O–O) (cm−1) |
Ref. |
|---|---|---|---|---|
| 3 # | 2.18 | 1.98, 1.98 | 807 | * |
|
| ||||
| nonheme FeIII-η2-peroxo |
816–827 | 7, 15 | ||
| 2 (2′)# | 2.20 (2.21) | 1.91, 1.91 (1.91, 1.91) |
826 (825) | 7a (7b) |
|
| ||||
| nonheme FeIII-η1-peroxo |
830–891 | 7, 16& | ||
| 5 (5′)# | 2.15 (2.16) | 1.92 (1.85) | 870 (868) | 7a (7b) |
| 6$ | 2.17 | 1.89 | 17 | |
|
| ||||
| (heme)FeIII- (μ-η2:η1-O2)CuII |
2.09 | 1.92, 2.09 | 788–808 | 9a, 9b |
| (heme)FeIII- (μ-η2:η2-O2)CuII |
2.09 | 1.94, 2.09 | 747–767 | 9a, 9b |
The final key piece of evidence for the identity of 3 comes from resonance Raman spectroscopy. Laser excitation into the intense 520-nm band of 3 reveals two prominent peaks at 807 and 543 cm−1 (Figure 5) that correspond to ν(O–O) and ν(Fe–O) modes, respectively. These assignments are corroborated by 18O-labeling, resulting in respective downshifts of 45 and 23 cm−1 that correlate well with Hooke’s Law predictions for these modes and support the presence of an iron-bound peroxo ligand in 3.12 The ν(O–O) of 3 is the lowest of any nonheme high-spin peroxoiron(III) complex thus far observed (Table 2). Relative to its precursor 2,7a 3 has a ν(O–O) that is downshifted by 19 cm−1 and a ν(Fe–O) that is upshifted by 50 cm−1, consistent with the retention of the η2 binding mode of the peroxo ligand. Taken together, the spectrosopic data lead us to propose a Fe3+(μ-η2:η2-O )Sc3+ core for 3, analogous to the Ni2+(μ-η2:η2-O2)K+ core found in a complex characterized crystallographically by Limberg, Driess, and coworkers.13,14 With the nature of 3 characterized, an important question that remains is whether it is involved in the conversion of 1 to 4 by O2 activation. The requirement for both Sc3+ and two electrons to trigger O2 activation of 1 suggests the likely formation of a Sc3+-peroxo-Fe3+ species like 3 as an intermediate (Scheme 1). However the fact that this species does not accumulate during O2 activation (Figure 1A) suggests that 3 may correspond to a more stable isomer of the actual intermediate involved in the O2 activation reaction. Nevertheless, 3 represents a rare example of a heterobimetallic complex bridged by a peroxo ligand9,13 and the only one thus far involving a nonheme iron center.
Figure 5.
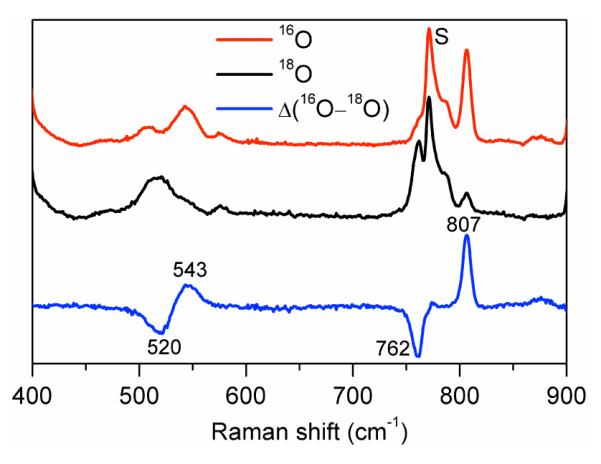
Resonance Raman spectra of 3 prepared in CH3CN with H216O2 (red, top) and H218O2 (black, middle) obtained with 514.5 nm excitation, 100 mW. The 16O – 18O difference spectrum is shown in blue (bottom). S = solvent.
The spectroscopic characterization of 3 as a complex with an Fe3+(μ-η2:η2-O2)Sc3+ core provides a plausible mechanism for a Lewis acid to promote O–O bond cleavage. This insight points to another role the second iron center can play in diiron enzymes besides serving as an electron source: functioning as a Lewis acid to facilitate formation of high-valent iron-oxo intermediates such as Q and X in the respective oxygen activating cycles of methane monooxygenase and Class 1A ribonucleotide reductases.18 This report of the Sc3+-peroxo-Fe3+ intermediate (3) also augments the recent literature focused on the effects of redox-inactive Lewis acidic metal ions on redox transformations.1,2,3 Prominent among these are their accelerative properties in oxidations by high-valent metal-oxo complexes discovered by Fukuzumi and Nam2a-f as well as the role of Ca2+ in forming an O–O bond from water during photosynthesis.1 Relevant to the latter, Borovik recently showed that group II metal ions (MII) can enhance the rates of O2 activation by FeII and MnII complexes to afford well characterized MII–(μ-OH)–(MnIII/FeIII) products, presumably via heterobimetallic O2 adducts.3 Our results herein demonstrate that Sc3+ can turn “on” the activation of O2 at a nonheme iron center and that a transient Sc3+–peroxo–Fe3+ species related to 3 could be a viable intermediate leading to O–O bond cleavage.
Supplementary Material
Acknowledgments
Funding Sources This work was supported by the National Science Foundation (grant CHE1058248 to L.Q.) and the National Institutes of Health (grant EB001475 to E.M. and postdoctoral fellowship GM093479 to K.M.V.H.). F.L. acknowledges a doctoral dissertation fellowship from the University of Minnesota. XAS data were collected at beamline X3B of the National Synchrotron Light Source at the Brookhaven National Laboratory and beamline 7-3 of the Stanford Synchrotron Radiation Lightsource, both supported by NIH and DOE.
ABBREVIATIONS
- EXAFS
extended X-ray absorption fine structure
- TMC
1,4,8,11-tetramethylcyclam
- TMCS
1-(2-mercaptoethyl)-4,8,11-trimethyl-1,4,8,11-tetraazacyclotetradecane
- XAS
X-ray absorption spectroscopy.
Footnotes
ASSOCIATED CONTENT Supporting Information. Syntheses, physical methods, ESI-MS, 1H NMR, and XANES figures, and details of XANES and XAS analysis are in the SI, which is available free of charge via the Internet at http://pubs.acs.org.
REFERENCES
- (1) (a).Yocum CF. Coord. Chem. Rev. 2008;252:296–305. [Google Scholar]; (b) Umena Y, Kawakami K, Shen J-R, Kamiya N. Nature. 2011;473:55–60. doi: 10.1038/nature09913. [DOI] [PubMed] [Google Scholar]; (c) Tsui E,Y, Tran R, Yano J, Agapie T. Nature Chem. 2013;5:293–299. doi: 10.1038/nchem.1578. [DOI] [PMC free article] [PubMed] [Google Scholar]
- (2) (a).Fukuzumi S. Coord. Chem. Rev. 2013;257:1564–1575. doi: 10.1016/j.ccr.2012.05.031. [DOI] [PMC free article] [PubMed] [Google Scholar]; (b) Fukuzumi S, Morimoto Y, Kotani H, Naumov P, Lee Y-M, Nam W. Nature Chem. 2010;2:756–759. doi: 10.1038/nchem.731. [DOI] [PubMed] [Google Scholar]; (c) Morimoto Y, Kotani H, Park J, Lee Y-M, Nam W, Fukuzumi S. J. Am. Chem. Soc. 2011;133:403–405. doi: 10.1021/ja109056x. [DOI] [PubMed] [Google Scholar]; (d) Park J, Morimoto Y, Lee Y-M, Nam W, Fukuzumi S. J. Am. Chem. Soc. 2011;133:5236–5239. doi: 10.1021/ja200901n. [DOI] [PubMed] [Google Scholar]; (e) Morimoto Y, Kotani H, Park J, Lee Y-M, Nam W, Fukuzumi S. J. Am. Chem. Soc. 2011;133:403–405. doi: 10.1021/ja109056x. [DOI] [PubMed] [Google Scholar]; (f) Chen J, Lee Y-M, Davis KM, Wu X, Seo MS, Cho K-B, Yoon H, Park YJ, Fukuzumi S, Pushkar YN, Nam W. J. Am. Chem. Soc. 2013;135:6388–6391. doi: 10.1021/ja312113p. [DOI] [PubMed] [Google Scholar]; (g) Leeladee P, Baglia RA, Prokop KA, Latifi R, de Visser SP, Goldberg DP. J. Am. Chem. Soc. 2012;134:10397–10400. doi: 10.1021/ja304609n. [DOI] [PubMed] [Google Scholar]
- (3) (a).Park YJ, Ziller JW, Borovik AS. J. Am. Chem. Soc. 2011;133:9258–9261. doi: 10.1021/ja203458d. [DOI] [PMC free article] [PubMed] [Google Scholar]; (b) Park YJ, Cook SA, Sickerman NS, Sano Y, Ziller JW, Borovik AS. Chem. Sci. 2013;4:717–726. doi: 10.1039/C2SC21400H. [DOI] [PMC free article] [PubMed] [Google Scholar]
- (4).Thibon A, England J, Martinho M, Young VG, Jr., Frisch JR, Guillot R, Girerd J-J, Münck E, Que L, Jr., Banse F. Angew. Chem. Int. Ed. 2008;47:7064–7067. doi: 10.1002/anie.200801832. [DOI] [PMC free article] [PubMed] [Google Scholar]
- (5).Rohde J-U, In J-H, Lim MH, Brennessel WW, Bukowski MR, Stubna A, Münck E, Nam W, Que L., Jr. Science. 2003;299:1037–1039. doi: 10.1126/science.299.5609.1037. [DOI] [PubMed] [Google Scholar]
- (6).No intermediates were observed as well in the previously reported reactions of 1 and O2 to form 4, irrespective of whether it was promoted by H+/BPh4−,4 NADH analogs (Hong S, Lee Y-M, Shin W, Fukuzumi S, Nam W. J. Am. Chem. Soc. 2009;131:13910–13911. doi: 10.1021/ja905691f.), or cycloalkene (Lee Y-M, Hong S, Morimoto Y, Shin W, Fukuzumi S, Nam W. J. Am. Chem. Soc. 2010;132:10668–10670. doi: 10.1021/ja103903c.).
- (7) (a).Li F, Meier KK, Cranswick MA, Chakrabarti M, Van Heuvelen KM, Münck E, Que L., Jr. J. Am. Chem. Soc. 2011;133:7256–7259. doi: 10.1021/ja111742z. [DOI] [PMC free article] [PubMed] [Google Scholar]; (b) Cho J, Jeon S, Wilson SA, Liu LV, Kang EA, Braymer JJ, Lim MH, Hedman B, Hodgson KO, Valentine JS, Solomon EI, Nam W. Nature. 2011;478:502–505. doi: 10.1038/nature10535. [DOI] [PMC free article] [PubMed] [Google Scholar]; (c) Liu LV, Hong S, Cho J, Nam W, Solomon EI. J. Am. Chem. Soc. 2013;135:3286–3299. doi: 10.1021/ja400183g. [DOI] [PMC free article] [PubMed] [Google Scholar]
- (8).We had difficulties obtaining simulations that simultaneously fit the 0.5 and 8.0 T. spectra. We suspect that the Hamiltonian requires the introduction of quartic terms as we found for 2.7a
- (9) (a).Halime Z, Kieber-Emmons MT, Qayyum MF, Mondal B, Gandhi T, Puiu SC, Chufán EE, Sarjeant AAN, Hodgson KO, Hedman B, Solomon EI, Karlin KD. Inorg. Chem. 2010;49:3629–3645. doi: 10.1021/ic9020993. [DOI] [PMC free article] [PubMed] [Google Scholar]; (b) Chufán EE, Puiu SC, Karlin KD. Acc. Chem. Res. 2007;40:563–572. doi: 10.1021/ar700031t. [DOI] [PubMed] [Google Scholar]; (c) Chishiro T, Shimazaki Y, Tani F, Tachi Y, Naruta Y, Karasawa S, Hayami S, Maeda Y. Angew. Chem. Int. Ed. 2003;42:2788–2791. doi: 10.1002/anie.200351415. [DOI] [PubMed] [Google Scholar]
- (10).Scott RA. In: Physical Methods in Bioinorganic Chemistry. Spectroscopy and Magnetism. Que L Jr., editor. University Science Books; Sausalito, CA: 2000. pp. 465–503. [Google Scholar]
- (11).We attempted to include in fits of 3 a Sc scatterer at ~3.7 Å. Fits 13 and 14 in Table S2 show that a Sc scatterer of 3.8 Å with a reasonable Debye-Waller factor (σ2 ~ 4) can be added, but only a slight improvement in GOF was obtained. Similar results were obtained in the EXAFS analysis of a Sc-O-Co complex (Pfaff FF, Kundu S, Risch M, Pandian S, Heims F, Pryjomska-Ray I, Haack P, Metzinger R, Bill E, Dau H, Comba P, Ray K. Angew. Chem. Int. Ed. 2011;50:1711–1715. doi: 10.1002/anie.201005869.).
- (12).At first glance, the 50 cm−1 upshift of the Fe–O vibration from 2 to 3 may appear to contradict the observed lengthening of the Fe–O bond distance deduced from EXAFS analysis, but the 18O shifts found for the respective Fe–O vibrations are quite different (−15 vs −23 cm−1). The downshift for 3 is as calculated for a diatomic Fe–O oscillator, but the smaller shift for 2 indicates mixing of the diatomic Fe–O vibration with other vibrational modes. Thus a direct comparison of the frequencies to deduce Fe–O bond distance is not valid in this case.
- (13).Yao S, Xiong Y, Vogt M, Grützmacher H, Herwig C, Limberg C, Driess M. Angew. Chem. Int. Ed. 2009;48:8107–8110. doi: 10.1002/anie.200903772. [DOI] [PubMed] [Google Scholar]
- (14).A related Fe3+(μ-η2:η2-O2)H+ core was postulated by Nam for a short-lived (<2 ms) species (λmax 527 nm) observed at −40 °C upon treatment of 2 with strong acid in its conversion to 5.7b
- (15) (a).Girerd J-J, Banse F, Simaan A. J. Struct. Bonding. 2000;97:145–177. [Google Scholar]; (b) Roelfes G, Vrajmasu V, Chen K, Ho RYN, Rohde J-U, Zondervan C, la Crois RM, Schudde EP, Lutz M, Spek AL, Hage R, Feringa BL, Münck E, Que L., Jr. Inorg. Chem. 2003;42:2639–2653. doi: 10.1021/ic034065p. [DOI] [PubMed] [Google Scholar]; (c) Simaan AJ, Döpner S, Banse F, Bourcier S, Bouchoux G, Boussac A, Hildebrandt P, Girerd J-J. Eur. J. Inorg. Chem. 2000:1627–1633. [Google Scholar]; (d) Neese F, Solomon EI. J. Am. Chem. Soc. 1998;120:12829–12848. [Google Scholar]
- (16) (a).Brunold TC, Solomon EI. J. Am. Chem. Soc. 1999;121:8288–8295. [Google Scholar]; (b) Wada A, Ogo S, Nagatomo S, Kitagawa T, Watanabe Y, Jitsukawa K, Masuda H. Inorg. Chem. 2002;41:616–618. doi: 10.1021/ic001058h. [DOI] [PubMed] [Google Scholar]; (c) Kitagawa T, Dey A, Lugo-Mas P, Benedict JB, Kaminsky W, Solomon E, Kovacs JA. J. Am. Chem. Soc. 2006;128:14448–14449. doi: 10.1021/ja064870d. [DOI] [PMC free article] [PubMed] [Google Scholar]; (d) Katona G, Carpentier P, Nivière V, Amara P, Adam V, Ohana J, Tsanov N, Bourgeois D. Science. 2007;316:449–453. doi: 10.1126/science.1138885. [DOI] [PubMed] [Google Scholar]
- (17).McDonald AR, Van Heuvelen KM, Guo Y, Li F, Bominaar EL, Münck E, Que L., Jr. Angew. Chem. Int. Ed. 2012;51:9132–9136. doi: 10.1002/anie.201203602. [DOI] [PMC free article] [PubMed] [Google Scholar]
- (18) (a).Tinberg CE, Lippard S. J. Acc. Chem. Res. 2011;44:280–288. doi: 10.1021/ar1001473. [DOI] [PMC free article] [PubMed] [Google Scholar]; (b) Stubbe J, Nocera DG, Yee CS, Chang MCY. Chem. Rev. 2003;103:2167–2201. doi: 10.1021/cr020421u. [DOI] [PubMed] [Google Scholar]
Associated Data
This section collects any data citations, data availability statements, or supplementary materials included in this article.


