Abstract
Comb-push Ultrasound Shear Elastography (CUSE) has recently been shown to be a fast and accurate two-dimensional (2D) elasticity imaging technique that can provide a full field-of- view (FOV) shear wave speed map with only one rapid data acquisition. The initial version of CUSE was termed U-CUSE because unfocused ultrasound push beams were used. In this paper, we present two new versions of CUSE – Focused CUSE (F-CUSE) and Marching CUSE (M-CUSE), which use focused ultrasound push beams to improve acoustic radiation force penetration and produce stronger shear waves in deep tissues (e.g. kidney and liver). F-CUSE divides transducer elements into several subgroups which transmit multiple focused ultrasound beams simultaneously. M-CUSE uses more elements for each focused push beam and laterally marches the push beams. Both F-CUSE and M-CUSE can generate comb-shaped shear wave fields that have shear wave motion at each imaging pixel location so that a full FOV 2D shear wave speed map can be reconstructed with only one data acquisition. Homogeneous phantom experiments showed that U-CUSE, F-CUSE and M-CUSE can all produce smooth shear wave speed maps with accurate shear wave speed estimates. An inclusion phantom experiment showed that all CUSE methods could provide good contrast between the inclusion and background with sharp boundaries while F-CUSE and M-CUSE require shorter push durations to achieve shear wave speed maps with comparable SNR to U-CUSE. A more challenging inclusion phantom experiment with a very stiff and deep inclusion shows that better shear wave penetration could be gained by using F-CUSE and M-CUSE. Finally, a shallow inclusion experiment showed that good preservations of inclusion shapes could be achieved by both U-CUSE and F-CUSE in the near field. Safety measurements showed that all safety parameters are below FDA regulatory limits for all CUSE methods. These promising results suggest that, using various push beams, CUSE is capable of reconstructing a 2D full FOV shear elasticity map using only one push-detection data acquisition in a wide range of depths for soft tissue elasticity imaging.
Index terms: CUSE, comb-push, ultrasound elastography, shear wave, acoustic radiation force, unfocused ultrasound beam, focused ultrasound beam
INTRODUCTION
Fast and accurate tissue elasticity imaging is an essential task in ultrasound shear wave elastography. By inducing shear waves into the tissue and ultrasonically tracking shear wave motion, ultrasound shear elastography is capable of solving for the shear modulus, μ, of soft tissue (assuming incompressibility, isotropy, linearity, and pure elasticity) by [1]:
where cs is shear wave propagation speed ρ, is density and can be assumed to be 1000 kg/cm3 for all soft tissues [2]. Shear waves can be produced by pushing the soft tissue with acoustic radiation force, as proposed by Sarvazyan et al. [1] in shear wave elasticity imaging (SWEI). Nightingale et al. developed acoustic radiation force impulse (ARFI) imaging which was used to remotely palpate soft tissues [3] or generate shear waves in the tissue [4]. Bercoff et al. invented supersonic shear imaging (SSI), in which a conical-shaped shear wave was generated from multiple ultrasound push beams focused at different depths [5-7]. McAleavey et al. developed spatially-modulated impulse acoustic radiation force (SMURF) to generate shear waves with known spatial frequency so that shear wave speed can be calculated from motion measurements at a single spatial location [8]. Chen et al. proposed shear wave dispersion ultrasound vibrometry (SDUV) which generates shear waves at multiple frequencies with acoustic radiation force to characterize tissue elasticity and viscosity with shear wave dispersion analysis [9, 10]. Hazard et al. implemented acoustic radiation force to produce a synthetic crawling wave and solve for shear wave speed from the interfering crawling wave patterns [11, 12]. Zhao et al. recently used unfocused acoustic radiation force to produce shear waves and achieved robust shear wave speed estimates throughout a long axial extent in both phantoms and biceps muscles [13].
For elasticity imaging methods that use acoustic radiation force to generate shear waves, shear waves propagate in opposite directions away from the push beam. Consequently, there is no propagating shear wave in the push beam region and shear wave speed cannot be calculated there. Meanwhile shear waves may be significantly attenuated in areas that are far away from the push beam region. Therefore, multiple data acquisitions with push beams transmitted at different locations are typically required to reconstruct a full field-of-view (FOV) two-dimensional (2D) shear elasticity map [14]. Recently, Song et al. proposed the comb-push ultrasound shear elastography (CUSE) method that is capable of providing a full FOV 2D shear wave speed map under the entire width of the transducer with only one rapid data acquisition [15, 16]. CUSE uses a comb-push to generate multiple shear waves that can cover the entire FOV so that areas including the push beam regions can be reconstructed. Moreover, because each imaging pixel always has one or more push beams nearby, higher SNR shear waves can be obtained in CUSE. By use of a directional filter, CUSE is capable of differentiating the left-to-right (LR) propagating and right-to-left (RL) propagating shear waves so that an accurate shear wave estimate can be achieved at each pixel location using time-of-flight (TOF) calculations. This version of CUSE used unfocused ultrasound push beams to generate shear waves and thus is termed Unfocused CUSE (U-CUSE) here.
To improve acoustic radiation force penetration and generate stronger shear waves in deeper tissue, in this paper, we propose two new versions of CUSE that use focused ultrasound push beams. The first version divides the transducer elements equally into subgroups, which transmit several focused ultrasound beams simultaneously and is termed Focused CUSE (F-CUSE). The second version uses more transducer elements to transmit a focused ultrasound push beam with a lower F-number and the push elements rapidly march along the lateral direction to push at different horizontal locations. This version of CUSE is termed Marching CUSE (M-CUSE). Similar to U-CUSE, both F-CUSE and M-CUSE can generate comb-patterned ultrasound push beams. As in U-CUSE, a directional filter can be used for both F-CUSE and M-CUSE to remove the interferences and separate the LR and RL waves so that robust shear wave speed estimates can be achieved at each imaging pixel within the FOV.
In this paper, we first introduce the principles of F-CUSE and M-CUSE, including the push beam sequences, shear wave motion detection, directional filtering, and the shear wave speed map reconstruction. Then we describe phantom experiments including homogeneous phantoms and inclusion phantoms to assess the relative performance of the three techniques in a variety of situations. We close the paper with discussion and conclusions.
MATERIALS AND METHODS
Principles of F-CUSE and M-CUSE
A Verasonics ultrasound system (Verasonics Inc., Redmond, WA) was used in this study to produce comb-push beams and track shear wave motions with a linear array transducer L7-4 (Philips Healthcare, Andover, MA). Schematic plots of U-CUSE, F-CUSE and M-CUSE are shown in Fig. 1. For all CUSE methods, the transducer elements were divided into subgroups, i.e. subgroups 1 to 9 for U-CUSE. In U-CUSE, subgroups 1, 3, 5, 7, and 9 simultaneously transmit unfocused push beams (center frequency = 4.09 MHz, push duration = 600 μs) while subgroups 2, 4, 6 and 8 are turned off. There are 12 elements in each push beam and 17 elements in between push beams. For F-CUSE, the transducer elements were divided into four subgroups and each subgroup has 32 elements. All subgroups transmit focused ultrasound beams simultaneously (center frequency = 4.09 MHz, push duration = 600 μs). For M-CUSE, the transducer was divided into four subgroups as well but with overlapping elements. Each subgroup has 64 elements. Subgroup 1 transmits a single focused push beam (center frequency = 4.09 MHz, push duration = 200 μs) at time t1, and then marches to subgroup 2 to transmit the second focused push beam at time t2. The marching continues through subgroups 3 and 4 and terminates. The time interval between the end and start of consecutive push beams was 15 μs due to hardware limitations. Note that each focused beam for M-CUSE has 200 μs push duration, which is one third of both U-CUSE and F-CUSE. This is because the center portion of the transducer elements are transmitting three times, as shown in Fig. 1(c). A 200 μs push duration was used for M-CUSE so that the maximum push duration for these center elements would still be 600 μs, to allow a fair comparison to both U-CUSE and F-CUSE in terms of transducer heating.
Fig. 1.
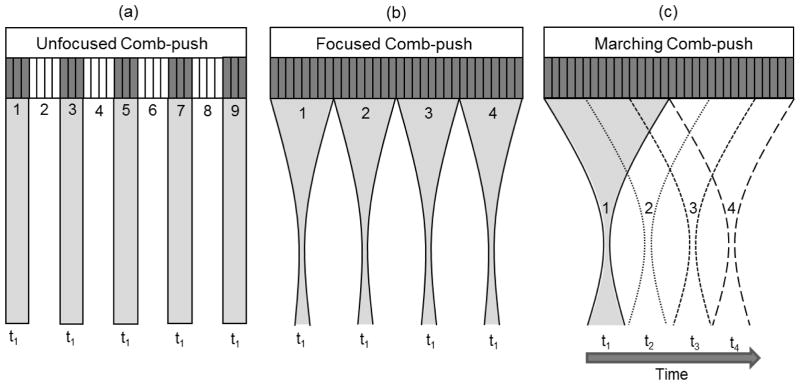
Schematic plots of different CUSE imaging sequences. (a) U-CUSE: transmit multiple unfocused ultrasound push beams simultaneously at time t1. (b) F-CUSE: transmit multiple focused ultrasound beams simultaneously at time t1. (c) M-CUSE: transmit single focused ultrasound beam using element subgroup 1 at time t1, then march laterally to push with subgroup 2 at time t2, subgroup 3 at time t3, and subgroup 4 at time t4. The time interval between the end and start of consecutive push beams was 15 μs.
For all CUSE methods, after comb-push transmission, the Verasonics system immediately switched to plane wave imaging mode using all transducer elements (center frequency = 5 MHz). A plane wave imaging compounding method was used to improve the signal-to-noise-ratio (SNR) of shear wave tracking [17]. Three frames at three different steering angles (−4°, 0°, 4°) were used to obtain one imaging frame, with a spatial resolution of one ultrasound wavelength (~0.308 mm assuming ultrasound speed = 1540 m/s) and effective frame rate of 3.9 kHz.
Shear wave motion estimation
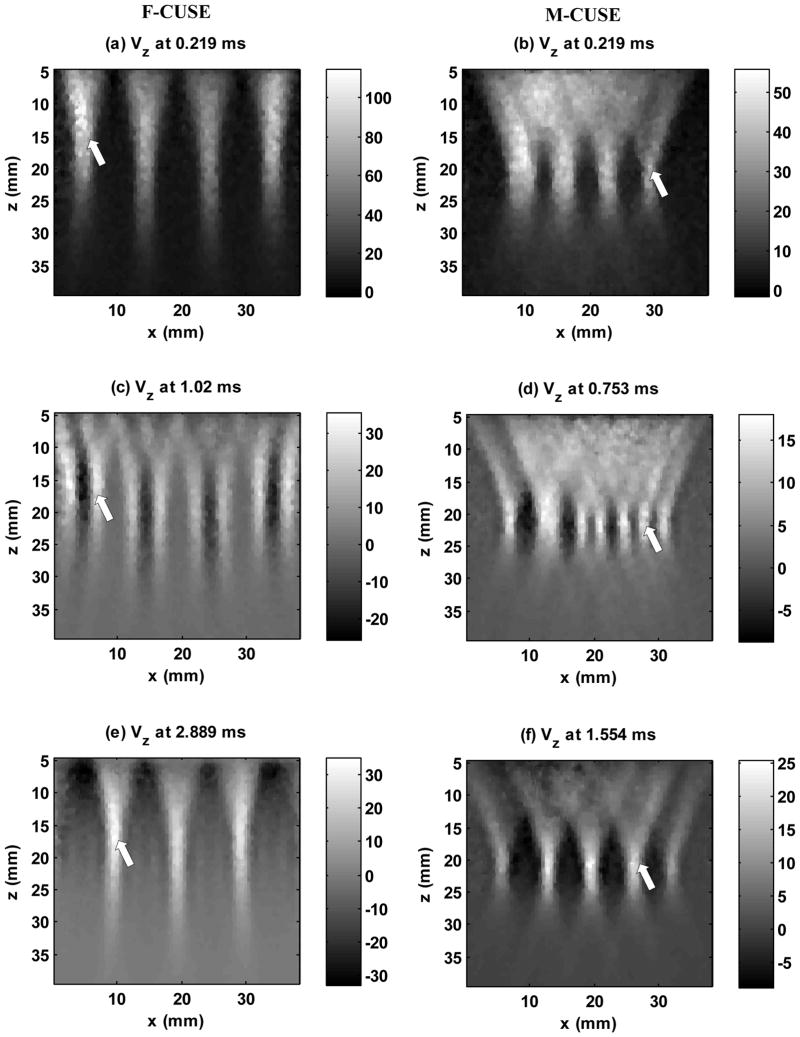
The shear wave propagation induced axial particle velocity (Vz) was evaluated from in-phase/ quadrature (IQ) data of consecutive frames tracked by the Verasonics system. The one-dimensional autocorrelation method [18] was used to calculate Vz for each imaging pixel. The shear wave motion was obtained from three pixels in space and two sampling points in the slow time direction. Then a 3 × 3 pixel spatial median-filter (0.92 mm × 0.92 mm) was used on each frame of the shear wave motion image to remove noise spike points. Fig. 2 shows the snapshots of shear wave motions at different time steps for F-CUSE and M-CUSE in a homogeneous phantom. Examples of shear wave motions for U-CUSE are given in [15].
Fig. 2.
Plots of particle axial velocity at different time steps for F-CUSE and M-CUSE in a homogeneous elastic phantom with shear wave speed of about 1.5 m/s. Shear waves from different push beams interfere with each other and eventually fill the entire FOV. Left column: F-CUSE: (a), (c) and (e) show that four shear wave sources were generated by the four focused push beams. Each push beam generates two shear wave fronts that propagate away from the push beam. As indicated by the white arrow, the left-to-right shear wave from subgroup 1 appears in (c) and merges with the right-to-left shear wave from subgroup 2 in (e). Right column: M-CUSE. (b), (d), (f) show that four shear waves were generated by the four focused push beams. As indicated by the white arrow, the right-to-left shear wave from subgroup 4 appears in (d) and merges with the left-to-right wave from subgroup 3 in (f). The colorbar is in units of mm/s and the scale is different for each time step. “x” represents the lateral dimension. “z” represents the axial dimension.
Directional Filtering
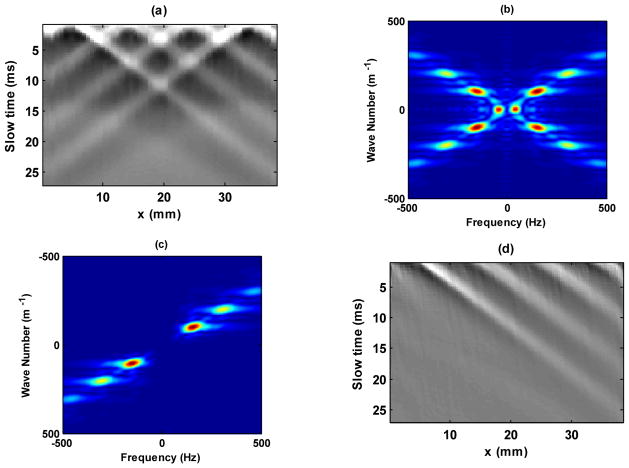
To remove the shear wave interferences and achieve robust shear wave speed estimates, a directional filter similar to [19, 20] was used in this study to separate the left-to-right (LR) and right-to-left (RL) propagating shear waves. The shear wave field data has two dimensions in space (lateral dimension (x) and axial dimension (z)) and one dimension in time (slow time (t)). Fig. 3(a) shows a slice of the F-CUSE shear field data with axes of lateral dimension (x) and slow time (t). The depth of the slice is at the focal plane of the focused push beams (25 mm). The 2D Fourier transform of the shear wave field yields a symmetric spectrum as shown in Fig. 3(b), with the first and the third quadrants corresponding to the LR shear waves and the second and the fourth quadrants corresponding to the RL shear waves. By designing a mask as shown in Fig. 3(c), one can extract the LR shear waves (Fig. 3(d)) by preserving the first and third quadrants of the specturm while masking out the second and the fourth. A complementary mask to Fig. 3(c) will extract the RL shear waves by preserving the second and the fourth quadrants of the spectrum while masking out the first and the third. The mask edges of the directional filters have been apodized to minimize ripples [19].
Fig. 3.
Directional filtering. (a) Original shear wave field created by F-CUSE before directional filtering. (b) The 2D Fourier transform of (a). (c) The directional filter masked out the 2nd and 4th quadrants (corresponding to RL shear waves) and preserved the 1st and 3rd quadrants (corresponding to LR shear waves). (d) Extracted LR shear waves by a 2D inverse Fourier transform of (c).
Local Shear Wave Speed Recovery and 2D Shear Wave Speed Map Reconstruction
A time-of-flight algorithm based on cross-correlating shear wave motion profiles along the lateral direction was used in this study to calculate shear wave propagation speed. The shear wave speed of an imaging pixel was calculated from two neighbor pixel points separated by 8 ultrasound wavelengths (8 imaging pixels) at the same depth [14]. To facilitate more robust cross-correlation, the shear wave motion profiles were Tukey windowed (the ratio of tapered section to constant section is 0.25) [21] so that both ends of the signal were forced to be zero. The shear wave motion profiles were pre-interpolated by a factor of five before cross-correlation (using the ‘interp’ function in MATLAB). Two-dimensional shear wave speed maps can be obtained from both the LR shear wave field and RL shear wave field. The final shear wave speed map is reconstructed using the same method as proposed in [15]. Fig. 4 shows an example of a final map reconstruction using F-CUSE. Recon1 (Fig. 4(a)) is reconstructed from the LR shear wave field and Recon2 (Fig. 4(b)) is reconstructed from the RL shear wave field. The final map (Fig. 4(c)) has the middle portion averaged from Recon 1 and Recon 2, part of subgroup 1 area from Recon 2 and part of subgroup 4 area from Recon1. The same reconstruction principles apply to M-CUSE.
Fig. 4.
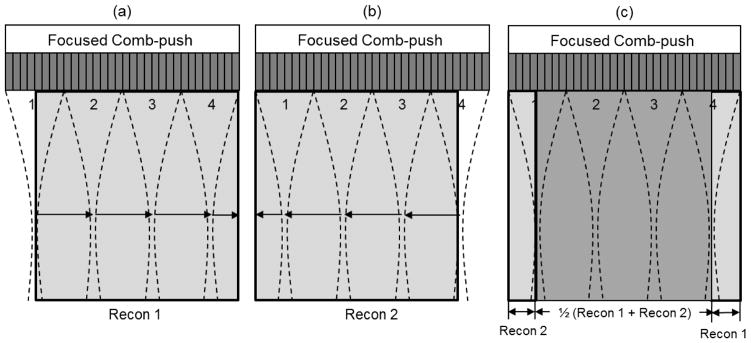
Schematic plots of 2D shear wave speed map reconstruction in CUSE. (a) Shear wave speed map reconstructed using LR waves (indicated by black arrows), (b) shear wave speed map reconstructed using RL waves, (c) final shear wave speed map combined by Recon1 and Recon2.
Ultrasound Safety Measurements
The same acoustic output measurements as in [15] were conducted in this study to measure the safety parameters for all CUSE methods. For succinctness, the experiment is not described here and one can refer to [15] for details. The focal depth was 42 mm for F-CUSE and 45 mm for M-CUSE. The mechanical index (MI), the spatial peak time average intensity (ISPTA), the spatial peak pulse average intensity (ISPPA), and temperature rise (TR) of single image acquisition were measured. The pressures were derated by 0.3 dB/cm/MHz for the calculations of MI0.3, ISPTA,0.3, and ISPPA,0.3.
RESULTS
Homogeneous Phantom Experiments
Two homogeneous elasticity phantoms (CIRS Inc., Norfolk, VA) with different shear moduli were used in this study to test the accuracy of U-CUSE, F-CUSE and M-CUSE for shear wave speed measurements. The nominal Young’s modulus of phantom 1 is 5.8 kPa (shear wave speed of 1.39 m/s calculated from Eqn. (1)), phantom 2 is 9.7 kPa (shear wave speed of 1.80 m/s). Both phantoms have ultrasound attenuation of 0.4 dB/cm/MHz, density of 1030 kg/m3 and sound speed of 1539.0 m/s. The shear wave speeds were measured by magnetic resonance elastography (MRE) and 1D transient elastography (1D TE) and were found to be in good agreement in a previous study [22]. These are regarded as reference values for this study. The details of MRE and 1D TE experiments have been described in [22]. Fig. 5 shows the 2D shear wave speed maps of phantom 1 using U-CUSE, F-CUSE and M-CUSE. No spatial smoothing filter was applied to these maps. The lateral FOV is the same as the transducer width (about 39 mm). The data acquisition for each map was less than 25 ms. A region-of-interest (ROI) from 5 mm to 35 mm in lateral direction and from 10 mm to 35 mm in axial direction was selected on each shear wave speed map to measure the mean and standard deviation values of shear wave speed measurements, as shown by the red rectangular box in Fig. 5(a). Five acquisitions at five different locations in the phantoms were measured by each CUSE method. The five measurements from different CUSE methods are compared with values from MRE (30 mm by 60 mm ROIs from five different planes) and 1D TE (25 mm line ROI along axial direction and 5 measurements from different lateral locations). The final results are summarized in Table I. The measurements showed good agreements among different methods. All CUSE methods produced consistent measurements with low variances among different locations.
Fig. 5.
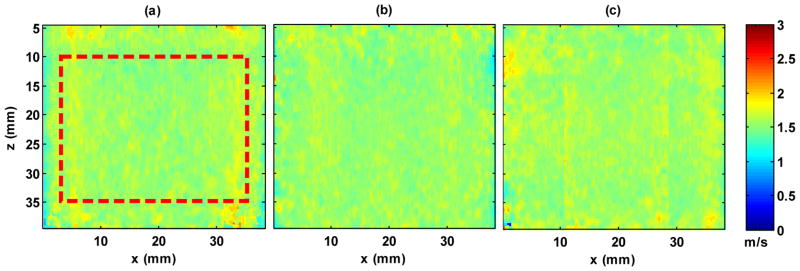
2D shear wave speed maps of phantom 1 from different CUSE methods: (a) U-CUSE, (b) F-CUSE, and (c) M-CUSE. The red box in (a) indicates the measurement ROI for all three methods. The measured shear wave speeds within the ROI from (a) is 1.55 ± 0.05 m/s, (b) is 1.55 ± 0.06 m/s, (c) is 1.57 ± 0.05 m/s. All speed maps use the same color scale. No spatial smoothing filter was applied to these maps.
Table I.
Shear wave speeds of phantom 1 and phantom 2 measured by MRE, 1D TE, U-CUSE,
| Phantom 1
| |||||
|---|---|---|---|---|---|
| Location 1 | Location 2 | Location 3 | Location 4 | Location 5 | |
|
|
|||||
| MRE | 1.55 ± 0.04 | 1.53 ± 0.03 | 1.50 ± 0.03 | 1.52 ± 0.03 | 1.51 ± 0.04 |
| 1D TE | 1.49 ± 0.02 | 1.45 ± 0.01 | 1.45 ± 0.01 | 1.50 ± 0.01 | 1.51 ± 0.02 |
| U-CUSE | 1.55 ± 0.05 | 1.54 ± 0.06 | 1.54 ± 0.06 | 1.54 ± 0.06 | 1.54 ± 0.06 |
| F-CUSE | 1.55 ± 0.06 | 1.55 ± 0.06 | 1.54 ± 0.06 | 1.55 ± 0.06 | 1.55 ± 0.06 |
| M-CUSE | 1.57 ± 0.05 | 1.57 ± 0.05 | 1.57 ± 0.05 | 1.58 ± 0.05 | 1.58 ± 0.05 |
|
| |||||
| Phantom 2
| |||||
| Location 1 | Location 2 | Location 3 | Location 4 | Location 5 | |
|
|
|||||
| MRE | 1.84 ± 0.03 | 1.85 ± 0.04 | 1.83 ± 0.04 | 1.81 ± 0.04 | 1.85 ± 0.04 |
| 1D TE | 1.90 ± 0.01 | 1.81 ± 0.02 | 1.97 ± 0.02 | 1.93 ± 0.02 | 1.84 ± 0.02 |
| U-CUSE | 1.94 ± 0.07 | 1.94 ± 0.07 | 1.94 ± 0.07 | 1.94 ± 0.07 | 1.94 ± 0.07 |
| F-CUSE | 1.94 ± 0.07 | 1.93 ± 0.07 | 1.93 ± 0.07 | 1.93 ± 0.07 | 1.93 ± 0.07 |
| M-CUSE | 1.97 ± 0.06 | 1.97 ± 0.06 | 1.96 ± 0.06 | 1.97 ± 0.06 | 1.97 ± 0.06 |
Inclusion Phantom Experiment I
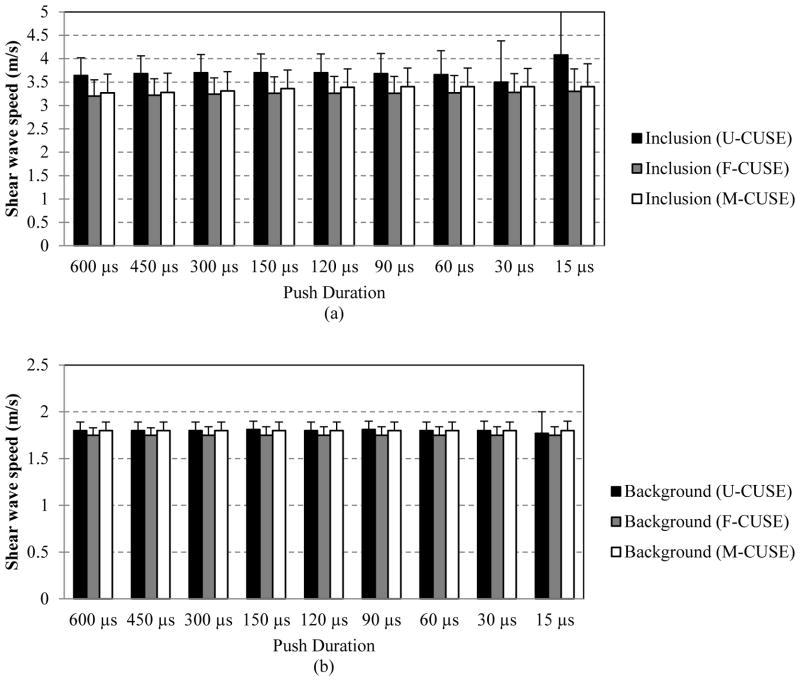
A CIRS breast elastography phantom (Model 059, CIRS Inc., Norfolk, VA) was tested in this study. This phantom has a sound speed of 1540 m/s, ultrasound attenuation of 0.5 dB/cm/MHz, density of 1030 kg/m3 and 13 spherical masses with different sizes and locations. According to CIRS, the stiffness of the inclusions is about 3 times greater than the stiffness of the background (thus the shear wave speed of the inclusions is about 1.73 times greater than the background according to Eqn. (1)). The nominal value of the moduli of this phantom is not available from CIRS. An inclusion situated about 25 mm away from the phantom surface was located and imaged by U-CUSE, F-CUSE and M-CUSE. F-CUSE and M-CUSE used beams focused at 25 mm. The initial push duration was 600 μs for U-CUSE and F-CUSE, and was 200 μs for M-CUSE as discussed in the Materials and Methods session. The push duration was then gradually reduced to 450, 300, 150, 120, 90, 60, 30, and 15 μs for U-CUSE and F-CUSE and 150, 100, 50, 40, 30, 20, 10, and 5 μs for M-CUSE. For each push duration, a 2D shear wave speed map was reconstructed from the three CUSE methods. As shown in Fig. 6, 2D shear wave speed maps from a 600 μs push (U-CUSE and F-CUSE) and a 200 μs push (M-CUSE) are provided (no spatial smoothing filter applied). All three CUSE methods were capable of providing smooth shear wave speed maps with good contrast between the inclusion and the background. The edges of the inclusions are sharp, and there are no significant artifacts throughout the speed maps. As shown in Fig. 6(a), ROIs of inclusion and background were selected to quantitatively measure the mean and standard deviation of shear wave speeds of the inclusion and background for all CUSE methods with different push durations. The measured results are plotted in Fig. 7. All CUSE methods were able to provide stable shear wave speed estimates of the phantom background throughout different push durations. F-CUSE and M-CUSE were able to provide robust estimates of shear wave speed of both the inclusion and background for all push durations, while U-CUSE failed below 30 μs, indicated by an increased measurement of standard deviation in the inclusion.
Fig. 6.

2D shear wave speed maps of the breast inclusion phantom using (a) U-CUSE, (b) F-CUSE, and (c) M-CUSE. All shear wave speed maps use the same color scale and no spatial smoothing filter was applied. Push duration was 600 μs for U-CUSE and F-CUSE, and 200 μs for M-CUSE. The ROIs shown in (a) were selected for all speed maps to measure the mean and standard deviation values of the background (red box) and the inclusion (black circle).
Fig. 7.
Bar plots of mean and standard deviation measurements of shear wave speed of the inclusion (a) and background (b) from different CUSE methods. The error bars are plotted from standard deviation. The error bar in (a) for U-CUSE at 15 μs reaches to about 11 m/s.
To provide a quantitative estimate of the performance of different CUSE methods, the SNR of shear wave speed measurements is calculated for the shear wave speed values given in Fig. 7. SNR is given by [23]:
where x̄ is the mean value of shear wave speed and σx is the standard deviation. To achieve consistent estimate of SNR, the same mean value of shear wave speed from 600 μs push of each CUSE method was used to estimate SNR. The SNR measurements versus push duration of different CUSE methods are summarized in Fig. 8. Similar to the observations from Fig. 7, the SNR of inclusion measurements from U-CUSE started to decrease at 60 μs, and the background started to decrease at 30 μs. F-CUSE and M-CUSE, however, provided consistent SNRs throughout all push duration set-ups. This indicates that F-CUSE and M-CUSE require shorter push durations to achieve shear wave speed maps with comparable SNR to U-CUSE.
Fig. 8.
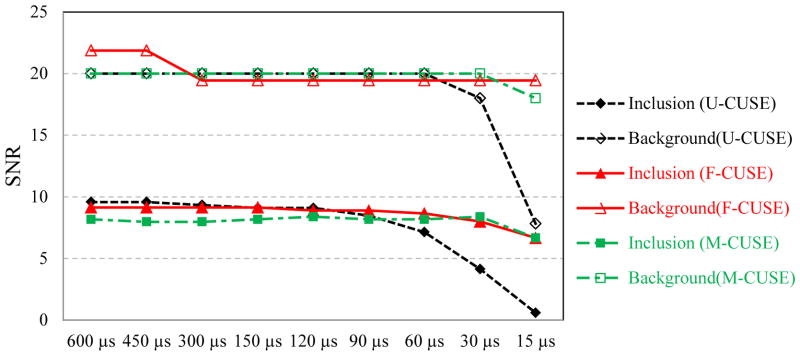
Plots of SNR of shear wave speed measurements of the inclusion and background from different CUSE methods.
Inclusion Phantom Experiment II
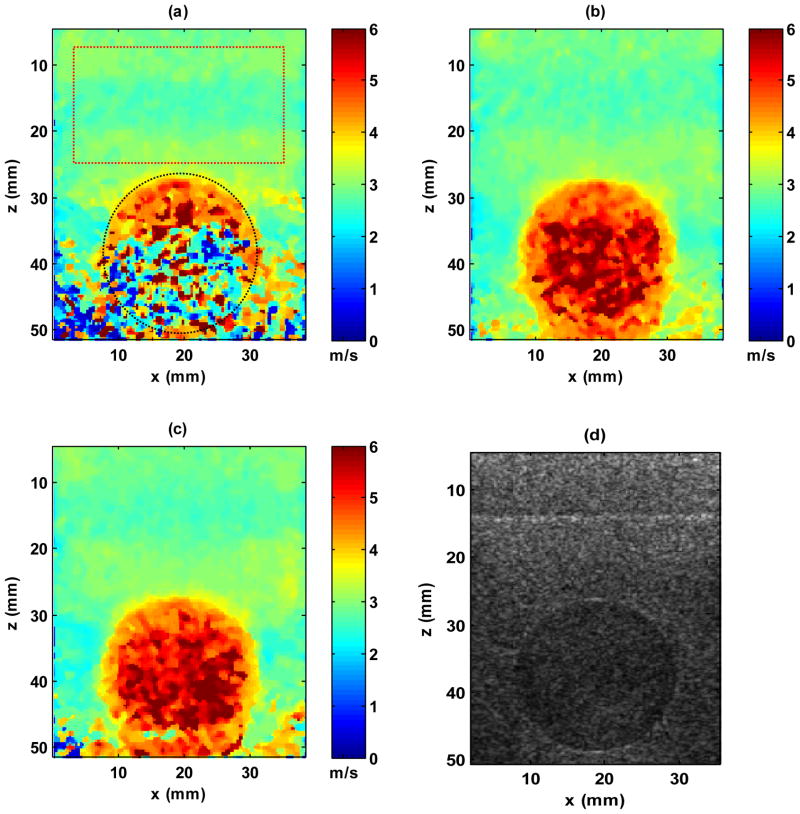
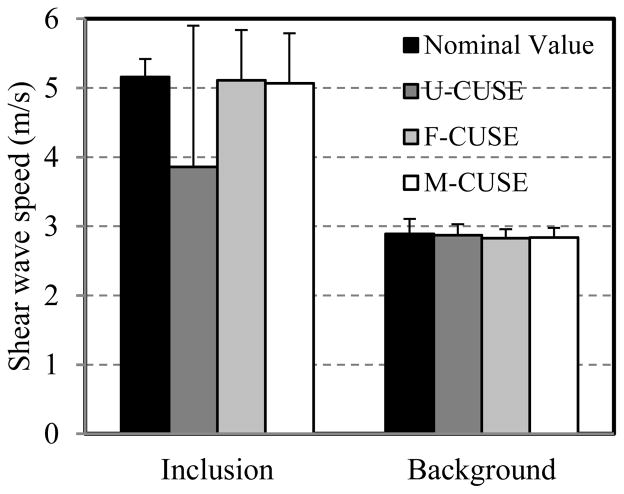
Another CIRS inclusion phantom (Elasticity QA Phantom, Model 049, CIRS Inc., Norfolk, VA) was used in this study to compare the penetration of different CUSE push beams. The sound speed of this phantom is 1545 ± 10 m/s and frequency dependent attenuation is 0.5 ± 0.05 dB/cm/MHz. In order to compare the robustness of different CUSE methods, the most challenging inclusion of this phantom was imaged, which has a nominal Young’s modulus of 80 ± 8 kPa and whose bottom is about 50 mm away from the phantom surface, as shown by the Bmode image in Fig. 9(d). The nominal Young’s modulus of the phantom background is 25 ± 4 kPa. Assuming that the shear modulus is equal to one third of Young’s modulus [24] and using Eqn. (1), the nominal shear wave speed values for the background and inclusion are 2.89 ± 0.22 m/s and 5.16 ± 0.26 m/s, respectively. Both U-CUSE and F-CUSE transmitted push beams with 600 μs duration and M-CUSE transmitted push beams with 200 μs duration. The focal depth was 40 mm for both F-CUSE and M-CUSE. The reconstructed shear wave speed maps are shown in Fig. 9. All shear wave speed maps were median-filtered with a 3 × 3 pixel spatial window. Both F-CUSE and M-CUSE provided smooth speed maps with good contrast between the inclusion and background. Compared with the B-mode image of Fig. 9(d), the shape of the inclusion was well preserved with sharp boundaries and no significant artifacts. For U-CUSE, however, since the inclusion is very stiff and deep, it was difficult to generate sufficient shear wave motion within the inclusion. Consequently, the shear wave estimate inside the inclusion was noisy and the inclusion is not delineated well. ROIs for the background and inclusion were selected to quantitatively measure the mean and standard deviation values of the shear wave speed of the inclusion and background, as shown in Fig. 9(a). The measured results are plotted in Fig. 10.
Fig. 9.
Reconstructed shear wave speed maps and the B-mode image for the inclusion in the CIRS phantom. (a) Shear wave speed map reconstructed using U-CUSE. The red rectangular box is the ROI for background shear wave speed measurement; the black circular ROI is for inclusion shear wave speed measurement. The same ROIs were used for both F-CUSE and M-CUSE. (b) Shear wave speed map reconstructed using F-CUSE. (c) Shear wave speed map reconstructed using M-CUSE. (d) B-mode image of the inclusion phantom.
Fig. 10.
Bar-plots of the mean and standard deviation values of the measured shear wave speeds of the inclusion and the background. The error-bars are plotted from the standard deviation values.
Fig. 10 shows that all CUSE-methods provided robust shear wave speed estimates of the background with excellent agreement to the nominal value. Moreover, F-CUSE and M-CUSE produced accurate estimates of the inclusion shear wave speed compared with the nominal value, while U-CUSE could not because of the noisy image of the inclusion. This indicates that both F-CUSE and M-CUSE have better penetration than U-CUSE and thus should be used in elasticity imaging of deep tissues (e.g., liver and kidney).
Inclusion Phantom Experiment III
To evaluate the near field performances of different CUSE methods, a shallow inclusion from the same CIRS breast elastography phantom as in “Inclusion Phantom Experiment I” was used. The origin of the inclusion is about 15 mm away from the surface of the phantom. The same set-ups were used for all CUSE methods except that the focal depth was set to be 15 mm for both F-CUSE and M-CUSE. The reconstructed shear wave speed maps are shown in Fig. 11. No spatial smoothing filters were applied to these maps. All CUSE methods could provide good contrast between the inclusion and background with sharp boundaries. The measured shear wave speed values within the ROIs as shown in Fig. 11 of U-CUSE are: 1.76 ± 0.09 m/s for background, 3.24 ± 0.36 m/s for inclusion; F-CUSE: 1.71 ± 0.09 m/s for background, 3.34 ± 0.31 m/s for inclusion; M-CUSE: 1.74 ± 0.08 m/s for background, 3.75 ± 0.47 m/s for inclusion. To quantitatively evaluate the preservation of the shape of the inclusion by different CUSE methods, the diameter of the inclusion was measured using both B-mode images of the phantom and CUSE shear wave speed maps. Five measurements were made for B-mode and each CUSE method, as indicated by the five dashed lines in Fig. 11(a). The mean and standard deviation values of these measurements are summarized in Table II. Table III shows the p values of Student’s t-tests for the diameter measurements among different methods. The results showed that the diameter measurements were statistically different between M-CUSE and the other methods. This is in accordance with the observation from Fig. 11 that both U-CUSE and F- CUSE well preserved the inclusion shape while M-CUSE generated a more square-shaped inclusion.
Fig. 11.

2D shear wave speed maps of a shallow inclusion from the breast inclusion phantom using (a) U-CUSE, (b) F-CUSE, and (c) M-CUSE. The black circle and the red rectangle indicate the ROIs that were selected to measure the shear wave speed of the inclusion and the background. The same ROIs were used for all maps. All shear wave speed maps use the same color scale and no spatial smoothing filter was applied. Five measurements of the inclusion diameter were made on each map, as indicated by the five dashed lines in (a).
Table II.
Inclusion diameter measurements by B-mode and CUSE shear wave speed maps
| B-mode | U-CUSE | F-CUSE | M-CUSE | |
|---|---|---|---|---|
| Diameter (mm) | 7.5 ± 0.34 | 7.4 ± 0.61 | 7.4 ± 0.36 | 8.3 ± 0.72 |
Table III.
p values of Student’s t-tests for the diameter measurements
| F-CUSE | M-CUSE | B-mode | |
|---|---|---|---|
| U-CUSE | 0.43 | p < 0.05 | 0.32 |
| F-CUSE | p < 0.05 | 0.34 | |
| M-CUSE | p < 0.05 |
Safety measurements
The measured safety parameters of U-CUSE, F-CUSE, and M-CUSE as well as the FDA regulatory limits are summarized in Table IV. All safety parameters are below FDA regulatory limits [25] for all CUSE methods.
Table IV.
Summary of measured safety parameters of all CUSE methods compared with FDA regulatory limit
| Safety Parameter | Maximum Values Measured | FDA Regulatory Limit | ||
|---|---|---|---|---|
|
| ||||
| U-CUSE | F-CUSE | M-CUSE | ||
|
|
||||
| MI0.3 | 0.9 | 0.45 | 0.46 | 1.90 |
| ISPPA,0.3 (W/cm2) | 109.4 | 33.6 | 34.6 | 190 |
| ISPTA,0.3 (mW/cm2) | 65.63 | 20.1 | 20.8 | 720 |
| TR (°C) | 0.005 | 0.018 | 0.006 | 6 |
DISCUSSION
Homogeneous phantom experiments showed that all three CUSE methods were capable of providing smooth 2D shear wave speed maps (Fig. 5) with accurate shear wave speed estimates compared with MRE and 1D TE (Table I). The first inclusion phantom experiment showed that all CUSE methods were capable of producing smooth shear wave speed maps with good contrast between the inclusion and background as well as sharp inclusion boundaries. There is no significant artifact in the speed maps. All CUSE methods were able to provide consistent estimates of shear wave speeds for both inclusion and background with decreased push durations (Fig. 7). Both F-CUSE and M-CUSE could sustain decreased push duration better than U-CUSE and were able to keep consistent SNR output (Fig. 8). Since no focusing occurs in the unfocused push, significant push beam energy is dissipated in the near-field and thus unfocused pushes usually require push beams with longer durations to produce comparable shear wave amplitudes to focused push. Therefore, when reducing the push duration, U-CUSE suffered from lack of shear wave motion first and failed to provide robust shear wave speed maps below 60 μs push duration.
The second inclusion phantom experiment demonstrated that greater push beam penetration and deeper imaging depths can be gained by using F-CUSE and M-CUSE. It is noticeable that this inclusion phantom is very challenging for elasticity imaging because the background shear modulus is close to 9 kPa, while the inclusion is close to 26 kPa and is about 5 cm from the transducer surface. Both F-CUSE and M-CUSE were able to preserve the shape of the inclusion and accurately estimate the shear wave speed values (Figs. 9 and 10), although the lower boundary of the inclusion was not well separated from background in Fig. 9(b) and (c) because of weak shear wave motion in this region. U-CUSE was not able to produce shear waves with sufficient amplitude in the inclusion and was only able to recover the shallow upper part of the inclusion.
The final shallow inclusion test showed that U-CUSE and F-CUSE better preserved the shape of the inclusion than M-CUSE in shallow imaging. One possible reason for this is that the push beam out of the focal plane is greatly diverged when a large aperture for push is used [22]. The diverged push beam generates shear waves with long wavelengths with low spatial resolutions. This results in smearing of the inclusion corners and distortion of the inclusion shapes. For FCUSE, however, since only 32 elements were used for each push beam, the divergence of the push beam is less than in M-CUSE and therefore less distortion of the inclusion shape occurred. One may have to further reduce the number of elements for each push beam for F-CUSE to image an even shallower inclusion, i.e. 20 elements for each push beam. The decreased shear wave energy due to reduced number of elements can be compensated for by using a larger number of push beams, i.e. 6 push beams with 20 elements for each push beam. For U-CUSE, the push beam divergence is minimal because the push beams are unfocused. Since shear waves generated by unfocused push beams are more planar and have stronger intensity in near field, UCUSE is ideal for shallow tissue imaging. One can also change the number of elements for each push beam as well as the total number of push beams for U-CUSE. Theoretically, a smaller aperture for the unfocused push will give narrower shear waveforms with shorter shear wavelengths and thus higher spatial resolution up to a point. Although shear wave amplitude will be lower with the smaller aperture of unfocused push, less attenuation occurs in near field and therefore it is feasible to decrease the aperture size. Meanwhile, reduced aperture size allows a larger number of push beams which can compensate for the loss of shear wave amplitude. Future study is needed to systematically optimize the comb-push beam set-ups for different tissue applications.
The focused comb-push and marching comb-push described here extend the imaging range of depth and flexibility of the CUSE method. The U-CUSE method has no control of ultrasound intensity and shear wave amplitude along the depth direction. Typically with unfocused comb-push, shear wave amplitude decreases with depth, with maximum amplitude occurring close to the transducer surface. F-CUSE and M-CUSE provide the flexibility to control the distribution of shear wave energy along the depth direction. This change, although conceptually not complicated, has important practical value. As shown in the second inclusion phantom experiment, they allow effective delivery of comb-push energy to a depth larger than what is achievable with U-CUSE. This beneficial feature will be important for applications such as liver imaging.
Comparsion with SSI and ARFI Shear Wave Imaging
The marching comb-push in M-CUSE divides the transducer elements into several overlapping sub-apertures to transmit multiple focused push beams sequentially for shear wave generation. While this is similar to the push beams used in SSI [5–7, 26–28] which is implemented in the Aixplorer ultrasound system (SuperSonic Imagine, Aix-en-Provence, France) and ARFI shear wave imaging [4, 29], there are several significant differences: 1. M-CUSE does not require shear wave detection between push beams, unlike ARFI shear wave imaging. The detection starts after the transmission of the last push beam and it is the comb-shaped shear wave field that marching comb-push is aiming to produce, not individual shear waves from each push beam. 2. M-CUSE distributes consecutive focused push beams in the lateral direction, unlike SSI in which consecutive focused push beams are distributed along the axial direction. 3. M-CUSE does not require a priori knowledge of the medium shear wave speed to chase down or go faster than the shear wave front to enhance the shear wave as introduced in [7]. In fact the marching speed of consecutive focused push beams was set to be as short as possible in order to detect the comb-shaped shear wave field as soon as possible. 4. M-CUSE can arbitrarily alter the push beam sequences, e.g. the order of the subgroup activations as in Fig. 1(c), because the order of the push beam transmissions is irrelevant to producing a comb-shaped shear wave field with multiple shear waves. This is different from SSI in which the consecutive focused push beams must be excited from top to bottom or from bottom to top, to construct a single shear wave with specific Mach numbers.
Note that all three CUSE methods produce a complex shear wave field with multiple shear waves to reconstruct a full FOV shear elasticity map with only one push-detection acquisition, while SSI and ARFI shear wave imaging require multiple push-detection acquisitions to reconstruct a full FOV map because of (1) absence of shear waves at the push beam region and (2) significant shear wave attenuation in areas that are far from the push beam region. Therefore, for full FOV 2D shear wave imaging, the frame rate of the CUSE methods will be higher than SSI and ARFI shear wave imaging. This higher frame rate will be important for imaging a beating heart or contracting skeletal muscle. SSI and ARFI shear wave imaging produce and analyze a single shear wave front at a time, while the CUSE methods produce and analyze multiple shear wave fronts simultaneously thanks to the directional filter which can differentiate shear waves propagating at different directions. The cross-correlation of multiple shear wave fronts (as shown below), also gives a narrower correlation peak for the CUSE methods than SSI and ARFI shear wave imaging, which suggests a more robust shear wave speed estimate from the CUSE methods.
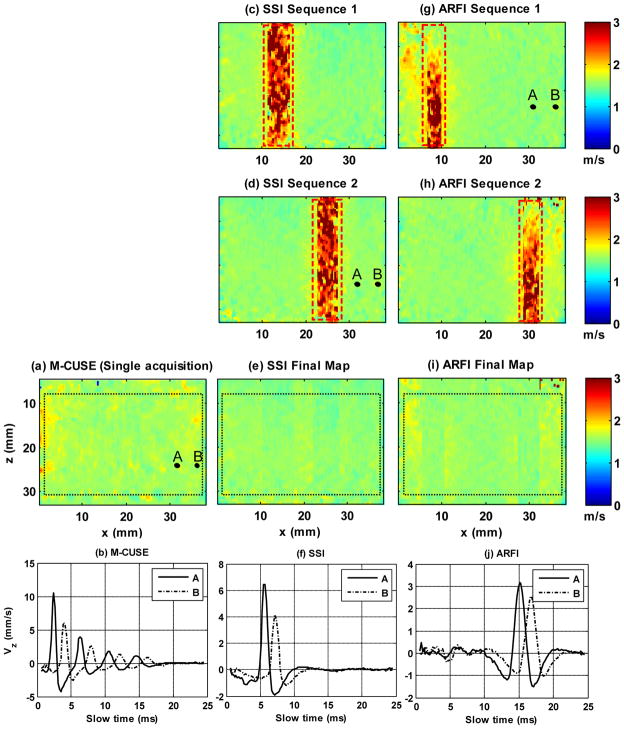
To illustrate the differences described above, a direct comparison of reconstructed shear wave speed maps from each imaging sequence, imaging speed and shear wave signal between M-CUSE, SSI and ARFI shear wave imaging (on the Verasonics system used for this study) was conducted on phantom 1. For M-CUSE, the same sequence introduced in the Materials and Methods section of this paper was used to image the phantom. The single data acquisition was about 25 ms. The reconstructed shear wave speed map is shown in Fig. 12(a). Fig. 12(b) also shows a typical pair of shear wave particle velocity waveforms after directional filtering that were used to recover local shear wave speed. Note that the four shear waves from the four push beams were used simultaneously for the cross-correlation calculation. The frame rate of the 2D shear wave speed map reconstructed by M-CUSE can reach approximately 1/25ms = 40 Hz in real-time imaging in principle (ignoring computational cost, thermal safety and transducer heating).
Fig. 12.
Comparisons between M-CUSE and SSI/ARFI shear wave imaging. (a) 2D shear wave speed map of phantom 1 reconstructed by M-CUSE. The black dashed box indicates the ROI used for shear wave speed measurements. The same ROIs were used for SSI and ARFI shear wave imaging. The shear wave speed within the ROI is 1.60 ± 0.07 m/s (mean ± std.). A and B indicate the spatial points from which the shear wave particle velocity signals were plotted, as shown in (b). (c) and (d) 2D shear wave speed maps of phantom 1 reconstructed from the first (c) and the second (d) SSI sequence. The red dashed box indicates the push beam area where the local shear wave speed could not be recovered properly. (e) The final full FOV shear wave speed map reconstructed by combining maps (c) and (d). The shear wave speed within the ROI is 1.54 ± 0.06 m/s (mean ± std.). (f) The shear wave particle velocity signals from points A and B that were used in cross-correlation calculation for local shear wave speed recovery in SSI. (g) and (h) 2D shear wave speed maps of phantom 1 reconstructed from the first (g) and the second (h) ARFI sequence. The red dashed box indicates the push beam area where the local shear wave speed could not be recovered properly. (i) The final full FOV shear wave speed map reconstructed by combining maps (g) and (h). The shear wave speed within the ROI is 1.55 ± 0.07 m/s (mean ± std.) (j) The shear wave particle velocity signals from points A and B that were used in cross-correlation calculation for local shear wave speed recovery in ARFI shear wave imaging.
For SSI, four consecutive focused push beams with focal depths of 6 mm, 14 mm, 22 mm, and 30 mm were transmitted. The F-number of each push beam was fixed to be 1. The push duration of each push beam was 150 μs. The time interval between consecutive push beams was 15 μs. Data acquisition started after the transmission of the last push beam and lasted for about 25 ms. The first set of SSI push (SSI Sequence 1) was positioned on the left side of the FOV, followed by a 25 ms data acquisition, and the reconstructed shear wave speed map is shown in Fig. 12(c). The second set of SSI push (SSI Sequence 2) was positioned on the right side of the FOV, followed by a 25 ms data acquisition, and the reconstructed shear wave speed map is shown in Fig. 12(d). Note that the push beam area in Figs.12(c) and (d) could not be properly recovered within each SSI sequence due to absence of shear waves in the push beam region. A final full FOV shear wave speed map (Fig. 12(e)) was then reconstructed by concatenating Figs. 12(c) and (d). The concatenation was done by averaging the areas of Sequences 1 and 2 without the push beams, filling the push beam area of Sequence 1 with Sequence 2 data, and filling the push beam area of Sequence 2 with Sequence 1 data. Since two SSI sequences were needed to reconstruct the full FOV shear wave speed map, the total data acquisition time needed was at least 25 + 25 = 50 ms. Consequently, the real-time imaging frame rate of SSI would be 20 Hz, half that of M-CUSE. According to [14], three SSI push sequences are typically needed to reconstruct a full FOV shear wave speed map – bringing the total data acquisition time to 25 + 25 + 25 = 75 ms, further reducing the frame rate. Also, as shown in Fig. 12(f), SSI processes a single shear wave front from each SSI sequence for cross-correlation, as opposed to M-CUSE (Fig. 12(b)).
For ARFI shear wave imaging, a single focused push beam with aperture size of 64 elements, focal depth of 25 mm (same as the individual focused push in M-CUSE) and push duration of 600 μs was used for each imaging sequence. The push duration was longer than in M-CUSE and SSI because only one push beam was transmitted. Data acquisition started immediately after the transmission of the push and lasted for 25 ms. The first ARFI push (ARFI Sequence 1) was transmitted on the left side of the FOV, followed by a 25 ms data acquisition, and the reconstructed shear wave speed map is shown in Fig. 12(g); the second ARFI push (ARFI Sequence 2) was transmitted on the right side of the FOV, followed by another 25 ms data acquisition, and the reconstructed shear wave speed map is shown in Fig. 12(h). Similar to SSI, ARFI shear wave imaging cannot reconstruct a full FOV shear wave speed map with only one push-detection acquisition. A similar concatenation method as used for SSI above was used to combine Figs. 12 (g) and (h) into a final full FOV shear wave speed map (Fig. 12(i)), bringing the total data acquisition time to 50 ms, and a single shear wave front (Fig. 12(j)) was used for cross-correlation, as opposed to M-CUSE (Fig. 12(b)).
A major difference between M-CUSE and SSI and ARFI shear wave imaging is that multiple shear waves are produced and processed simultaneously by M-CUSE, as shown in Fig. 12(b), Fig. 12(f) and Fig. 12(j). This allows more robust cross-correlation calculations of shear wave speed. Fig. 13 (a) shows a direct comparison of the normalized correlation coefficient plots from the shear wave signals of M-CUSE (Fig. 12(b)), SSI (Fig. 12(f)) and ARFI shear wave imaging (Fig. 12(j)). M-CUSE has a narrower correlation peak than SSI and ARFI, which suggests a more robust shear wave speed estimate from M-CUSE. To show that this relationship holds at different spatial locations, the cross-correlation function width of all imaging pixels within the black ROIs in Fig. 12 were calculated for M-CUSE, SSI and ARFI shear wave imaging. The width is given by measuring the full width at half maximum (FWHM) of the cross-correlation function. Fig. 13 (b) shows the mean and standard deviation values of the measured cross-correlation function widths among different modalities. Note that similar to the result in Fig. 13 (a), M-CUSE has a narrower cross-correlation function width than SSI and ARFI shear wave imaging. One possible reason is that M-CUSE cross-correlates multiple shear wave fronts, which should narrow the cross-correlation width. Another possible reason is that as the shear wave propagates away from the push beam, the high frequency component attenuates faster than the low frequency component, which widens the shear wave motion signal and consequently broadens the cross correlation function. Because M-CUSE distributes multiple focused push beams along the lateral direction so that each imaging pixel always has a shear wave source close by, the dominant shear wave front has a narrower time profile and consequently narrows the final cross-correlation function.
Fig. 13.
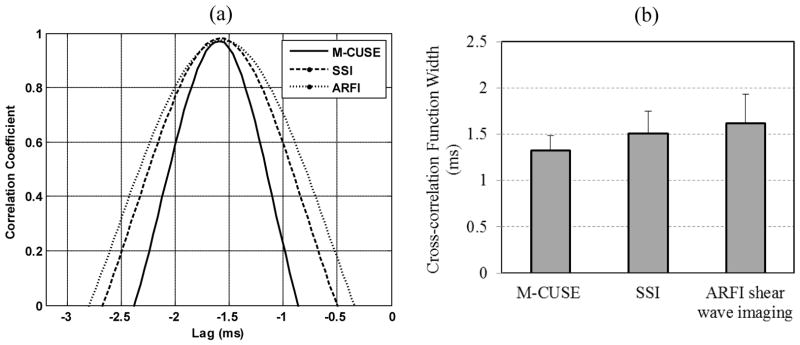
(a) Cross-correlation coefficient plots of the shear wave signals produced by M-CUSE (Fig. 12(b)), SSI (Fig. 12(f)), and ARFI shear wave imaging (Fig. 12(j)). (b) Bar-plots of the mean and standard deviation values of the measured cross-correlation function width of M-CUSE, SSI, and ARFI shear wave imaging within the ROI in Fig. 12. (a) (b) 25
This brief comparison study is not comprehensive, and future study is needed to fully investigate the differences among these methods. Table V summarizes the differences between M-CUSE, SSI and ARFI shear wave imaging (F-CUSE is included as well, since the conclusions for M-CUSE discussed above also apply to F-CUSE).
Table V.
Summary of the differences between F-CUSE/M-CUSE and SSI and ARFI shear wave imaging
| Number of push beams per acquisition | Push beam distribution | Push beam order | Data acquisition | Push beam area recovered push-detect recovered from one push-detect | Number of shear waves per acquisition | Potential Frame | |
|---|---|---|---|---|---|---|---|
| F-CUSE | Multiple | Simultaneously along lateral direction | Simultaneous | Single push-detect | Yes | Multiple | 40 Hz |
|
|
|||||||
| M-CUSE | Multiple | Sequentially along lateral direction | Arbitrary | Single push-detect | Yes | Multiple | 40 Hz |
|
|
|||||||
| SSI | Multiple | Sequentially along axial direction | Shallow to deep or opposite | Multiple push-detect | No | Single | < 20 Hz |
|
|
|||||||
| ARFI shear wave imaging | Single | N/A | N/A | Multiple push-detect | No | Single | < 20 Hz |
Limitations
One potential drawback of M-CUSE is that a shorter push duration (200 μs instead of 600 μs) has to be used, if maximum transducer heating is to be controlled at the same level for all CUSE configurations, because the center transducer elements are excited three times during the M-CUSE sequence. Shorter push duration suggests a weaker shear wave signal from each push beam, which will reduce the SNR of the shear wave signal and the robustness of the shear wave speed estimate. One can increase the push duration by reducing the number of push beams, i.e. having fewer overlapping beams. This will increase the amplitude of the shear wave signal from each push beam but reduce the total number of “teeth” in the comb-push beams. A future study is needed to balance the trade-off between the single shear wave amplitude and the total number of push beams.
One potential drawback of F-CUSE is that the total amount of acoustic energy is spread over all pushes that are transmitted simultaneously, which may cause the energy of individual push beam in F-CUSE to be lower than the push in conventional shear wave imaging methods [1, 4, 5] . However, the advantage of the simultaneous laterally distributed push beams is the significant increase in the frame rate of shear wave elasticity imaging. There is a trade-off between frame rate and the quality of the shear wave speed maps (i.e. the SNR of the shear wave which is related to the acoustic energy of the push beam). Conventional shear wave imaging methods like SSI have higher acoustic energy for the push beam but lower frame rate, while CUSE has higher frame rate but lower acoustic energy for each push beam. One can decrease the number of simultaneous focused push beams to increase the aperture size of each push beam in F-CUSE to increase the acoustic energy of individual push beams.
Because CUSE is not creating a constructively interfering diffraction pattern as in SSI, the individual shear wave SNR from CUSE may be lower than SSI. However, CUSE effectively increases the frame rate and overall SNR of shear wave imaging by distributing multiple push beam sources along the lateral direction to create multiple shear waves so that each imaging pixel will always have one or more push beam sources close by.
As shown in Fig. 6 and Fig. 7, the shear wave speed estimate for the inclusion is high for U-CUSE. This may be caused by the direct push beam on the inclusion: the inclusion was positioned directly under the center push beam. Different modes and complex interferences of shear waves with higher velocities may be excited within the inclusion with direct pushing, which may result in the overestimation. Also, although the directional filter used in this study can remove the artifacts caused by horizontally reflected shear waves as shown in [19], shear wave fronts can still be disturbed by the boundaries of the inclusions and thus propagate in various directions. This may result in artifacts because a lateral propagation direction of shear waves was assumed in this study when calculating local shear wave speeds. Future work including a finite element modeling (FEM) study is needed to address these issues. Also, all experiments in this study were conducted in phantoms. In vitro and in vivo tests on various soft tissues are needed in the future to optimize CUSE for different types of applications.
For safety measurements, the temperature rise and ISPTA were measured from only one push-detection acquisition. One may expect an increased TR and ISPTA when repeating CUSE measurements in real time. The temperature rise (TR) measurement of M-CUSE did not consider the fact that when transmitting multiple overlapping push beams, one can get peak heating in the near field of overlapping and adjacent acoustic radiation force excitations, especially in highly-attenuating media [30]. Since the TR measurement of M-CUSE from a single push was only 0.006 °C and only 4 overlapping focused push beams spaced out over a relatively large lateral 26 range were excited per image acquisition, one may still expect a low temperature rise even if the peak heating location would occur in the near field. Future study is needed to investigate the TR in continuous M-CUSE imaging where maximum heating is more likely to occur in near field. Finally, the safety measurements in this paper did not account for the effect of transducer surface heating. For the current set-up where the accumulated “ON” time for each element per acquisition was kept below a fixed duration Dmax (Dmax was equal to 600 μs in this paper), F-CUSE should produce the highest amount of transducer surface heating in continuous imaging because all the transducer elements are excited for Dmax for every acquisition. M-CUSE has lower transducer surface heating than F-CUSE because only some of the overlapping elements are excited for Dmax while the other elements are excited for less than Dmax. U-CUSE should also have lower transducer surface heating than F-CUSE because only part of the elements are excited per unfocused comb-push. Moreover, because only 60 elements are excited per combpush, one can alternate different combinations of unfocused push beams that are distributed at different lateral locations, which should reduce the transducer surface heating of U-CUSE. Future study will be needed to fully understand the transducer surface heating during continuous imaging.
Based on this study, U-CUSE and F-CUSE can be optimized for shallow tissue elasticity imaging, such as breast, skeletal muscle like biceps, and thyroid; F-CUSE and M-CUSE can be optimized for deeper tissue elasticity imaging, such as liver, kidney, spleen and heart. One can combine different CUSE methods to obtain strong shear wave signals in both near and far fields. Moreover, CUSE methods can also be implemented on other types of ultrasound transducers like curved and phased arrays, which have lower ultrasound center frequencies for better penetration.
CONCLUSIONS
This paper introduces two new versions of comb-push ultrasound shear elastography (CUSE) using focused ultrasound push beams: focused CUSE (F-CUSE) and marching CUSE (M-CUSE). Both new techniques, like the original unfocused CUSE (U-CUSE), can acquire a full FOV two-dimensional shear wave speed map with rapid data acquisition. Homogeneous and inclusion phantom results indicate that all CUSE methods were able to provide smooth 2D shear wave speed maps with accurate shear wave speed measurements and good contrast between the inclusion and background. This paper shows that both F-CUSE and M-CUSE achieved better shear wave penetration than U-CUSE and require shorter push durations to achieve shear wave speed maps with comparable SNR to U-CUSE, while U-CUSE and F-CUSE preserved the shape of the inclusion better than M-CUSE in shallow imaging. These promising results indicate that CUSE with various push beams can be used in a wide range of depths for soft tissue elasticity imaging. Future work includes application-oriented optimizations of CUSE based on in vitro and in vivo tissue experiments as well as implementation of CUSE on different types of transducers such as curved arrays and phased arrays.
Acknowledgments
This work was supported by NIH grants EB002167 and DK082408. The content is solely the responsibility of the authors and does not necessarily represent the official views of NIH. Mayo and some of the authors have financial interest in the technology described here. The authors thank Randall Kinnick for his experimental assistance.
References
- 1.Sarvazyan AP, Rudenko OV, Swanson SD, Fowlkes JB, Emelianov SY. Shear wave elasticity imaging: a new ultrasonic technology of medical diagnostics. Ultrasound Med Biol. 1998 Nov;24:1419–35. doi: 10.1016/s0301-5629(98)00110-0. [DOI] [PubMed] [Google Scholar]
- 2.Yamakoshi Y, Sato J, Sato T. Ultrasonic imaging of internal vibration of soft tissue under forced vibration. IEEE Trans Ultrason Ferroelectr, Freq Contr. 1990;37:45–53. doi: 10.1109/58.46969. [DOI] [PubMed] [Google Scholar]
- 3.Nightingale KR, Palmeri ML, Nightingale RW, Trahey GE. On the feasibility of remote palpation using acoustic radiation force. J Acoust Soc Amer. 2001 Jul;110:625–34. doi: 10.1121/1.1378344. [DOI] [PubMed] [Google Scholar]
- 4.Nightingale K, McAleavey S, Trahey G. Shear-wave generation using acoustic radiation force: in vivo and ex vivo results. Ultrasound Med Biol. 2003 Dec;29:1715–23. doi: 10.1016/j.ultrasmedbio.2003.08.008. [DOI] [PubMed] [Google Scholar]
- 5.Bercoff J, Tanter M, Fink M. Supersonic shear imaging: a new technique for soft tissue elasticity mapping. IEEE Trans Ultrason Ferroelectr, Freq Contr. 2004 Apr;51:396–409. doi: 10.1109/tuffc.2004.1295425. [DOI] [PubMed] [Google Scholar]
- 6.Bercoff J, Tanter M, Chaffai S, Fink M. Ultrafast Imaging of Beamformed Shear Waves Induced by the Acoustic Radiation Force. Application to Transient Elastography. 2002 IEEE International Ultrasonics Symposium; Munich, Germany. 2002. pp. 1899–1902. [Google Scholar]
- 7.Bercoff J. DOCTORAT DE PHYSIQUE PhD dissertation, Ecole Doctorale de Physique Macroscopique, UNIVERSITÉ PARIS 7 - DENIS DIDEROT. Paris, France: 2004. L’IMAGERIE ECHOGRAPHIQUE ULTRARAPIDE ET SON APPLICATION - A L’ETUDE DE LA VISCOELASTICITE DU CORPS HUMAIN; pp. 150–153. [Google Scholar]
- 8.McAleavey SA, Menon M, Orszulak J. Shear-modulus estimation by application of spatially-modulated impulsive acoustic radiation force. Ultrason Imag. 2007 Apr;29:87–104. doi: 10.1177/016173460702900202. [DOI] [PubMed] [Google Scholar]
- 9.Chen S, Urban MW, Pislaru C, Kinnick R, Zheng Y, Yao A, Greenleaf JF. Shearwave dispersion ultrasound vibrometry (SDUV) for measuring tissue elasticity and viscosity. IEEE Trans Ultrason Ferroelectr, Freq Contr. 2009 Jan;56:55–62. doi: 10.1109/TUFFC.2009.1005. [DOI] [PMC free article] [PubMed] [Google Scholar]
- 10.Chen S, Fatemi M, Greenleaf JF. Quantifying elasticity and viscosity from measurement of shear wave speed dispersion. J Acoust Soc Amer. 2004 Jun 28;115:2781– 5. doi: 10.1121/1.1739480. [DOI] [PubMed] [Google Scholar]
- 11.Hah Z, Hazard C, Mills B, Barry C, Rubens D, Parker K. Integration of crawling waves in an ultrasound imaging system. Part 2: signal processing and applications. Ultrasound Med Biol. 2012 Feb;38:312–23. doi: 10.1016/j.ultrasmedbio.2011.10.014. [DOI] [PMC free article] [PubMed] [Google Scholar]
- 12.Hazard C, Hah Z, Rubens D, Parker K. Integration of crawling waves in an ultrasound imaging system. Part 1: system and design considerations. Ultrasound Med Biol. 2012 Feb;38:296–311. doi: 10.1016/j.ultrasmedbio.2011.10.026. [DOI] [PMC free article] [PubMed] [Google Scholar]
- 13.Zhao H, Song P, Urban MW, Greenleaf JF, Chen S. Shear wave speed measurement using an unfocused ultrasound beam. Ultrasound Med Biol. 2012 Sep;38:1646–55. doi: 10.1016/j.ultrasmedbio.2012.05.015. [DOI] [PMC free article] [PubMed] [Google Scholar]
- 14.Tanter M, Bercoff J, Athanasiou A, Deffieux T, Gennisson JL, Montaldo G, Muller M, Tardivon A, Fink M. Quantitative assessment of breast lesion viscoelasticity: initial clinical results using supersonic shear imaging. Ultrasound Med Biol. 2008 Sep;34:1373–86. doi: 10.1016/j.ultrasmedbio.2008.02.002. [DOI] [PubMed] [Google Scholar]
- 15.Song P, Zhao H, Manduca A, Urban MW, Greenleaf JF, Chen S. Comb-Push Ultrasound Shear Elastography (CUSE): A Novel Method for Two-Dimensional Shear Elasticity Imaging of Soft Tissues. IEEE Trans Med Imag. 2012 Sep;31:1821–32. doi: 10.1109/TMI.2012.2205586. [DOI] [PMC free article] [PubMed] [Google Scholar]
- 16.Song P, Urban MW, Manduca A, Zhao H, Greenleaf JF, Chen S. Comb-push Ultrasound Shear Elastography (CUSE): A Novel and Fast Technique for Shear Elasticity Imaging. 2012 IEEE International Ultrasonics Symposium; Dresden, Germany. [Google Scholar]
- 17.Tanter M, Bercoff J, Sandrin L, Fink M. Ultrafast compound imaging for 2-D motion vector estimation: application to transient elastography. IEEE Trans Ultrason Ferroelectr, Freq Contr. 2002 Oct;49:1363–74. doi: 10.1109/tuffc.2002.1041078. [DOI] [PubMed] [Google Scholar]
- 18.Kasai C, Namekawa K, Koyano A, Omoto R. Real-time two-dimensional blood flow imaging using an autocorrelation technique. IEEE Trans Sonics Ultrason. 1985–1985 May;SU-32:7. [Google Scholar]
- 19.Deffieux T, Gennisson JL, Bercoff J, Tanter M. On the effects of reflected waves in transient shear wave elastography. IEEE Trans Ultrason Ferroelectr, Freq Contr. 2011 Oct;58:2032–5. doi: 10.1109/TUFFC.2011.2052. [DOI] [PubMed] [Google Scholar]
- 20.Manduca A, Lake DS, Kruse SA, Ehman RL. Spatio-temporal directional filtering for improved inversion of MR elastography images. Med Image Anal. 2003 Dec;7:465–73. doi: 10.1016/s1361-8415(03)00038-0. [DOI] [PubMed] [Google Scholar]
- 21.Harris FJ. Use of Windows for Harmonic-Analysis with Discrete Fourier-Transform. Proc IEEE. 1978;66:51–83. [Google Scholar]
- 22.Zhao H, Song P, Urban MW, Kinnick RR, Yin M, Greenleaf JF, Chen S. Bias observed in time-of-flight shear wave speed measurements using radiation force of a focused ultrasound beam. Ultrasound Med Biol. 2011 Nov;37:1884–92. doi: 10.1016/j.ultrasmedbio.2011.07.012. [DOI] [PMC free article] [PubMed] [Google Scholar]
- 23.Oosterveld BJ, Thijssen JM, Verhoef WA. Texture of B-mode echograms: 3-D simulations and experiments of the effects of diffraction and scatterer density. Ultrason Imag. 1985 Apr;7:142–60. doi: 10.1177/016173468500700204. [DOI] [PubMed] [Google Scholar]
- 24.Oliphant TE, Manduca A, Ehman RL, Greenleaf JF. Complex-valued stiffness reconstruction for magnetic resonance elastography by algebraic inversion of the differential equation. Magn Reson Med. 2001 Feb;45:299–310. doi: 10.1002/1522-2594(200102)45:2<299::aid-mrm1039>3.0.co;2-o. [DOI] [PubMed] [Google Scholar]
- 25.Herman BA, Harris GR. Models and regulatory considerations for transient temperature rise during diagnostic ultrasound pulses. Ultrasound Med Biol. 2002 Sep 29;28:1217–24. doi: 10.1016/s0301-5629(02)00558-6. [DOI] [PubMed] [Google Scholar]
- 26.Fink M, Tanter M. Procede et dispositif d'imagerie utilisant des ondes de cisaillement. France Patent FR 2844058, 09/02/2002. 2002
- 27.Muller M, Gennisson JL, Deffieux T, Tanter M, Fink M. Quantitative viscoelasticity mapping of human liver using supersonic shear imaging: preliminary in vivo feasibility study. Ultrasound Med Biol. 2009 Feb;35:219–29. doi: 10.1016/j.ultrasmedbio.2008.08.018. [DOI] [PubMed] [Google Scholar]
- 28.Bavu E, Gennisson JL, Couade M, Bercoff J, Mallet V, Fink M, Badel A, Vallet-Pichard A, Nalpas B, Tanter M, Pol S. Noninvasive in vivo liver fibrosis evaluation using supersonic shear imaging: a clinical study on 113 hepatitis C virus patients. Ultrasound Med Biol. 2011 Sep;37:1361–73. doi: 10.1016/j.ultrasmedbio.2011.05.016. [DOI] [PubMed] [Google Scholar]
- 29.Rouze NC, Wang MH, Palmeri ML, Nightingale KR. Parameters affecting the resolution and accuracy of 2-D quantitative shear wave images. IEEE Trans Ultrason Ferroelectr, Freq Contr. 2012 Aug;59:1729–40. doi: 10.1109/TUFFC.2012.2377. [DOI] [PMC free article] [PubMed] [Google Scholar]
- 30.Palmeri ML, Nightingale KR. On the thermal effects associated with radiation force imaging of soft tissue. IEEE Trans Ultrason Ferroelectr, Freq Contr. 2004 May;51:551–65. [PubMed] [Google Scholar]


