Abstract
Objective:
The objective of this study was to determine if acute cartilage impact damage could be predicted by a quantification of the frequency content of the impact force signal.
Design:
Osteochondral specimens excised from bovine lateral tibial plateaus were impacted with one of six impact energies. Each impact force signal underwent frequency analysis, with the amount of higher-frequency content (percentage of frequency spectrum above 1 kHz) being registered. Specimens were histologically evaluated to assess acute structural damage (articular surface cracking and cartilage crushing) resulting from the impact.
Results:
Acute histologic structural damage to the cartilage had higher concordance with the high-frequency content measure than with other mechanical impact measures (delivered impact energy, impact maximum stress, and impact maximum stress rate of change).
Conclusions:
This result suggests that the frequency content of an impact force signal, specifically the proportion of higher-frequency components, can be used as a quick surrogate measure for acute structural cartilage injury. Taking advantage of this relationship could reduce the time and expense of histologic processing needed to morphologically assess cartilage damage, especially for purposes of initial screening when evaluating new impaction protocols.
Keywords: articular cartilage, histology, impact testing, impact injury, posttraumatic osteoarthritis
Introduction
Injury to articular cartilage, such as that sustained during a joint impact, can initiate a cascade of pathomechanical and pathobiological events that can culminate in widespread cartilage destruction and posttraumatic osteoarthritis. Controlled impaction of articular cartilage provides a reductionist model for study of posttraumatic osteoarthritis as a sequela of cartilage injury. Typically, cartilage explant specimens are struck with an impactor, and the resulting chondrocyte viability, chondrocyte metabolism, and/or structural damage is compared to nonimpacted controls. Mechanical measures from the impact itself, such as maximum force (or stress) and rise time, are also commonly measured, via an accelerometer or dynamic load cell integrated with the cartilage impaction device. Increased severity of the applied impact generally results in higher levels of acute structural or cellular damage to the cartilage.1-7 This cartilage impact model can be used to study early progression of postimpact cartilage degeneration, and to investigate pharmaceutical treatments that could ultimately be applied acutely after an in vivo cartilage injury to mitigate cartilage degeneration and therefore prevent the development of posttraumatic osteoarthritis.
Determining cartilage impact damage histologically (or biochemically) requires appreciable time and expense for processing each specimen. An osteochondral specimen with around 10-mm thickness of bone can require 6 to 8 weeks for decalcification, followed by about 5 hours of histologist time to complete the processing of a section. In contrast, mechanical measures from the impact can be quickly and easily determined directly from the impact force signal. Analysis of the frequency spectrum of an impact signal is a means by which the shape of an impact force signal, including its roughness or irregularity, can be quantified. The frequency content of an impact signal, including the proportion of low- versus high-frequency content, is affected by the irregularity of the signal and by the signal’s overall shape.8,9 Previous investigators have reported cartilage impact mechanical signals of varying shapes or irregularities,2,4-6,10-14 but without quantification of these factors.
The objective of this study was to determine if acute cartilage impact damage could be predicted by a quantification of the frequency content of the impact force signal, namely, the percentage of the total signal involving high frequency (> 1 kHz). The hypothesis was that there would be a positive relationship between high-frequency content of the impact force signal and histologically apparent structural damage.
Methods
Osteochondral specimens measuring approximately 25mm square were excised from skeletally mature bovine lateral tibial plateaus (12-24 months) within 24 hours of animal death. Each specimen was attached to a stainless steel plate, using polycaprolactone as a mechanical bonding agent (Fig. 1a). This plate allowed specimen position and orientation to be maintained between the impacting and harvesting devices.
Figure 1.
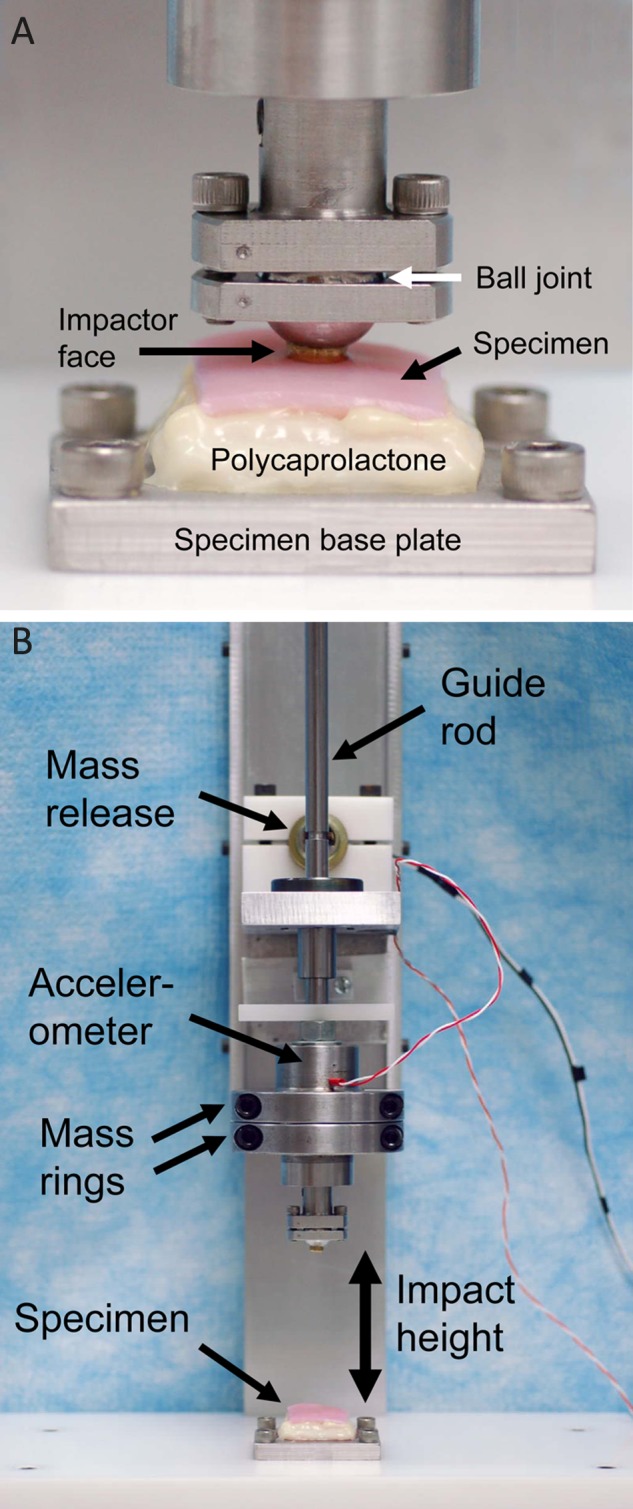
Drop tower for impaction of osteochondral specimens: (a) close-up of specimen and impactor tip and (b) entire drop tower.
Cartilage Impaction
Each specimen was impacted once at its middle, using a drop tower (Fig. 1b). The drop tower allowed for control of the delivered impact energy, by varying the mass and drop height. The impact mass included a guide rod, an accelerometer (98,000 m/s2 range, 0.044 mV/(m/s2) sensitivity, Model 350B23, PCB Piezotronics, Depew, NY), and removable rings clamped around the accelerometer for increasing impact mass. The impact mass was suspended at the desired height above the cartilage surface by a pawl inserted into a groove in the guide rod and attached to a solenoid. A manual switch simultaneously triggered data collection from the accelerometer and activated the solenoid, thus retracting the pawl and causing mass release. The impact accelerometer data were recorded by VI Logger (National Instruments, Austin, TX) at 100 kHz (i.e., sampled every 10 µs). The impactor tip was a brass cylinder having a flat end with a rounded edge (curvature radius, 0.75 mm) and an effective diameter of 5.5 mm. This impactor tip shape was chosen as a compromise between a sharper-edged impactor tip and a spherical impactor tip, based on a finite element analysis of cartilage impaction.15 This finite element analysis demonstrated that a sharper-edge impactor tip results in an increase in spatial gradients of shear strain within the cartilage, while a more spherical impactor tip results in an increase in spatial gradients of normal strain within the cartilage. The impactor tip was attached to a ball joint. With the ball joint unlocked, the impactor tip could rotate freely, and when touched down onto the cartilage surface preimpact, the impactor tip aligned parallel to the cartilage surface. The ball joint was then locked into position to maintain the impactor tip alignment for the impact. The cartilage surface was kept wet with frequent application of culture medium.
Each specimen was impacted with one of six impact energies, expressed as energy per unit area impacted. Impact energies were 1.24, 2.48, or 3.71 J/cm2 (impact mass, 0.59 kg; drop heights, 50.8, 101.6, and 152.4 mm, respectively) and 1.09, 2.18, or 3.27 J/cm2 (impact mass, 1.04 kg; drop heights, 25.4, 50.8, and 76.2 mm, respectively). These cartilage impacts fit the definitions of impact loading of articular cartilage as suggested by Aspden et al.,16 as rise times were on the order of 1 to 2 microseconds, and the maximum stress rates of change were greater than 1 GPa/s. For each impact energy, sample size was 5 to 7, with a total of 36 specimens evaluated.
Mechanical Analysis
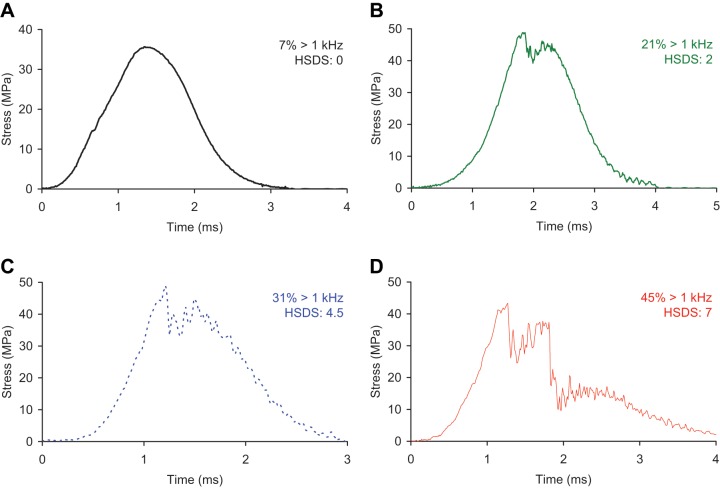
Impact acceleration data were multiplied by the impact mass to obtain force data, then divided by the impactor tip’s area (determined by its effective diameter) to obtain stress data. Each impact stress-versus-time signal was zero-padded17 to 4,096 data points, for frequency analysis by fast Fourier transform. The frequency resolution was 24.4 Hz (the time-domain sampling frequency of 100 kHz divided by 4,096 data points). The drop tower system had a resonant frequency18 of around 5 kHz; the resonant peak was digitally removed by setting to zero the signal between 4,300 and 6,000 Hz. The filtered signal underwent inverse fast Fourier transform to convert it back to stress versus time (Fig. 2), and maximum stress and maximum stress rate of change of the impact signal were then calculated. Stress rates of change (from which the maximum was chosen) were calculated as the slope measured over 15-point intervals, with the starting point ranging from the beginning of the impact signal to the maximum of the impact signal.
Figure 2.
Impact stress-versus-time signals from bovine osteochondral specimens. These impact signals demonstrate a range of the percentage of the signal’s frequency spectrum greater than 1 kHz (% > 1 kHz) and the corresponding histologic structural damage scores (HSDSs).
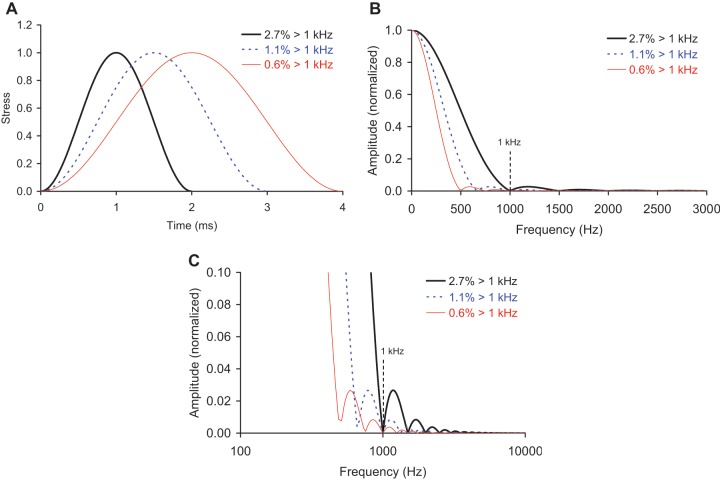
The amount of higher-frequency content in each impact signal was also calculated. Idealized impact signals consisting of single sine cycles8 with periods similar to those seen with the actual impacts (2-4 ms) have minimal frequency content greater than 1 kHz (Fig. 3). Therefore, the amount of higher-frequency content for each experimental impact signal was calculated as the percentage of the signal’s frequency spectrum greater than 1 kHz (Fig. 4).
Figure 3.
(a) Single sine cycles, representing idealized cartilage impact signals with periods similar to those seen in the actual impacts in this study, and frequency spectra of these idealized signals, showing the (b) lower frequencies (plotted on a linear scale) and (c) higher frequencies (plotted on a semilogarithmic scale). These signals had minimal frequency content greater than 1 kHz, so the amount of higher-frequency content for the experimental impact signals was calculated as the percentage of the signal’s frequency spectrum greater than 1 kHz.
Figure 4.
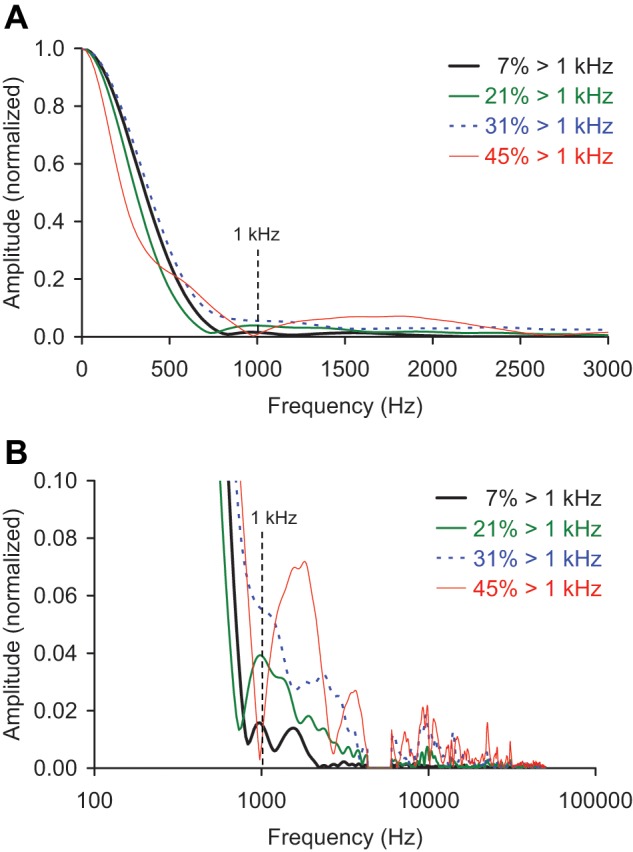
Frequency spectra of the impact signals from Figure 2, normalized by specimen and showing the (a) lower frequencies (plotted on a linear scale) and (b) higher frequencies (plotted on a semilogarithmic scale). A resonant peak at around 5 kHz was removed.
Histologic Analysis
Specimens were harvested for histologic analysis to quantify acute structural damage resulting from the impact. Following OARSI guidelines for histologic preparation,19 specimens were fixed in neutral-buffered 10% formalin and subsequently decalcified in 5% formic acid. Decalcified specimens were divided first in the sagittal plane through the center of the impact site and second in a frontal plane through the center of the impact site. The quartered sections were embedded in paraffin wax for sectioning parallel to the sagittal cut. After discarding the first 100 µm of sectioned tissue (to avoid preparation artifact), 5-µm-thick sections were selected and stained with Safranin O per guidelines. Sections were digitized using a QICAM digital camera (Qimagin, Burnaby, BC, Canada) through a 4x objective lens at a resolution of 862 pixels per millimeter on a stepper-motor-driven microscope stage (Prior Scientific, Rockland, MA) and reconstructed into high-resolution JPEG images (ImagePro, MediaCybernetics, Bethesda, MD). The sections were oriented such that the right edge corresponded to the center of the impact site (Fig. 5). Tissue within approximately 8 mm of the impact site was evaluated for acute structural damage. Care was taken to avoid including any obvious histologic artifacts (folds, tears, etc.) in the analysis.
Figure 5.
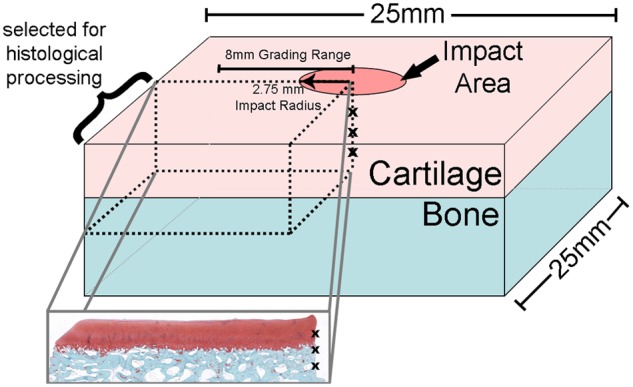
Location of histologic section relative to the whole explant. The center of the impact area (indicated as a column of x’s) is on the right side of the resulting histology section. Tissue within approximately 8 mm of the impact site was evaluated for acute structural damage.
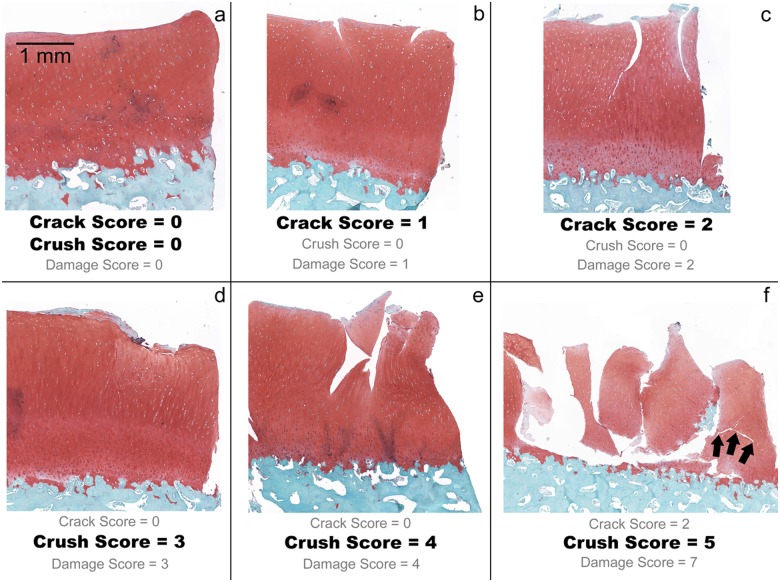
Each digitized section was evaluated by applying an 8-point histologic scale purposefully designed to quantify acute mechanical damage sustained by the cartilage (Fig. 6). This acute histologic structural damage score (HSDS) was developed to describe acute mechanical damage to the substance of the cartilage (i.e., independently of any biologic response), and quantifies structural damage characteristics in terms of both articular surface cracking and cartilage crushing. A crack score was assigned independently of a crushing score, and then the two scores were summed to obtain an overall damage score. Cracks were defined as discrete fissures originating from the cartilage surface and passing through cartilage with a similar Safranin O staining pattern and cellular organization as cartilage from the nonimpacted region. Crush was defined as depression of the impacted region relative to the native surface or as disruption of the cartilage matrix evidenced by a rearrangement in normal cellular organization and highly variable Safranin O staining.
Figure 6.
Examples of histologic structural damage scores: (a) no damage, crack and crush scores of 0; (b) 2 small superficial zone cracks, crack score of 1; (c) 2 large cracks penetrating the radial cartilage layer with increased crack tortuosity, crack score of 2. These examples do not have a crush injury and thus would receive a crush score of 0. (d) The surface is crushed mildly into the underlying cartilage, and there is a small amount of fragmentation at the surface—crush score of 3. (e) This example is crushed through greater than 50% of the cartilage thickness as evidenced by disruption of the cartilage matrix—crush score of 4. (f) The cartilage is severely fragmented, and there is complete loss of continuity across the injury zone—crush score of 5. The very tortuous crack (arrows) in this specimen led to the assignment of a 2 for the crack score and thus a total score of 7 for this specimen.
Articular surface crack damage was given a score of 0, 1, or 2. Absence of visible crack damage received a crack score of 0 (Fig. 6a). Specimens with small cracks located within the superficial zone or transitional zone were scored as a 1 (Fig. 6b). Cracks demonstrating increased tortuosity and/or penetration to the radial or deep cartilage layer were scored as a 2 (Fig. 6c). Zone definitions were based on cellular organization.
Cartilage crush was given a score of 0 (no crush), 3, 4, or 5. The cartilage crush score was assigned independently of of the articular surface crack score. Crushed cartilage was considered a histologic sign of greater injury than was cracked cartilage and was thus assigned higher numerical values. Crushed cartilage invariably had a greater 2-dimensional zone of injury area compared to cartilage that was only cracked, even if the latter demonstrated multiple cracks. Also, in more severely damaged specimens, crushed cartilage demonstrated physical separation of cartilage from the underlying subchondral bone, a finding that was never observed in cartilage sustaining only cracks. Specimens with crush that affected less than 50% of the cartilage thickness were assigned a crush score of 3 (Fig. 6d). Crush ranging from greater than 50% of the cartilage thickness to a full-thickness crush, including crush damage in the deep layer of cartilage, or with separation of the cartilage/bone interface, was assigned a score of 4 (Fig. 6e). Finally, obliterating crush with loss of the cartilage architecture and severe fragmentation was scored as a 5 (Fig. 6f).
The articular surface crack score was added to the cartilage crush score to get a total specimen structural damage score, ranging from 0 to 7. It was possible in principle to have an elevated crush score with no cracking; however, the more crushed specimens typically demonstrated concomitant cartilage cracking (Fig. 6f).
Three experienced observers who were blinded to the impact history of the specimens applied the scoring scale to the histologic sections on 2 occasions separated by 7 days, yielding 6 separate scorings for each specimen. The 6 scores were averaged to yield a mean value for each specimen. For comparison to the HSDS, each observer also rank ordered the histologic sections by subjective amount of damage.
Statistical Analyses
Statistical analyses were done using Minitab Statistical Software (Minitab Inc., State College, PA) or Excel. Concordance20 was calculated between the specimen-averaged HSDS and the 4 impact mechanical measures—delivered impact energy, impact maximum stress, impact maximum stress rate of change, and the high-frequency content measure. To calculate concordance, the HSDSs and all impact mechanical measures were each converted to their rank orders. Next, all pairings of specimens were compared; a specimen pair was deemed concordant if, when their respective HSDSs were different in one direction (i.e., specimen 2’s damage score greater than specimen 1’s damage score), their respective mechanical measures were also different in that same direction (i.e., specimen 2’s mechanical measure was also greater than specimen 1’s mechanical measure). Concordance is the number of concordant pairs divided by the total number of specimen pairings. The range of the concordance measure is therefore between 0 (perfect negative agreement) and 1 (perfect positive agreement), with 0.5 indicating chance agreement. Concordance was calculated for all data, for each impact mass separately, and for noncrushed versus crushed specimens (HSDSs of ≤ 2 and > 2, respectively). Data were segregated by impact mass because previous studies had demonstrated that impacting cartilage with the same energy but different masses demonstrated differences in the resulting mechanical, histologic, or biochemical measures.1,3,7 Concordance also was calculated between the HSDS and the subjective rank order damage of the specimens.
For the HSDSs, an intraclass correlation coefficient (ICC) was calculated to evaluate agreement between the observers. (The ICC is a standard method for evaluating rater reliability, with a value of 1 indicating perfect agreement between all raters and days and 0 being no agreement.21) Additionally, a linearly weighted kappa statistic was calculated for each of the three observers to evaluate intraobserver agreement of HSDSs assigned on the 2 different evaluation days.
Results
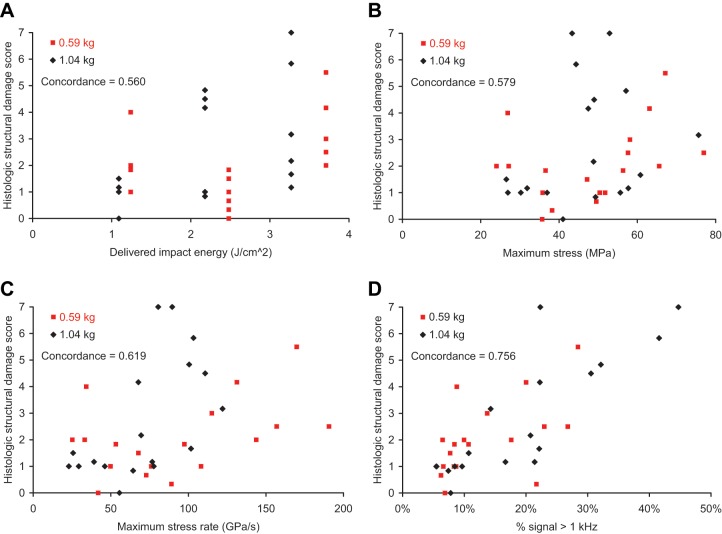
The concordance between the high-frequency content measure and the HSDS was stronger than the concordances between the other impact mechanical measures and the HSDS (Table 1a, Fig. 7), both for the data as a whole and for each individual impact mass. This was also the case for the specimens when segregated by noncrushed versus crushed, especially so for the crushed specimens (Table 1b). (Three specimens had an average HSDS between 2 and 3; these specimens were classified as crushed.) Impact signals that were smoother tended to be associated with less structural damage. For example, an impact signal with a high-frequency content measure of 7% (Fig. 2a) had an HSDS of 0 (Fig. 6a). Rougher and more irregular impact signals tended to be associated with more structural damage (Fig. 2b-2d)—for example, an impact signal with a high-frequency content measure of 45% (Fig. 2d) having an HSDS of 7 (Fig. 6f). Cartilage specimens impacted with the same energy demonstrated a range of structural damage, especially at the higher impact energies (Fig. 7a). Impact maximum stress (Fig. 7b) and maximum stress rate of change (Fig. 7c) had reduced concordance with the HSDS, as compared to the high-frequency content measure (Fig. 7d).
Table 1.
Concordance for Impact Mechanical Measures Versus Acute Cartilage Histologic Structural Damage Score (HSDS)
| Data as a Wholea | All Data | Low Mass | High Mass |
|---|---|---|---|
| Impact energy | 0.560 | 0.444 | 0.542 |
| Maximum stress | 0.579 | 0.634 | 0.556 |
| Maximum stress rate of change | 0.619 | 0.608 | 0.673 |
| % signal > 1 kHz | 0.756 | 0.706 | 0.843 |
| Noncrushed vs. Crushedb | HSDS ≤ 2 | HSDS > 2 | |
| Impact energy | 0.390 | 0.297 | |
| Maximum stress | 0.450 | 0.374 | |
| Maximum stress rate of change | 0.437 | 0.385 | |
| % signal > 1 kHz | 0.558 | 0.703 |
For the data as a whole and for each separate impact mass, the strongest concordance emerged for the high-frequency content measure (% signal > 1 kHz).
For specimens segregated by noncrushed (HSDS ≤ 2) and crushed (HSDS > 2), the strongest concordance was also for the high-frequency content measure, especially so for the crushed specimens.
Figure 7.
Cartilage acute histologic structural damage score versus (a) delivered impact energy, (b) impact maximum stress, (c) impact maximum stress rate of change, and (d) percentage of the signal’s frequency spectrum greater than 1 kHz (% signal > 1 kHz).
The linearly weighted kappa statistics indicated good intraobserver agreement in the HSDSs assigned by the 3 observers on the 2 different evaluation days (κ = 0.824, 0.795, and 0.718). The ICC between the 3 observers on the average HSDS assigned to the histologic specimens was 0.880, indicating very good interobserver agreement. There was high concordance (0.875) between the subjective rank order of damage and the HSDS.
Discussion
The high-frequency content measure had higher concordance with acute histologic structural damage than did delivered impact energy, impact maximum stress, or impact maximum stress rate of change. This suggests that the frequency content of an impact signal, specifically the proportion of higher-frequency components, could be used as a quick surrogate measure for acute cartilage injury. The crushed specimens had more of an increase in concordance from the other mechanical measures to the high-frequency content measure than did the noncrushed specimens, indicating that this surrogate measure is especially useful for distinguishing among highly damaged specimens. Taking advantage of this relationship could reduce the time and expense of histologic processing needed to morphologically assess cartilage damage, especially for purposes of initial screening when evaluating new impaction protocols.
Impacted cartilage specimens with a comparable amount of high-frequency content demonstrated some variability in the amount of structural damage. Besides inherent biological variability, the histologic slice evaluated may not necessarily have intersected the region of cartilage most representative of the overall damage. Slice selection is an inherent limitation of histologic work; however, the sections used proved adequate for developing the relationship between acute structural cartilage damage and the high-frequency content measure. Imaging approaches such as confocal microscopy could be used in place of (or in addition to) histologic characterization of cartilage explant impact damage. However, confocal microscopy does not allow cross-sectional imaging of cartilage, is limited to a depth of about 200 µm, and also requires time for the imaging procedure and data analysis (although without the multiweek decalcification delay required with histologic processing). Another limitation was that cartilage thickness was not included as an independent variable. The 1 kHz high-frequency threshold was based on the frequency content of idealized (single sine cycle) impact signals that were similar to those seen with the impacts recorded in this study (and consistent with the 1- to 2-microsecond cartilage impact rise time range suggested by Aspden et al.16). However, in this study, greater high-frequency thresholds, specifically 1.5, 2, 2.5, 3, 3.5, and 4 kHz, resulted in fairly similar (although decreasing) concordances with the HSDS (ranging from 0.746 to 0.737), indicating relative insensitivity to the threshold chosen. Also, the linkage between frequency content and structural damage reported here has been demonstrated only for benchtop explant impactions and has not been studied for whole-joint in situ impactions.
The histologic scoring system introduced here, the HSDS, was designed to quantify only the acute structural cartilage injury resulting from impact. Current histologic scales of cartilage damage, such as those of the Mankin HHGS,22 OARSI,19 or ICRS,23 are not fully suitable for acutely damaged cartilage and are thus not comparable to the HSDS. Those existing scoring systems do quantify extent of structural damage but are also explicitly or implicitly based on cartilage degeneration resulting from a prolonged biological response. The HSDS also distinguishes between cartilage that is cracked versus more severely injured cartilage that has been crushed. The Mankin HHGS,22 OARSI,19 and ICRS23 scales do not distinguish crushing from cracking. Based on the high ICC value of 0.880 and the high kappa statistics (0.824, 0.795, and 0.718)—indicating very good interobserver and intraobserver agreement, respectively—the HSDS was reliable and reproducible. This HSDS was consistent with the subjective rank ordering of specimen damage, with high concordance (0.875) between the two.
Cartilage impact mechanical signals reported by previous investigators have displayed varying shapes,2,4-6,10-14 and a few investigators have commented on the significance of these shapes. Burgin and Aspden13 presented impact stress-strain and modulus-strain curves corresponding to 3 types of visually observed damage of impacted cartilage specimens. Those with no apparent damage, those with mild to moderate damage, and those that split into two had impact curves that were increasingly irregular. Repo and Finlay4 attributed a “sudden discontinuity” in an impact signal to structural failure of the cartilage. Their 2 specimens showing such a discontinuity also had visible cartilage fissuring or rupture and had been tested at higher strains; their 2 specimens without any of these features had been tested at lower strains. Thambyah and Broom14 showed a smooth impact signal typical of when damage stayed within the upper third of the cartilage matrix and a less regular impact signal, with multiple peaks, typical of when damage propagated deeper into the cartilage matrix and osteochondral region. Scott and Athanasiou5 reported that the impact signals with their lower impact level had more variable shapes and more likelihood of multiple peaks, as compared to their higher impact level. They also suggested that the shape of the impact signal could be a function of the energy absorption rate of the impact surface. Duda et al.2 mentioned that the slight variability in their impact force (and impact displacement) curves could result from variations in specimen joint geometry or cartilage thickness. In the current study, greater roughness or irregularity in the impact signal (i.e., a greater proportion of higher-frequency content) was associated with more acute structural damage to the cartilage.
In summary, the concordance between the high-frequency content measure and acute cartilage impact damage suggests that quantitative evaluation of an impact’s frequency content can be used as a surrogate assessment of acute structural cartilage injury, and that this measure performs better for that purpose than do delivered impact energy, impact maximum stress, or impact maximum stress rate of change. This relationship could have practical utility, especially for screening impact levels at the exploratory stage of new test protocols, by reducing the amount of histologic processing needed.
Acknowledgments
The authors thank Dr. Steve Hillis, Ms. Gail Kurriger, Ms. Abigail Lehman, Dr. M. James Rudert, and Ms. Sarah Wiechert. This research was funded by NIH P50 AR055533.
Footnotes
Declaration of Conflicting Interests: The author(s) declared no potential conflicts of interest with respect to the research, authorship, and/or publication of this article.
References
- 1. Jeffrey JE, Gregory DW, Aspden RM. Matrix damage and chondrocyte viability following a single impact load on articular cartilage. Arch Biochem Biophys. 1995;322(1):87-96. [DOI] [PubMed] [Google Scholar]
- 2. Duda GN, Eilers M, Loh L, Hoffman JE, Kaab M, Schaser K. Chondrocyte death precedes structural damage in blunt impact trauma. Clin Orthop Relat Res. 2001;393:302-9. [DOI] [PubMed] [Google Scholar]
- 3. Jeffrey JE, Thomson LA, Aspden RM. Matrix loss and synthesis following a single impact load on articular cartilage in vitro. Biochim Biophys Acta. 1997;1334(2-3):223-32. [DOI] [PubMed] [Google Scholar]
- 4. Repo RU, Finlay JB. Survival of articular cartilage after controlled impact. J Bone Joint Surg Am. 1977;59(8):1068-76. [PubMed] [Google Scholar]
- 5. Scott CC, Athanasiou KA. Design, validation, and utilization of an articular cartilage impact instrument. Proc Inst Mech Eng H. 2006;220(8):845-55. [DOI] [PubMed] [Google Scholar]
- 6. Verteramo A, Seedhom BB. Effect of a single impact loading on the structure and mechanical properties of articular cartilage. J Biomech. 2007;40(16):3580-9. [DOI] [PubMed] [Google Scholar]
- 7. Atkinson PJ, Ewers BJ, Haut RC. Blunt injuries to the patellofemoral joint resulting from transarticular loading are influenced by impactor energy and mass. J Biomech Eng. 2001;123(3):293-5. [DOI] [PubMed] [Google Scholar]
- 8. Cain PJ. Digital filtering of impact data. In: Kessler SL, Adams GC, Driscoll SB, Ireland DR, editors. Instrumented impact testing of plastics and composite materials, ASTM STP 936. Philadelphia: American Society for Testing and Materials; 1987. p. 81-102. [Google Scholar]
- 9. Del Rio TG, Perez JR. Elastic wave propagation in cylindrical bars after brittle failures: application to spalling tests. Int J Impact Eng. 2007;34:377-93. [Google Scholar]
- 10. Atkinson TS, Haut RC, Altiero NJ. Impact-induced fissuring of articular cartilage: an investigation of failure criteria. J Biomech Eng. 1998;120(2):181-7. [DOI] [PubMed] [Google Scholar]
- 11. Burgin LV, Aspden RM. A drop tower for controlled impact testing of biological tissues. Med Eng Phys. 2007;29(4):525-30. [DOI] [PubMed] [Google Scholar]
- 12. Haut RC, Ide TM, De Camp CE. Mechanical responses of the rabbit patello-femoral joint to blunt impact. J Biomech Eng. 1995;117(4):402-8. [DOI] [PubMed] [Google Scholar]
- 13. Burgin LV, Aspden RM. Impact testing to determine the mechanical properties of articular cartilage in isolation and on bone. J Mater Sci Mater Med. 2008;19(2):703-11. [DOI] [PubMed] [Google Scholar]
- 14. Thambyah A, Broom N. How subtle structural changes associated with maturity and mild degeneration influence the impact-induced failure modes of cartilage-on-bone. Clin Biomech (Bristol, Avon). 2010;25(7):737-44. [DOI] [PubMed] [Google Scholar]
- 15. Goreham-Voss CM, Tochigi Y, Rudert MJ, Brown TD. Contact face geometry as a determinant of cartilage stress during impaction testing. Trans 54th ORS. 2008;33:634. [Google Scholar]
- 16. Aspden RM, Jeffrey JE, Burgin LV. Impact loading of articular cartilage. Osteoarthritis Cartilage. 2002;10(7):588-9. [DOI] [PubMed] [Google Scholar]
- 17. Donnelly D, Rust B. The fast Fourier transform for experimentalists, part 1: concepts. Comput Sci Eng. 2005;7(5): 80-8. [Google Scholar]
- 18. Trubshaw RN. Resonance and signal conditioning in instrumented impact testing. Polym Test. 1986;6:387-401. [Google Scholar]
- 19. Pritzker KP, Gay S, Jimenez SA, Ostergaard K, Pelletier JP, Revell PA, et al. Osteoarthritis cartilage histopathology: grading and staging. Osteoarthritis Cartilage. 2006;14(1):13-29. [DOI] [PubMed] [Google Scholar]
- 20. Harrell FE. Regression modeling strategies: with applications to linear models, logistic regression, and survival analysis. New York: Springer-Verlag; 2001. [Google Scholar]
- 21. Shrout PE, Fleiss JL. Intraclass correlations: uses in assessing rater reliability. Psychol Bull. 1979;86(2):420-8. [DOI] [PubMed] [Google Scholar]
- 22. Mankin HJ, Dorfman H, Lippiello L, Zarins A. Biochemical and metabolic abnormalities in articular cartilage from osteo-arthritic human hips: II. Correlation of morphology with biochemical and metabolic data. J Bone Joint Surg Am. 1971;53(3):523-37. [PubMed] [Google Scholar]
- 23. ICRS Cartilage Injury Evaluation Package. http://www.cartilage.org/_files/contentmanagement/ICRS_evaluation.pdf.


