Abstract
The acquisition and analysis of high resolution one- and two- dimensional solid-state NMR spectra without chemical shift frequencies are described. Many variations of Shiftless NMR spectroscopy are feasible. A two-dimensional experiment that correlates 13Cα-15N dipole-dipole and 1H-13Cα dipole-dipole couplings in single crystal and powder samples of the model peptide, 13Cα, 15N-acetylleucine, is demonstrated. In addition to the resolution of resonances from individual sites in a single crystal sample, the bond lengths and angles are characterized by the two-dimensional powder pattern obtained from a polycrystalline sample.
Pake doublets, which result from the dipole-dipole interactions between nuclei, are among the most distinctive and thoroughly analyzed features of solid-state NMR spectra. Immediately following the initial demonstrations of the phenomenon of nuclear magnetic resonance, the first application of NMR to a chemical problem described the effects of the local magnetic fields resulting from dipole-dipole couplings between two neighboring nuclei on the spectra1. Since the frequency splittings between the doublets could be used to distinguish between molecules with different orientations in the magnetic field, this established NMR as a high resolution method. And since these frequencies depended only upon the positions of the atomic nuclei, as manifested in their through-space (1/r3) and angular dependencies (3cos2θ−1), this established NMR as a structure determination method. The classic Pake doublet also reveals the complementary nature of spectra obtained from single crystal and polycrystalline samples whose lineshapes can be analyzed in terms of structural and motional factors2.
The discovery of frequency shifts due to differences in local electronic environments came later3. Subsequently, with the development of homogeneous and stable high field magnets, the chemical shift became the principal source of the frequency dispersions and empirical correlations essential for chemical analysis. The complex theoretical dependence of chemical shift frequencies on local electronic factors4 limits their usefulness in more fundamental investigations. However, with the availability of large databases of protein resonances, isotropic chemical shift frequencies measured in both solution-state NMR and MAS (magic angle spinning) solid-state NMR spectra now serve as valuable constraints in structure determinations5. The anisotropic chemical shift frequencies observed in solid-state NMR spectra of aligned samples provide valuable input for the calculation of protein structures6. However, the site-to-site variabilities among the principal elements and their orientations in the molecular frame, which are only now being quantified in proteins7, compromise the contributions of the anisotropic chemical shift frequencies to structure determination. In practice, the chemical shift frequencies are typically the largest source of error in the calculations of the three-dimensional structures of proteins in membranes and other supramolecular complexes.
SLF (separate local field) spectroscopy8 is a method for measuring individual dipole-dipole coupling frequencies. Each resonance in a two-dimensional SLF spectrum is characterized by the frequencies associated with a local field due to heteronuclear dipole-dipole coupling between bonded nuclei (e.g., 1H-13C or 1H-15N) and the chemical shift of the observed nucleus (e.g. 13C or 15N). PISEMA (polarization inversion spin exchange at the magic angle)9 and other high resolution SLF experiments10 are capable of yielding fully-resolved solid-state NMR spectra of uniformly 15N labeled proteins. We have recently introduced an experiment for proton-detected separated local field spectroscopy11, which provides both increased sensitivity and background for the experiments described in this Communication. Since both the dipolar coupling and chemical shift frequencies measured from these spectra are orientationally dependent, they can be used as input for the calculation of three-dimensional structures of proteins. However, the reliability and precision of the dipolar coupling frequencies make them especially useful for the direct analysis of secondary structure and any deviations from ideality12. The limitations of the chemical shift frequencies in structural analysis can be ameliorated by determining the chemical shift tensors for each atomic site, but at the cost of a considerable extra burden on the experimental studies of macromolecules. A simpler approach is to simply eliminate the chemical shift in NMR spectroscopy, and rely only on dipolar couplings.
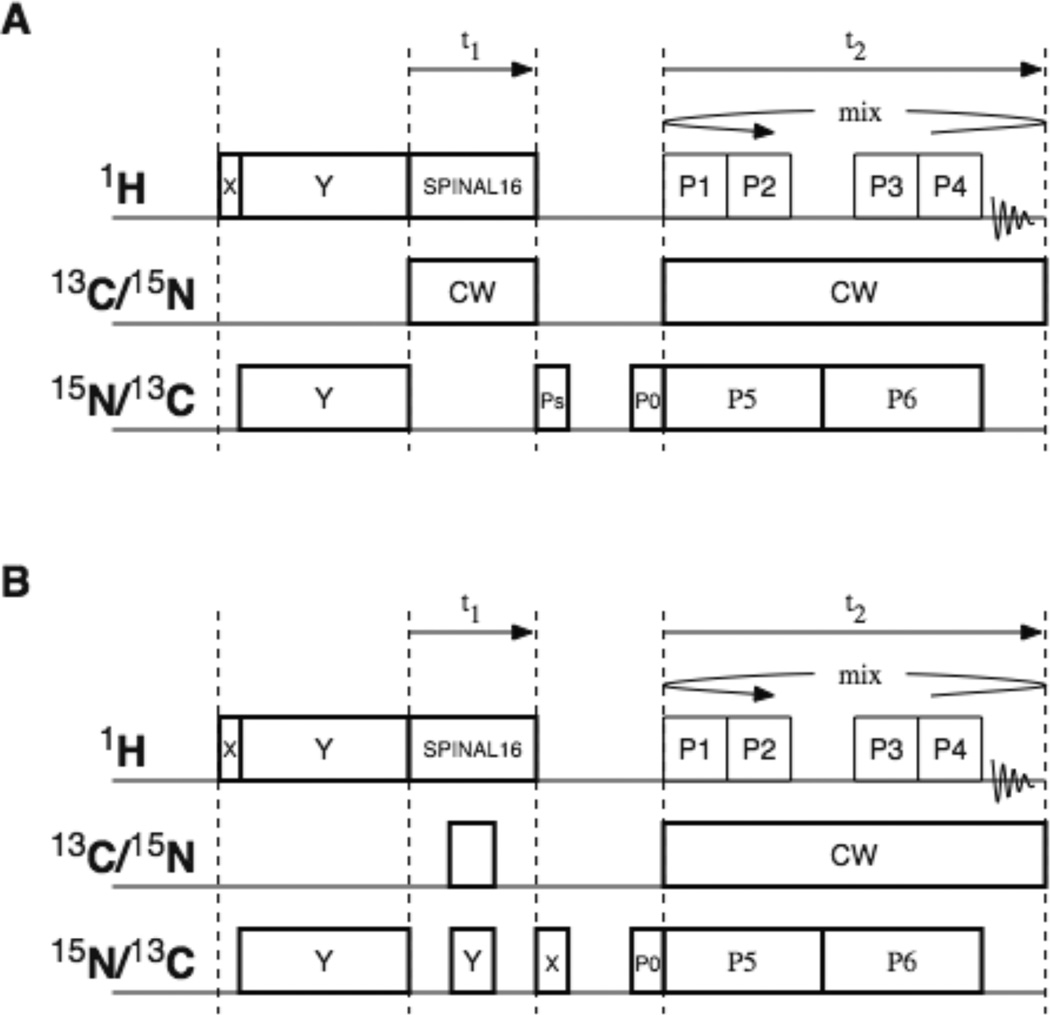
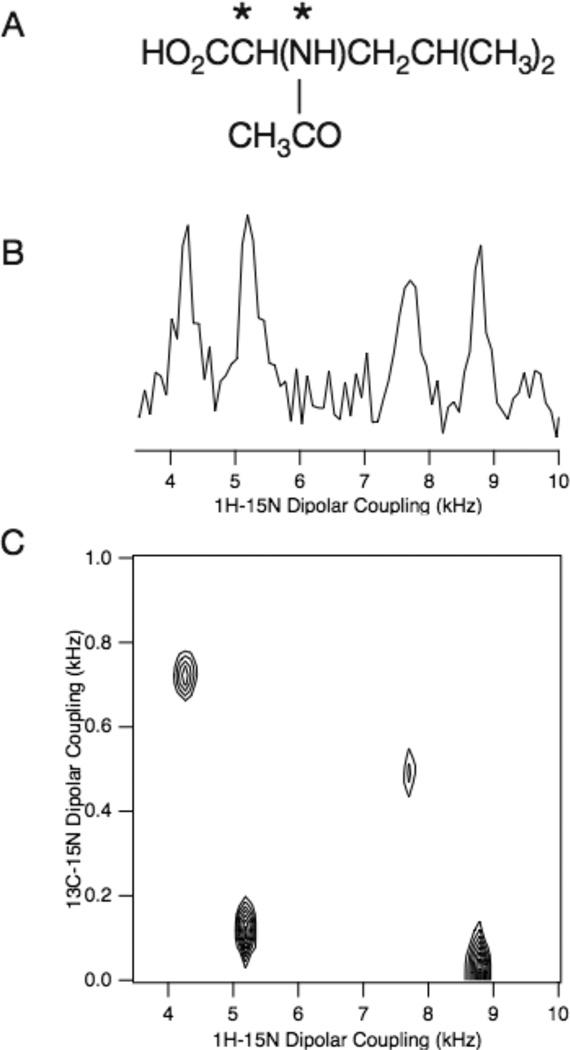
The potential of Shiftless NMR spectroscopy for structure determination is implicit in the original Pake experiment1; however, experimental implementation for proteins starting from the concepts and practice of SLF spectroscopy has required many developments. We have only recently been able to demonstrate “indirect” proton-detection of frequency-encoded magnetization from 13C or 15N in stationary samples11, which is an essential element if extra time domains (and frequency dimensions) are to be avoided. The pulse sequences diagrammed in Figure 1 incorporate windows within the otherwise continuous 1H irradiations used to effect homonuclear decoupling as the magnetization undergoes heteronuclear spin-exchange. The detection of frequencies from multiple heteronuclear 1H-15 dipole-dipole couplings enable high resolution Shiftless NMR spectra to be recorded, as shown in Figure 2B. Further, by detecting these dipole-dipole coupling frequencies in the direct t2 dimension, it is possible to arrange for the evolution of different heteronuclear dipole-dipole couplings during t1, yielding two-dimensional spectra where both frequency axes are dipole-dipole couplings. The evolution during t1 is restricted to 13C-15N heteronuclear dipole-dipole couplings using methods we previously demonstrated in conventional two-dimensional triple-resonance SLF experiments13. In this example, the 13C-15N couplings modulate the 15N magnetization during t1 followed by 1H-15N heteronuclear spin-exchange during t2. This yields the two-dimensional spectrum in Figure 2C where both frequency axes are heteronuclear dipolar couplings. Notably, there are no chemical shift frequencies in the spectra in Figure 2.
Figure 1.
Timing diagrams for two-dimensional pulse sequences. A. Proton-detected PISEMO’. B. Proton-detected Shiftless NMR. SPINAL-16 refers to the modulation applied to the irradiation used for heteronuclear decoupling18. CW refers to continuous wave irradiation, which is applied only to remove 13C-15N couplings. In both experiments, the 4 pulses applied during the detection time domain (t2) referred to as P1, P2, P3, and P4 correspond to the semi-windowless WaHuHa19 pulse sequence. The phases of the even numbered t2 intervals are the inverse of the phases used in the odd numbered t2 intervals. The duration of these pulses corresponds to a 116° nutation20. The phases in the order of P1, P2, P3, P4, P5, P6 are Y, X, −X, −Y, −Y, Y for the odd numbered t2 cycles; and −Y, −X, X, Y, Y, −Y for the even numbered t2 cycles. To suppress the effects of probe ringing, the phase of P0 is alternated between X and −X while the receiver phase is alternated between X and −X. In the Proton-detected PISEMO’ experiment, the alternation of the phase of PS between X and Y is used to achieve quadrature detection. In the proton-detected Shiftless NMR experiment, π pulses are applied at the 13C and 15N resonance frequencies in the middle of the t1 period in order to allow the 13C-15N dipole-dipole couplings to evolve while the effects of 13C and 15N chemical shift evolution are refocused. The phases of these π pulses do not need to be specified. However, the phase of the π/2 pulse of the bottom timing diagram following t1 is critical, and is chosen to provide maximum signal intensity during detection. The phase of P0 is alternated between X and −X while the receiver phase is also alternated between X and −X to suppress the effects of probe ringing,
Figure 2.
A. Chemical formula for N-acetyl-leucine. The isotopically labeled 13Cα and 15N sites are marked with asterisks. B. One-dimensional Shiftless NMR spectrum. C. Two-dimensional Shiftless NMR spectrum. The sample is a single crystal of 13Cα, 15N labeled N-acetyl-leucine at an arbitrary orientation. The probe is a homebuilt triple-tuned 1H, 13C, and 15N probe with a single 5mm ID solenoid coil. The Bruker Avance II console was interfaced with a Chemagnetics 500 MHz power amplifier and a homebuilt transmit/receive switch built with crossed diodes and a λ /4 coaxial cable suitable for 1H detection. The measured B1 field was 55.6 kHz for all three channels (1H, 13C, and 15N). This corresponds to a 90o pulse width of 4.5 µs and 5.8 µs for the 116o pulse. The spectrum was acquired using the pulse sequence in Figure 1B; the one-dimensional spectrum in (B) is from the first t1 and acquired with 64 scans. Parameters of the two-dimensional spectrum in (C): 16 scans of each of 384 t1 were acquired with dwell time of 25 µs and 34.8 µs in the t1 and t2 dimensions, respectively.
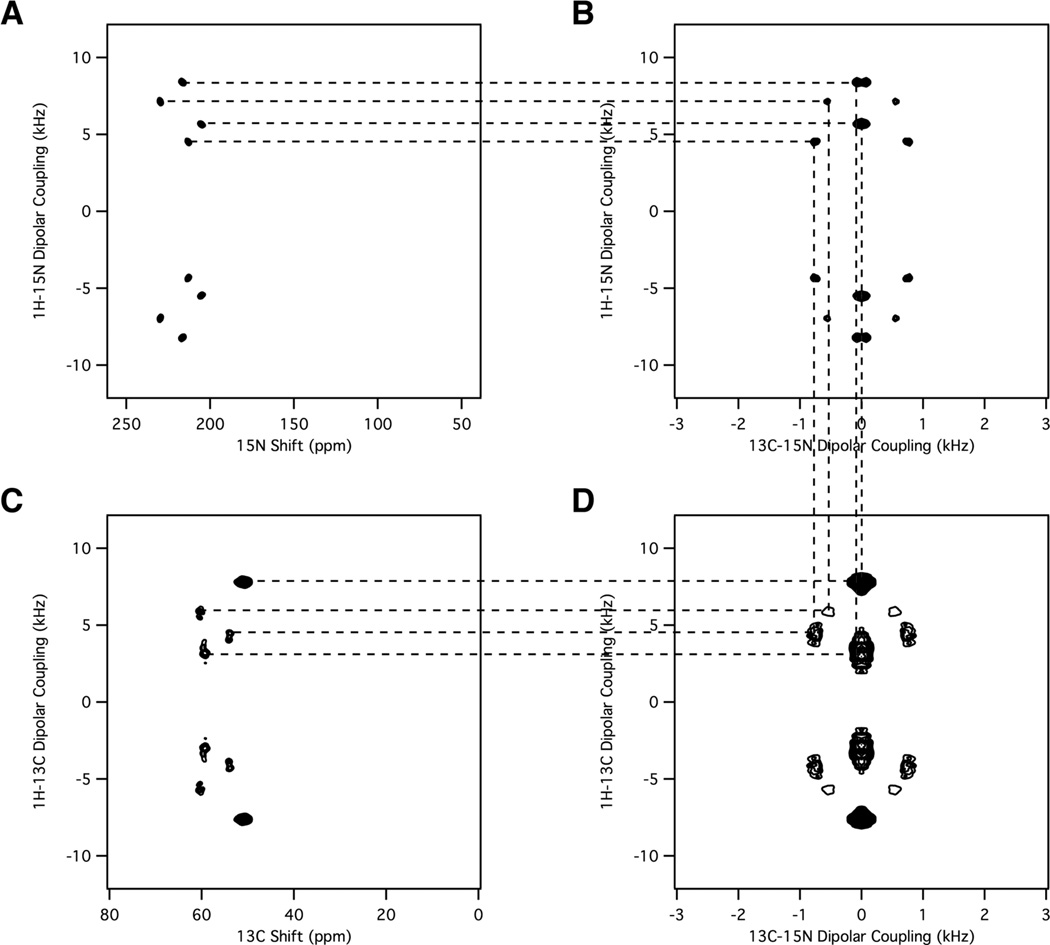
The four two-dimensional spectra in Figure 3 illustrate the connections between SLF and Shiftless NMR experiments as well as between the covalently bonded 13Cα and 15N amide sites of the model peptide sample shown in Figure 2A. Figure 3A and C are two-dimensional SLF spectra. Each spectrum has four resonances because the unit cell of the crystal contains four molecules with unique orientations. The spectra are symmetric about the zero frequency of the dipolar coupling dimension, therefore the unique spectroscopic information is contained in half of the spectrum. Each amide resonance in Figure 3A is characterized by a pair of 15N chemical shift and 1H-15N heteronuclear dipole-dipole coupling frequencies. Correspondingly, each alpha-carbon resonance in Figure 3C is characterized by a pair of 13C chemical shift and 1H-13C heteronuclear dipole-dipole coupling frequencies. There are no spectroscopic connections between the data in Figure 3A and those in Figure 3C because the local fields are separated by their respective 15N and 13C nuclei. The connections illustrated with the dashed lines between the data in the other panels of Figure 3 result from the chemical bond that establishes the close spatial proximity and heteronuclear dipole-dipole coupling between the 13Cα and 15N amide nuclei in each unique molecule in the unit cell.
Figure 3.
Correlations among four two-dimensional NMR spectra. A. Two-dimensional 1H-15N proton-detected PISEMO’ spectrum. B. Two-dimensional 13C-15N / 1H-15N Shiftless NMR spectrum. C. Two-dimensional 1H/13C proton-detected PISEMO’ spectrum. D. Two-dimensional 13C-15N / 1H-13C Shiftless NMR spectrum. The experimental conditions for the four spectra are the same as in Figure 2 except that crystal orientation is slightly different.
The two-dimensional Shiftless spectra in Figure 3B and D also have four resonances. However, since both axes are heteronuclear dipolar coupling frequencies, there are four quadrants symmetrically arranged about the respective zero frequencies. One quadrant from a spectrum similar to that in Figure 3B is shown in Figure 2C. Since the sample is the same for both experiments, they have the same 13C-15N dipole-dipole couplings, as demonstrated by the vertical lines that serve to cross-assign the resonances in the panels. The horizontal lines connect the resonances in the SLF spectra to those in the Shiftless spectra by their 1H-15N or 1H-13C dipole-dipole couplings.
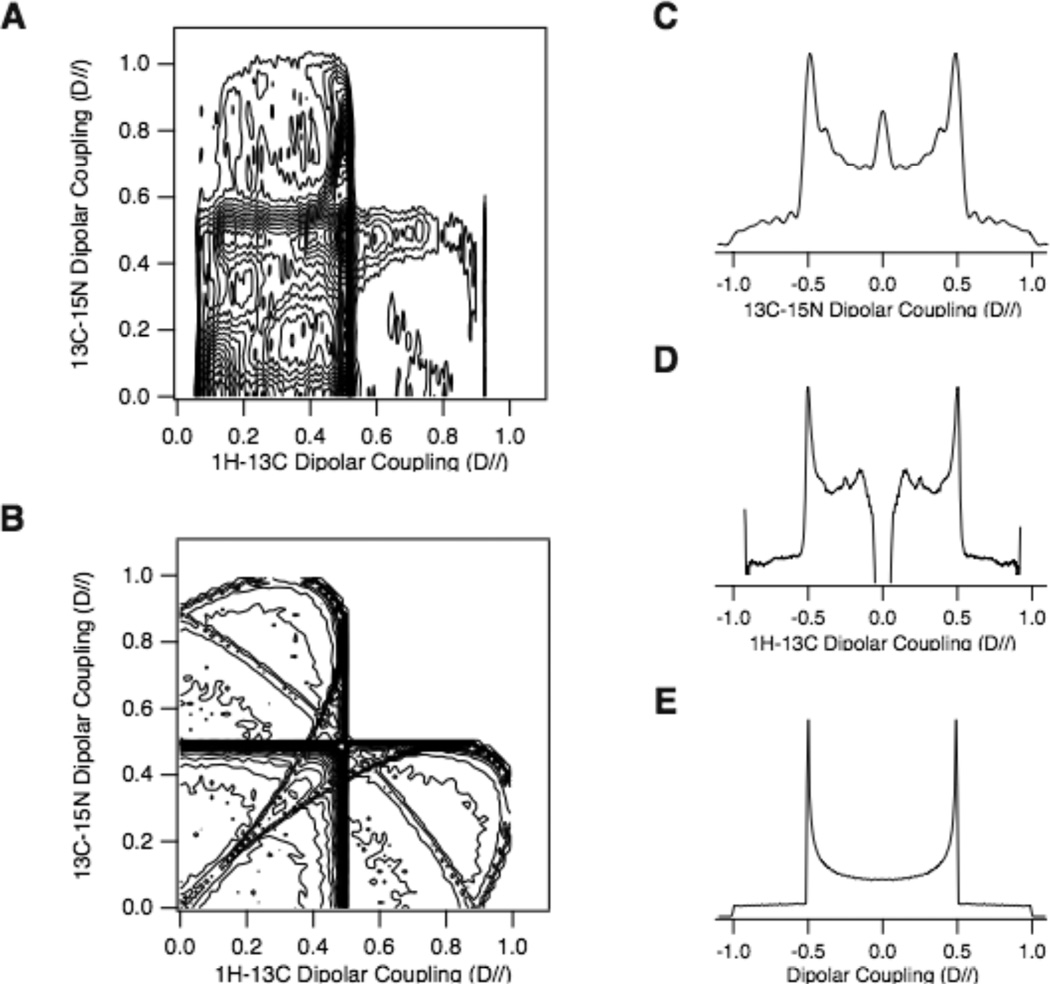
Figure 4 compares experimental and simulated two-dimensional Shiftless NMR spectra of a polycrystalline sample of 13Cα, 15N labeled N-acetyl-leucine (Figure 2A). In these spectra, the 13Cα-15N dipolar couplings are correlated with the 1H-13Cα dipolar couplings (Figure 4A). The spectrum is scaled to the maximum coupling where the relevant bond axis is parallel to the field, D//. The magnitudes of the maximum dipolar couplings, as readily measured from the frequencies of the half maximal discontinuities, are 23.2 kHz and 0.96 kHz for the 1H-13Cα and 13Cα-15N bonds, respectively. These values correspond to bond lengths of 1.09 A for 1H-13Cα and 1.47 A for 13Cα-15N. The relative orientations of pairs of dipolar vectors can be determined from the comparison of the experimental two-dimensional powder spectrum in Figure 4A to the simulations in Figure 4B. This indicates that the angle between the 13Cα-15N bond and the 1H-13Cα bond is about 110°,. Results from X-ray crystallography14 concur with these findings, with an angle of 109°. With individual calibrations of the experimental scaling factors of the pulse sequences, better signal to noise ratios, and iterative fitting of the experimental and simulated spectra, the bond lengths and bond angles determined with these experiments have the potential to be the definitive values because of the reliability of the dipolar couplings as spectroscopic and structural parameters.
Figure 4.
Shiftless NMR spectra of a 13Cα, 15N labeled N-acetyl-leucine polycrystalline sample. A. 13Cα-15N / 1H-13Cα experimental spectrum. B. Simulated Shiftless powder pattern for a polycrystalline sample with angles of 110° between the two bonds. (C) and (D) are the experimental dipolar coupling spectrum from the sum of the two-dimensional spectra in (A) along the (C) 13C-15N and (D) 1H-13C dipolar coupling dimension. They are displayed as a full Pake doublet. E. Simulated Pake doublet. All spectra are scaled with the maximum dipolar splitting, D//. The Shiftless NMR spectrum was acquired using the pulse sequence in Figure 1B. 384 t1 points are acquired with dwell times in the t1 and t2 dimension of 25 µs and 34.8 µs, respectively. The simulation of the Shiftless NMR spectrum used a Monte Carlo method. 106 orientations were generated randomly and the dipolar coupling pair calculated for each orientation. The calculated dipolar coupling pair was analyzed using a two-dimension histogram with a 128 by 128 matrix. The minimum contour level is set to 1; therefore, all orientations are represented in the contour plot.
In Shiftless spectra, individual resonances are resolved from each other on the basis of having one or more different dipolar coupling frequencies rather than different chemical shift frequencies. This can result from having different inter-nuclear distances or orientations of the bonds with respect to the magnetic field. This is demonstrated in Figure 2 where there are four resolved resonances, each of which is characterized by two dipolar coupling frequencies. The overall spectral resolution is approximately the same as that in the corresponding SLF spectra.
An important difference between conventional chemical shift-based and dipolar coupling-based NMR experiments is the effect of magnetic field strength. Chemical shift differences increase linearly in frequency with the field strength, thus there is a high premium on using a spectrometer with the highest magnetic field strength. In contrast, dipole-dipole couplings are independent of field strength. Consequently, Shiftless NMR spectra should experience no loss of resolution when obtained on an inexpensive low field magnet. Of course, there still is the benefit of a high field for sensitivity, but this could be offset by using larger samples, dynamic nuclear polarization methods15, or by repeating the experiments more rapidly in cases where the 1H relaxation time is shorter in the lower field. These experiments should be suited for non-persistent very high field magnets; as long as the field fluctuations are small enough to keep the resonances within the bandwidth of the radiofrequency irradiations, it may not be necessary to utilize complex stabilization procedures16. Similarly, Shiftless NMR spectra are insensitive to inhomogeneities in the applied magnetic field.
Comparisons with zero field NMR17 are revealing, since only the local field due to the dipolar coupling remains at zero field, and the observed signal exhibits high resolution without broadening from chemical shift effects. Observing the dipolar couplings from a polycrystalline sample with Shiftless NMR experiments have similar benefits, since the spectrum is also devoid of chemical shift perturbations, and most of the signal intensity is around the singularity at 3cos2θ − 1 = 1.0. Both zero field and Shiftless NMR benefit from being performed in a high field magnet for sensitivity. However, the Shiftless experiments have the advantage that they much simpler to perform, since there is no need for an apparatus to physically shuttle the sample between the center of the magnet where polarization occurs and a region where the zero field can be arranged.
A goal of protein structure determination by solid-state NMR of aligned samples is to eliminate the chemical shifts with their inherent site-to-site variations from the calculations. Protein structures can be calculated solely from a sufficient number of measured dipolar couplings. In principle, this is possible using combinations of conventional SLF and related experiments13; however, the use of Shiftless NMR experiments reduces the dimensionality and further improves the efficiency through the increased sensitivity that accompanies proton-detection. Solid-state NMR spectra of both aligned and powder samples can exhibit evidence of motional averaging, and here too the results will be more definitive using only dipolar couplings. The two-dimensional Shiftless NMR spectra of powder samples can be used to characterize the most fundamental aspects of molecular structures, such as the angle between two bonds. The bond lengths can be measured from the one-dimensional projections of these spectra, which as shown in Figure 4C–E are Pake doublets1.
Acknowledgments
This research was supported by grants RO1EB001966 and RO1GM075877 from the National Institute of Health, and utilized the Resource of NMR Molecular Imaging of Proteins supported by grant P41EB002031.
References
- 1.Pake GE. J Chem Phys. 1948;16(4):327. [Google Scholar]
- 2.Andrew ER, Eades RG. Proceedings of the Physical Society A. 1953;66(4):415. [Google Scholar]
- 3.Dickinson WC. Physical Review. 1950;77(5):736. [Google Scholar]; Gutowsky HS, Hoffman CJ. Physical Review. 1950;80(1):110. [Google Scholar]; Proctor WG, Yu FC. Physical Review. 1950;77(5):717. [Google Scholar]
- 4.Ramsey NF. Physical Review. 1952;86(2):243. [Google Scholar]
- 5.Cornilescu G, Delaglio F, Bax A. J Biomol NMR. 1999;13(3):289. doi: 10.1023/a:1008392405740. [DOI] [PubMed] [Google Scholar]
- 6.Zeri AC, Mesleh MF, Nevzorov AA, Opella SJ. Proc Natl Acad Sci U S A. 2003;100(11):6458. doi: 10.1073/pnas.1132059100. [DOI] [PMC free article] [PubMed] [Google Scholar]
- 7.Wylie BJ, Sperling LJ, Frericks HL, Shah GJ, Franks WT, Rienstra CM. J Amer Chem Soc. 2007;129:5318. doi: 10.1021/ja0701199. [DOI] [PubMed] [Google Scholar]
- 8.Waugh JS. Proc Natl Acad Sci U S A. 1976;73(5):1394. doi: 10.1073/pnas.73.5.1394. [DOI] [PMC free article] [PubMed] [Google Scholar]
- 9.Wu CH, Ramamoorthy A, Opella SJ. J. Magn. Reson. A. 1994;109:270. [Google Scholar]
- 10.Nevzorov AA, Opella SJ. J Magn Reson. 2007;185(1):59. doi: 10.1016/j.jmr.2006.09.006. [DOI] [PubMed] [Google Scholar]; Yamamoto K, Dvinskikh SV, Ramamoorthy A. Chem Phys Lett. 2006;419:533. [Google Scholar]; Schmidt-Rohr K, Nanz D, Emsley L, Pines A. J. Phys. Chem. 1994;98:6668. [Google Scholar]
- 11.Wu CH, Opella S. 2007 submitted. [Google Scholar]
- 12.Mesleh MF, Opella SJ. J Magn Reson. 2003;163(2):288. doi: 10.1016/s1090-7807(03)00119-8. [DOI] [PubMed] [Google Scholar]
- 13.Sinha N, Grant CV, Park SH, Brown JM, Opella SJ. J Magn Reson. 2007;186(1):51. doi: 10.1016/j.jmr.2007.01.014. [DOI] [PMC free article] [PubMed] [Google Scholar]
- 14. unpublished results. [Google Scholar]
- 15.Rosay M, Zeri AC, Astrof NS, Opella SJ, Herzfeld J, Griffin RG. J Am Chem Soc. 2001;123(5):1010. doi: 10.1021/ja005659j. [DOI] [PubMed] [Google Scholar]
- 16.Soghomonian V, Cotton M, Rosanke R, Cross TA. J Magn Reson. 1997;125:212. doi: 10.1006/jmre.1997.1115. [DOI] [PubMed] [Google Scholar]
- 17.Thayer AM, Pines A. Accounts of Chemical Research. 1987;20:47. [Google Scholar]
- 18.Fung BM, Khitrin AK, Ermolaev K. J Magn Reson. 2000;142:97. doi: 10.1006/jmre.1999.1896. [DOI] [PubMed] [Google Scholar]; Sinha N, Grant CV, Wu CH, DeAngelis AA, Howell SC, Opella SJ. J. Magn. Reson. 2005;177:197. doi: 10.1016/j.jmr.2005.07.008. [DOI] [PubMed] [Google Scholar]
- 19.Waugh JS, Huber LM, Haeberlen U. Phys Rev Lett. 1968;20:180. [Google Scholar]
- 20.Haeberlen U. High Resolution NMR in Solids: Selective Averaging. Adv Magn Reson. 1976:114. [Google Scholar]


